. 2019 Aug 19;9(1):12070.
doi: 10.1038/s41598-019-48445-1.

An emerging trend of rapid increase of leukemia but not all cancers in the aging population in the United States

Affiliations

An emerging trend of rapid increase of leukemia but not all cancers in the aging population in the United States

Taisen Hao et al. Sci Rep. .

Abstract

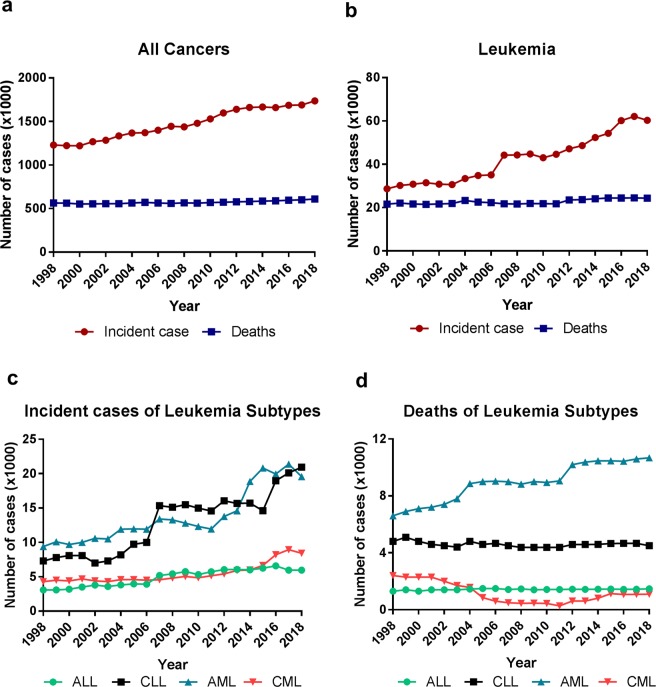
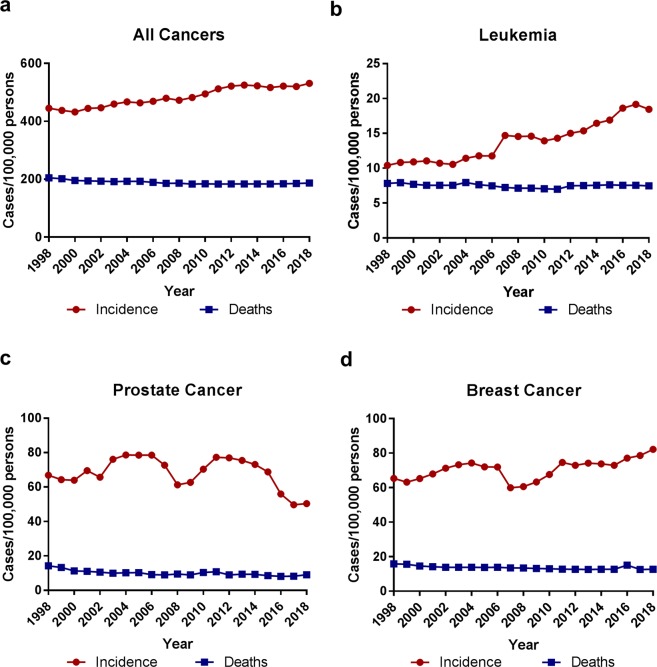
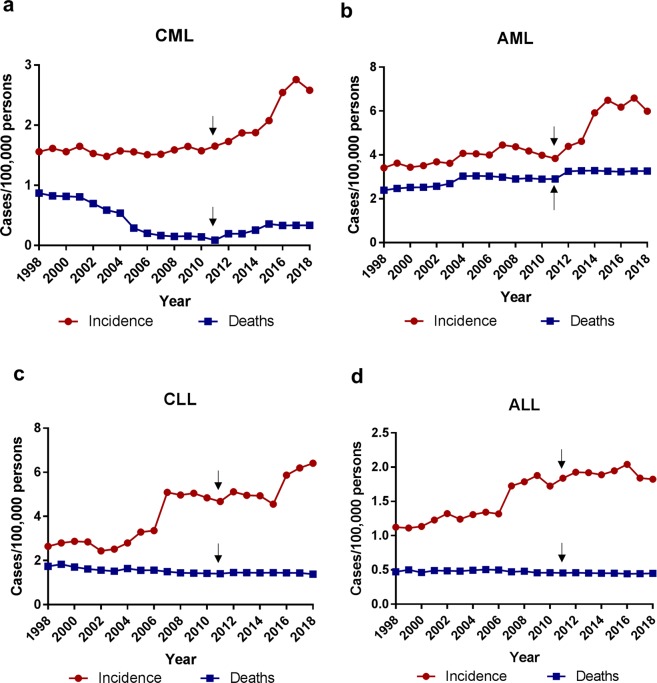
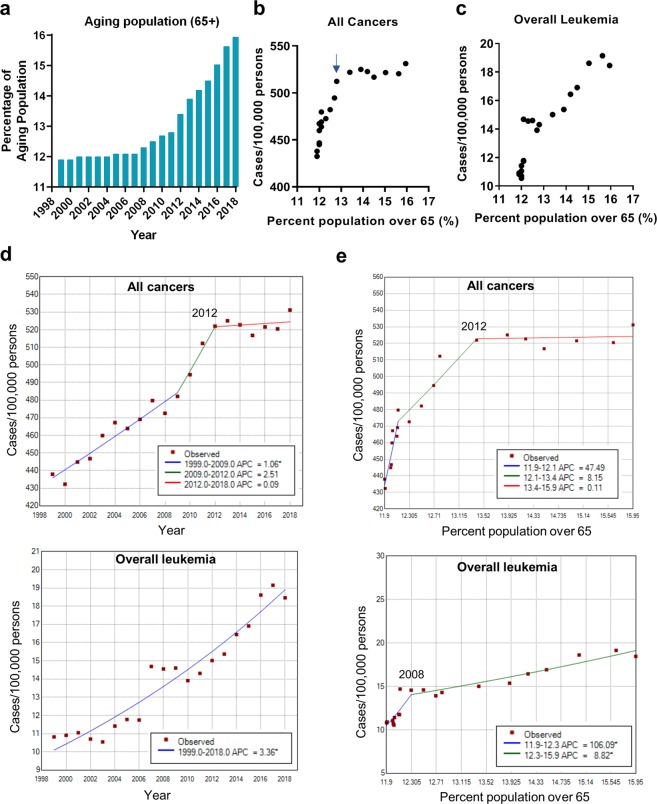
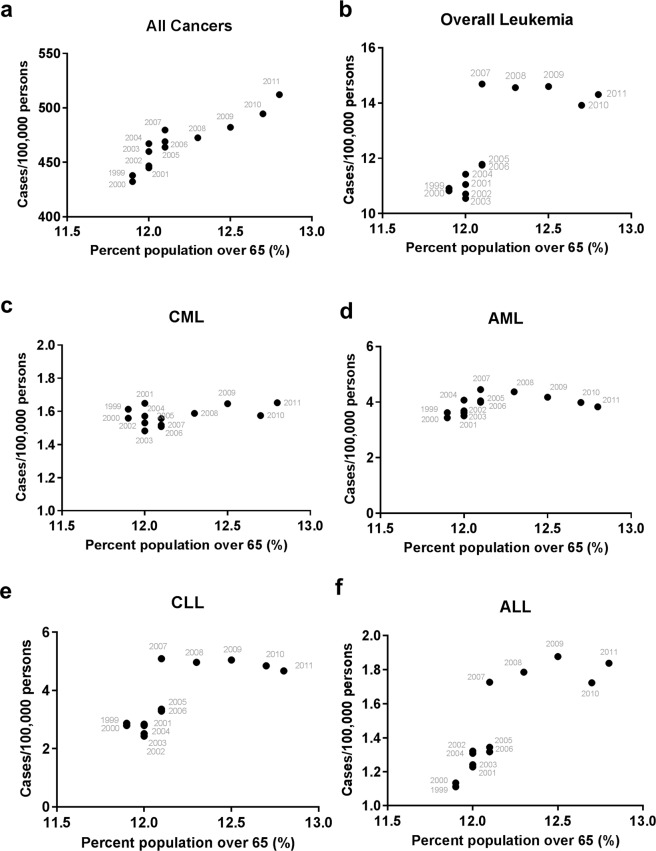
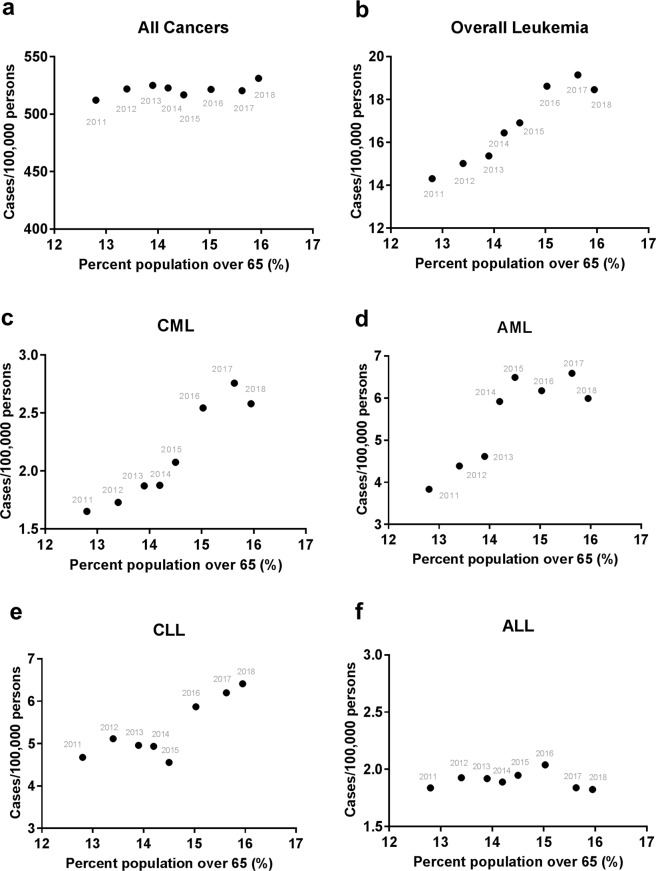
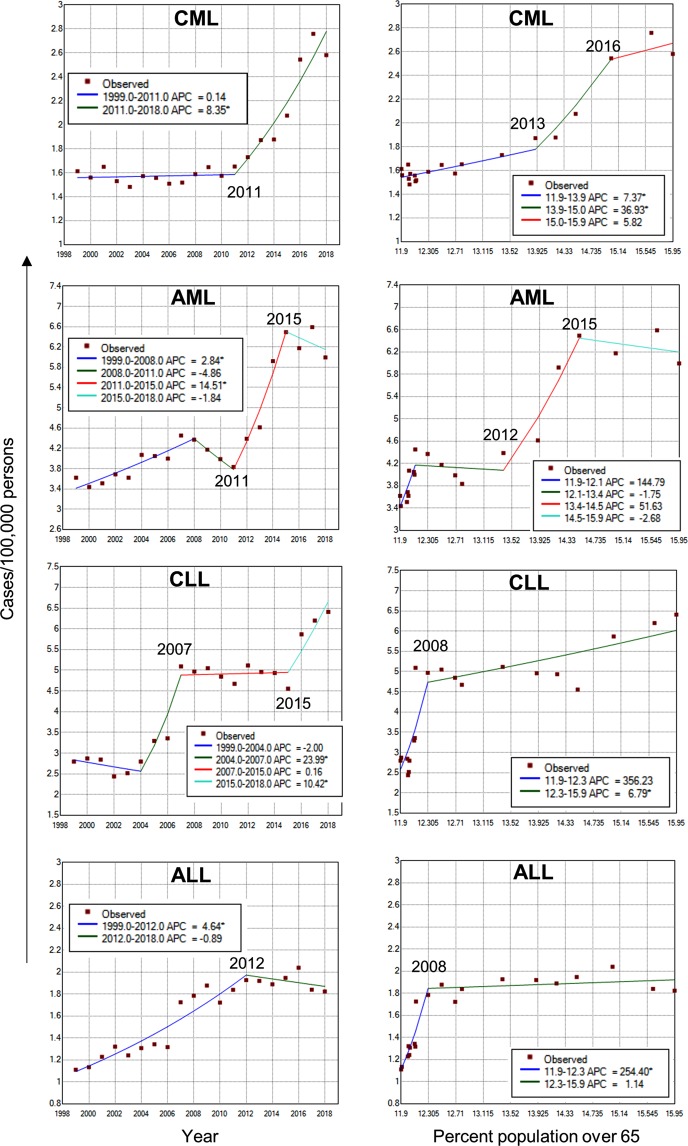
The "baby boomers" born in 1946-1964 in the United States (U.S.) started to reach the age of 65 in 2011, rapidly accelerating U.S. population aging. There are great public concerns about its impact on health care with anticipation of rising cancer incidences. We examined the incidences and deaths of leukemia and overall cancer in the U.S. from 1998 to 2018. The acute myeloid leukemia (AML) and chronic myeloid leukemia (CML) incidences remained constant prior to 2011 but have climbed up substantially since then, and the chronic lymphocytic leukemia (CLL) incidence has increased continuously since 1998. The significant increase of myeloid leukemia and CLL incidences was strongly correlated with the U.S. population aging. The incidence of all cancers was increased in correlation with a small increase in aging population prior to 2011, but surprisingly has changed marginally since 2011, which was not significantly correlated with the accelerated population aging. We observed the most substantial decline of deaths with CML, whereas AML deaths continued to rise in the past 20 years. In conclusion, the overall cancer incidence was not increased as fast as previously feared with aging Americans; however, the incidences of myeloid leukemia and CLL significantly outpaced that of all cancers.


Conflict of interest statement

The authors declare no competing interests.

Figures

Figure 1
Figure 1
The incident cases and deaths of leukemia and all cancers in the United States from 1998 to 2018. (a,b) Incident cases and deaths of all cancers (a) and leukemia (b). (c) Incident cases of four major subtypes of leukemia. (d) Deaths of four subtypes of leukemia.
Figure 2
Figure 2
The population-adjusted incidences and deaths of leukemia and other cancers in the United States from 1998 to 2018. Comparison of population-adjusted incidences and deaths of all cancers (a) vs leukemia (b), prostate cancer (c), and breast cancer (d). The rates for incidences and deaths were normalized to total population in each year.
Figure 3
Figure 3
The population-adjusted incidences and deaths of four major subtypes of leukemia. The arrows indicate year 2011 that displayed the lowest CML death rate and marked the turn for rapid increase of myeloid leukemia.
Figure 4
Figure 4
Correlation of the US population aging and cancer incidences. (a) The changes of aging population (>65 years) in the United States from 1999 to 2018. (b,c) Pearson’s correlation analysis of aging population vs all cancers (b) and overall leukemia (c). The arrow indicates year 2011 that “baby boomers” started to reach the age of 65. (d,e) Joinpoint regression trend analysis of all cancers and overall leukemia with year (d) or percent population over 65 (e) as the variable. The years for the last joinpoints were indicated.
Figure 5
Figure 5
Correlation of the US population aging and cancer incidences before 2011. Pearson’s r correlation plots for aging population against (a) all cancers, (b) overall leukemia, (c) CML, (d) AML, (e) CLL, and (f) ALL incidences prior to the year 2011.
Figure 6
Figure 6
Correlation of the US population aging and cancer incidences after 2011. Pearson’s r correlation plots for aging population against (a) all cancers, (b) overall leukemia, (c) CML, (d) AML, (e) CLL, and (f) ALL incidences after the year 2011.
Figure 7
Figure 7
Joinpoint regression analysis of leukemia subtypes. Joinpoint trend analysis of four major leukemia subtypes using the year (left) or the percent population over 65 (right) as the variable. The years for the last two joinpoints were indicated.

References

    1. Siegel RL, Miller KD, Jemal A. Cancer statistics, 2018. CA: a cancer journal for clinicians. 2018;68:7–30. doi: 10.3322/caac.21442. - DOI - PubMed
    1. Ghazawi FM, et al. Analysis of acute myeloid leukemia incidence and geographic distribution in Canada from 1992 to 2010 reveals disease clusters in Sarnia and other industrial US border cities in Ontario. Cancer. 2019;125:1886–1897. doi: 10.1002/cncr.32034. - DOI - PubMed
    1. Snodgrass R, et al. Incidence of acute lymphocytic leukemia in Calgary, Alberta, Canada: a retrospective cohort study. BMC research notes. 2018;11:104. doi: 10.1186/s13104-018-3225-9. - DOI - PMC - PubMed
    1. Solans M, et al. Challenges in assessing the real incidence of chronic lymphocytic leukemia: 16 years of epidemiological data from the province of Girona, Spain. Cancer causes & control: CCC. 2018;29:379–382. doi: 10.1007/s10552-018-1004-5. - DOI - PubMed
    1. Song X, et al. Incidence, Survival, and Risk Factors for Adults with Acute Myeloid Leukemia Not Otherwise Specified and Acute Myeloid Leukemia with Recurrent Genetic Abnormalities: Analysis of the Surveillance, Epidemiology, and End Results (SEER) Database, 2001–2013. Acta haematologica. 2018;139:115–127. doi: 10.1159/000486228. - DOI - PubMed

Publication types