. 2019 Aug 19;9(1):12059.
doi: 10.1038/s41598-019-48557-8.

The p21 dependent G2 arrest of the cell cycle in epithelial tubular cells links to the early stage of renal fibrosis

Affiliations

The p21 dependent G2 arrest of the cell cycle in epithelial tubular cells links to the early stage of renal fibrosis

Takayuki Koyano et al. Sci Rep. .

Abstract

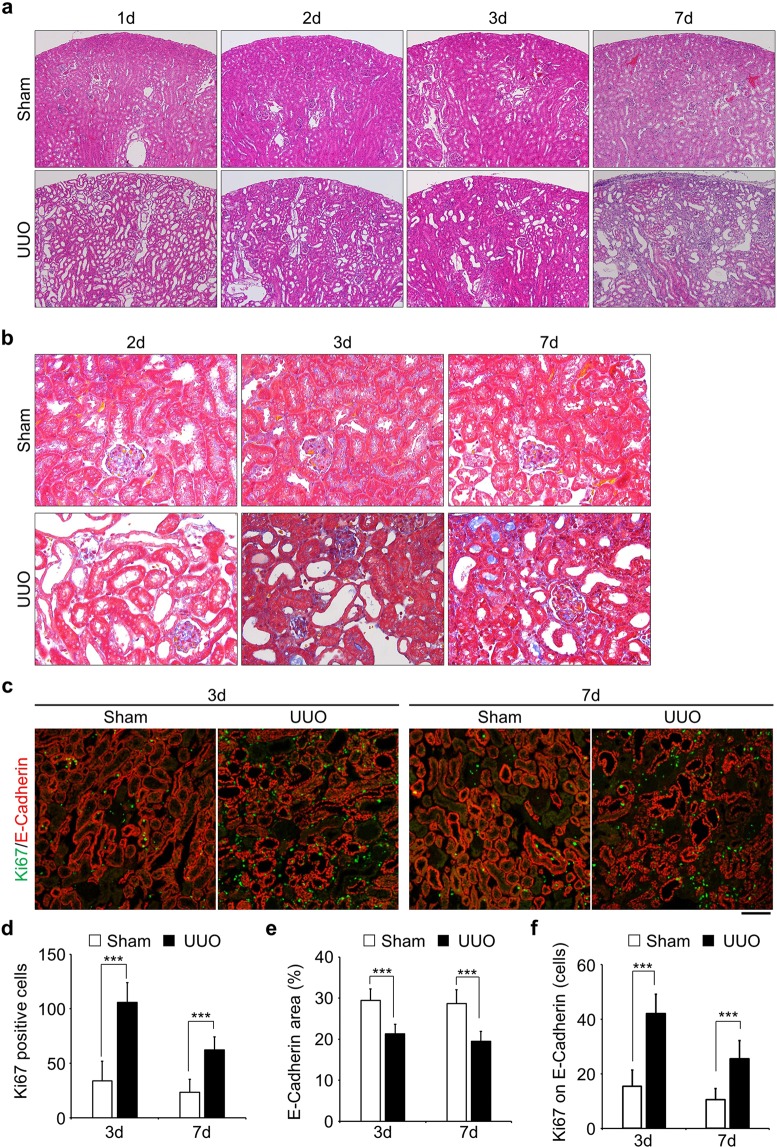
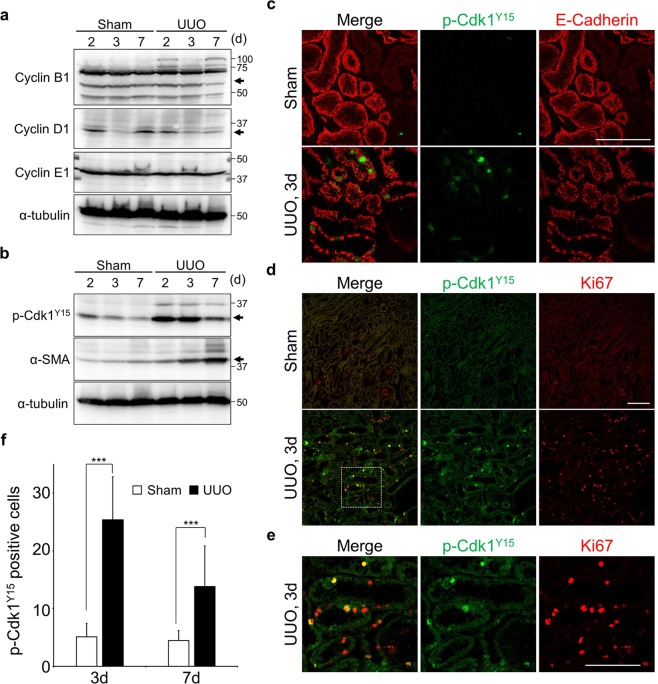
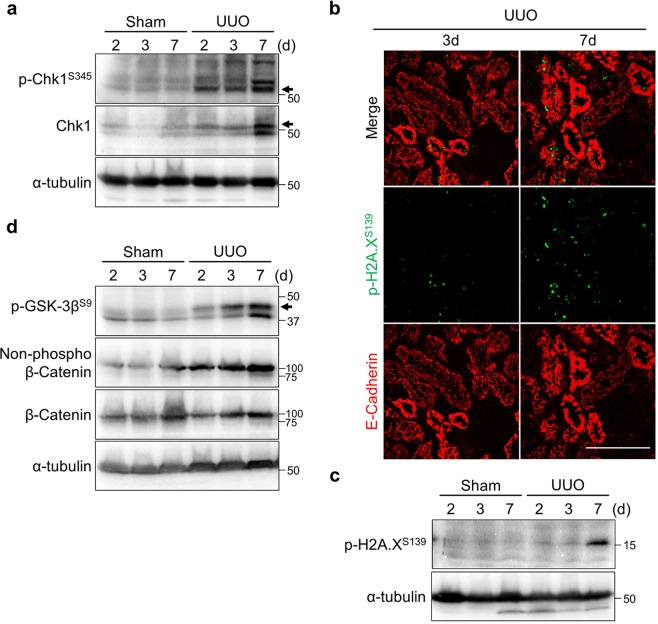
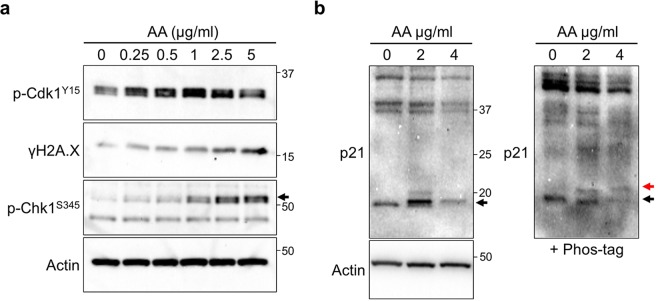
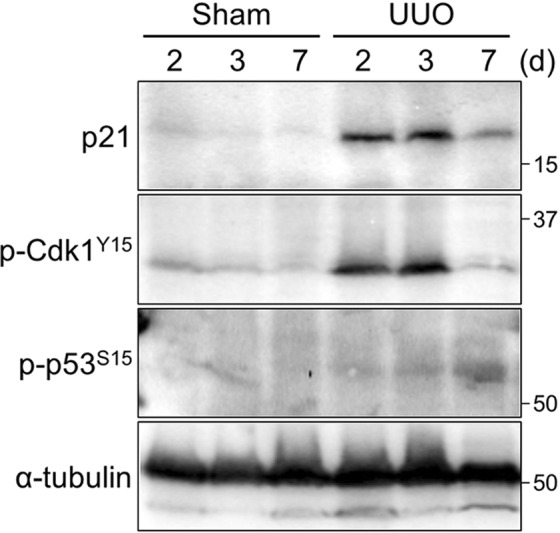
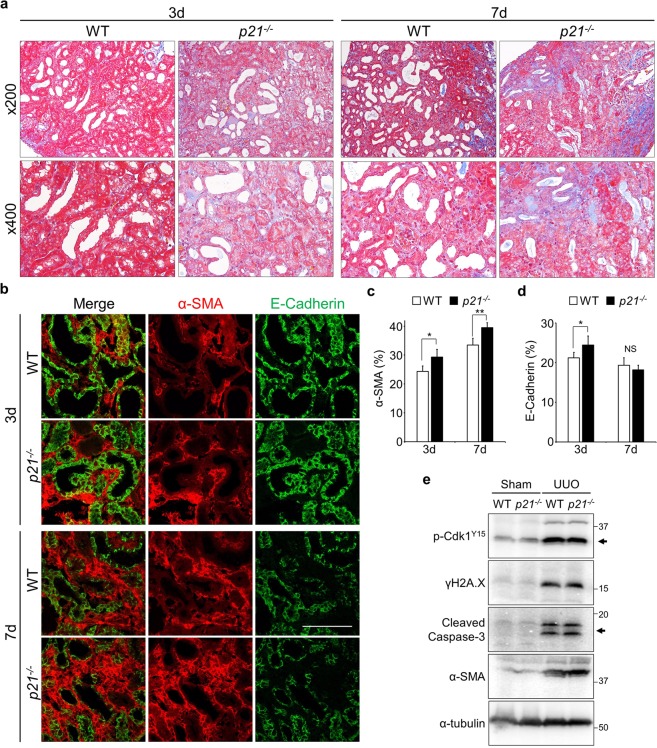
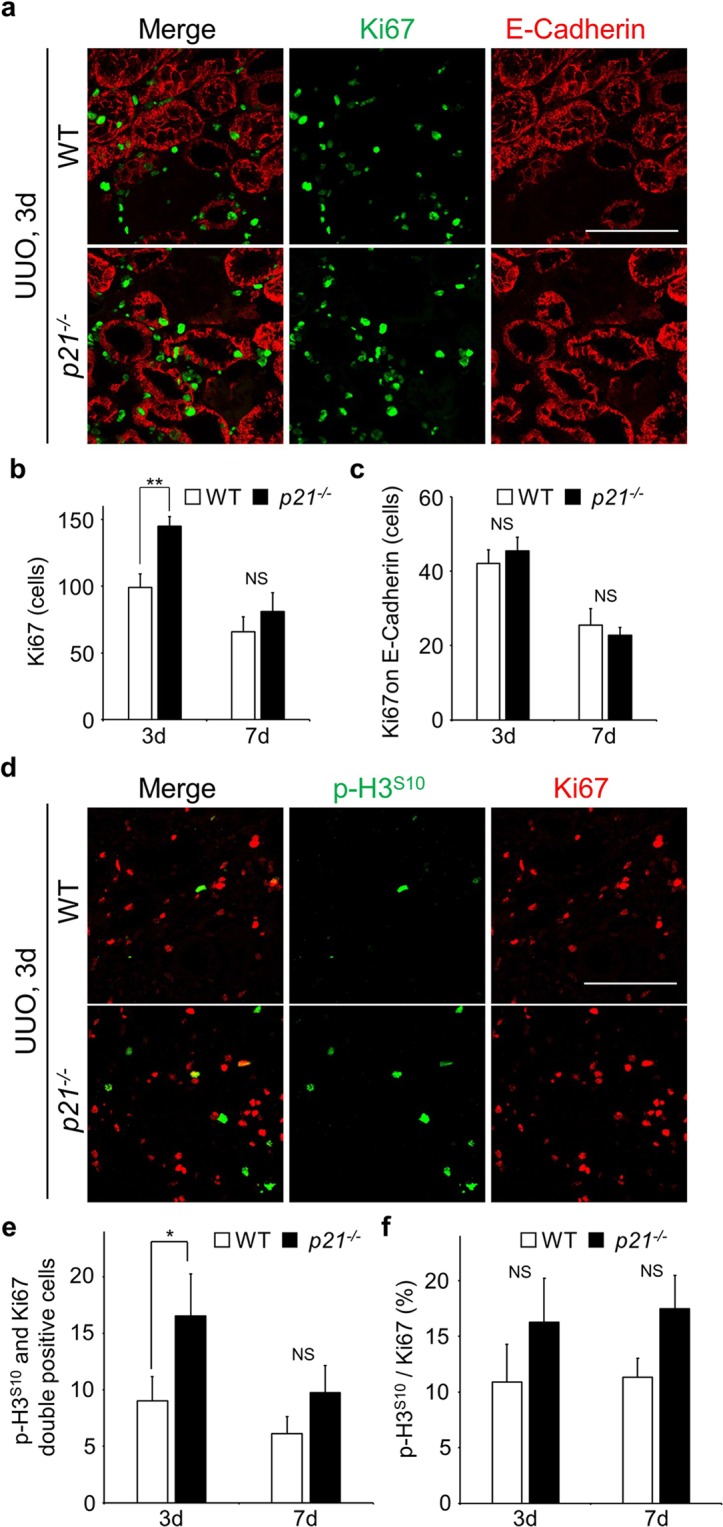
Renal fibrosis is accompanied by the progression of chronic kidney disease. Despite a number of past and ongoing studies, our understanding of the underlying mechanisms remains elusive. Here we explored the progression of renal fibrosis using a mouse model of unilateral ureter obstruction. We found that in the initial stage of damage, where extracellular matrix was not yet deposited, proximal tubular cells arrested at G2 of the cell cycle. Further analyses indicated that the cyclin-dependent kinase inhibitor p21 is partially involved in the G2 arrest after the damage. A newly produced monoclonal antibody against p21 revealed that levels of p21 were sharply upregulated in response to the damage during the initial stage but dropped toward the later stage. To investigate the requirement of p21 for the progression of renal fibrosis, we constructed the novel p21 deficient mice by i-GONAD method. Compared with wild-type mice, p21 deficient mice showed exacerbation of the fibrosis. Thus we propose that during the initial stage of the renal damage, tubular cells arrest in G2 partially depending on p21, thereby safeguarding kidney functions.


Conflict of interest statement

The authors declare no competing interests.

Figures

Figure 1
Figure 1
Epithelial tubular cells go into proliferative cycle upon obstruction of kidney. (a) Staining of Hematoxylin and Eosin (HE) of kidney slices obtained from various time points after obstruction. Sham-operated kidneys were used as a control. Images were taken at x100 magnification. (b) Masson’s trichrome staining. Fibrosis stained in blue. Images were taken at x400 magnification. (c) Co-immunostaining with Anti-Ki67 (green) and Anti-E-Cadherin (red). Ki67 was used for the identification of proliferative cells and E-Cadherin stained epithelial tubular cells. Bar, 100 µm. (d and e) Quantification of the number of Ki67 positive cells (d, n = 15) and E-Cadherin stained area (e, n = 15). (f) The number of Ki67 positive cells on E-Cadherin stained area (the number of Ki67 and E-Cadherin double stained area, n = 15). Data are as given averages ± SD (Standard Deviation); ***P < 0.001 (two-tailed unpaired Student’s t-test).
Figure 2
Figure 2
The number of the G2 cells increases prior to development of fibrosis. (a) Immunoblotting of tissue lysates from indicated samples. α-tubulin was used as the loading control. (b) Immunoblotting of tissue lysates from indicated samples. α-SMA and α-tubulin were used as markers for fibrosis and a loading control, respectively. The molecular weights (kDa) are shown in the right-hand side of the images. Arrows indicate the height of intended bands. (c) Co-immunostaining with Anti-p-Cdk1Y15 (green) and E-Cadherin (red). Scale bar, 100 µm. (d,e) Co-immunostaining with Anti-p-Cdk1Y15 (green) and Ki67 (red). Surrounded area is enlarged in (e). Scale bars, 100 µm. (f) Quantification of the number of p-Cdk1Y15 positive cells (n = 15). Data are as given averages ± SD; ***P < 0.001 (two-tailed unpaired Student’s t-test).
Figure 3
Figure 3
Activation of the DNA damage checkpoint and Wnt/β-catenin are induced in late stage of renal damage. (a) Immunoblotting with indicated antibodies of tissue lysates from indicated samples. (b) Co-immunostaining with Anti-p-H2A.XS139 (γH2A.X) (green) and E-Cadherin (red). Scale bar, 100 µm. (c) Immunoblotting of tissue lysates from indicated samples. Of note, γH2A.X was clearly detected 7 days after the injury in our hands. (d) Immunoblotting with indicated antibodies of tissue lysates from indicated samples. The molecular weights (kDa) are shown in the right side of the images. Arrows indicate the height of intended bands. Non-phosphorylated β-catenin means active form of β-catenin.
Figure 4
Figure 4
p21 is involved in the response to the damage in vitro. (a) Immunoblotting with indicated antibodies of lysates from Aristolochic Acids (AA) treated HK-2 cells. AA was added into medium and cells were sampled after 24 h. Arrows indicate the height of intended bands. (b) Immunoblotting with anti-p21 of AA treated HK-2 cell lysates. Samples were separated in the presence (right) or absence (left) of 25 µM Phos-tag acrylamide containing SDS-PAGE gel. In the Phos-tag containing gel, the red and black arrows indicate the phosphorylated or non-phosphorylated p21, respectively.
Figure 5
Figure 5
p21 is involved in the response to renal damage. Immunoblotting with a monoclonal p21 antibody of tissue lysates from indicated samples. The molecular weights (kDa) are shown in the right-hand side of the images.
Figure 6
Figure 6
Impact of p21 on renal fibrosis progression. (a) Masson’s trichrome staining of tissues from WT and p21−/− mice. Upper panels are low magnifications (x200) and lower panels were high magnifications (x400). (b) Immunostaining staining of obstructed kidneys in WT and p21−/− mice. Scale bar, 100 µm. (c,d) The quantification of α-SMA (c) and E-Cadherin (d). N = 3 different mice for each time points in each genotypes. Data are as given averages ± SD; *P < 0.05; **P < 0.01. NS, Not Significant (two-tailed unpaired Student’s t-test). (e) Immunoblotting with indicted antibodies of tissue lysates from 7 days after the injury.
Figure 7
Figure 7
The proliferative cells are increased in p21 deficient mice. (a) Co-immunostaining with Anti-Ki67 (green) and Anti-E-Cadherin (red). Scale bar, 100 µm. (b) Quantification of the number of Ki67 positive cells. (c) The number of Ki67 positive cells on E-Cadherin stained area (Ki67 and E-Cadherin double stained cells). N = 3 different mice for each time points in each genotypes. (d) Co-immunostaining with Anti-p-H3S10 (green) and Anti-Ki67 (red). Scale bar, 100 µm. (e) The number of p-H3S10 and Ki67 double positive cells. (f) The ratio of p-H3S10 per Ki67. Values were calculated by dividing the number of p-H3S10 and Ki67 double positive cells by the number of Ki67. N = 3 different mice for each time points in each genotypes. Data are as given averages ± SD; *P < 0.05; **P < 0.01; NS, Not Significant (two-tailed unpaired Student’s t-test).

References

    1. LeBleu VS, et al. Origin and function of myofibroblasts in kidney fibrosis. Nat Med. 2013;19:1047–1053. doi: 10.1038/nm.3218. - DOI - PMC - PubMed
    1. Mack M, Yanagita M. Origin of myofibroblasts and cellular events triggering fibrosis. Kidney Int. 2015;87:297–307. doi: 10.1038/ki.2014.287. - DOI - PubMed
    1. Buchtler S, et al. Cellular Origin and Functional Relevance of Collagen I Production in the Kidney. J Am Soc Nephrol. 2018;29:1859–1873. doi: 10.1681/ASN.2018020138. - DOI - PMC - PubMed
    1. Kriz W, Kaissling B, Le Hir M. Epithelial-mesenchymal transition (EMT) in kidney fibrosis: fact or fantasy? J Clin Invest. 2011;121:468–474. doi: 10.1172/JCI44595. - DOI - PMC - PubMed
    1. Kawakami T, Ren S, Duffield JS. Wnt signalling in kidney diseases: dual roles in renal injury and repair. J Pathol. 2013;229:221–231. doi: 10.1002/path.4121. - DOI - PubMed

Publication types

Substances