. 2019 Sep;51(9):1380-1388.
doi: 10.1038/s41588-019-0479-7. Epub 2019 Aug 19.

Transcriptionally active HERV-H retrotransposons demarcate topologically associating domains in human pluripotent stem cells

Affiliations

Transcriptionally active HERV-H retrotransposons demarcate topologically associating domains in human pluripotent stem cells

Yanxiao Zhang et al. Nat Genet. 2019 Sep.

Abstract

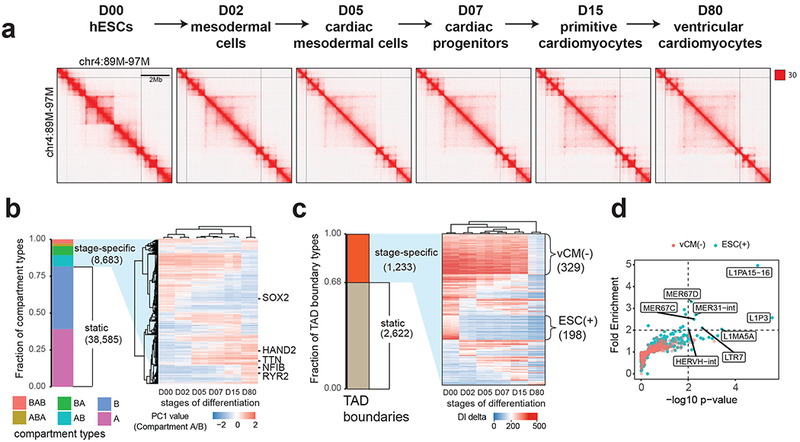
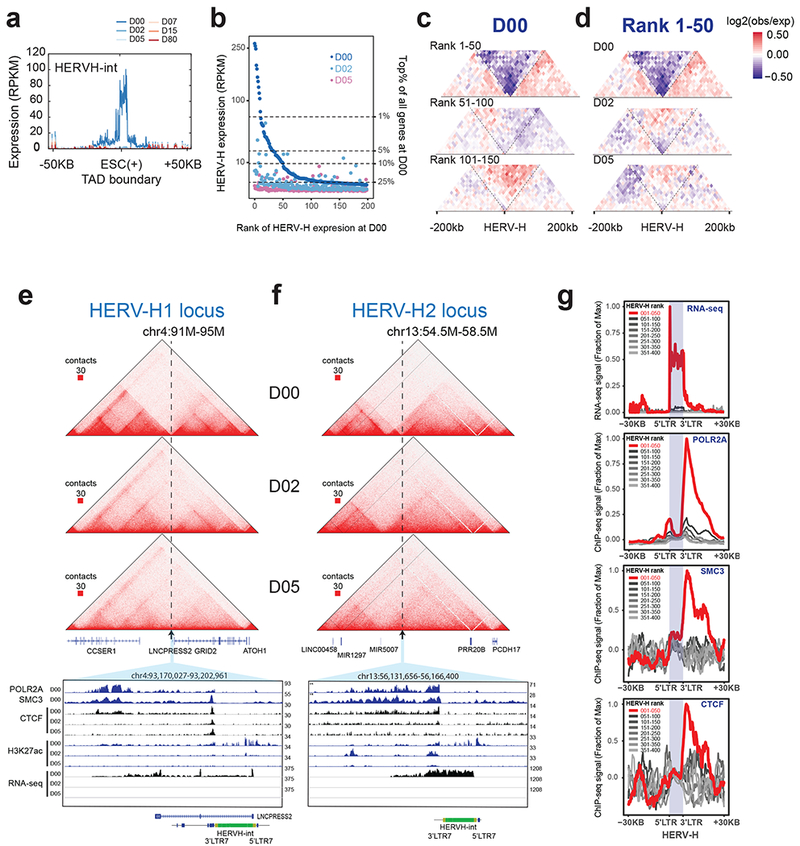
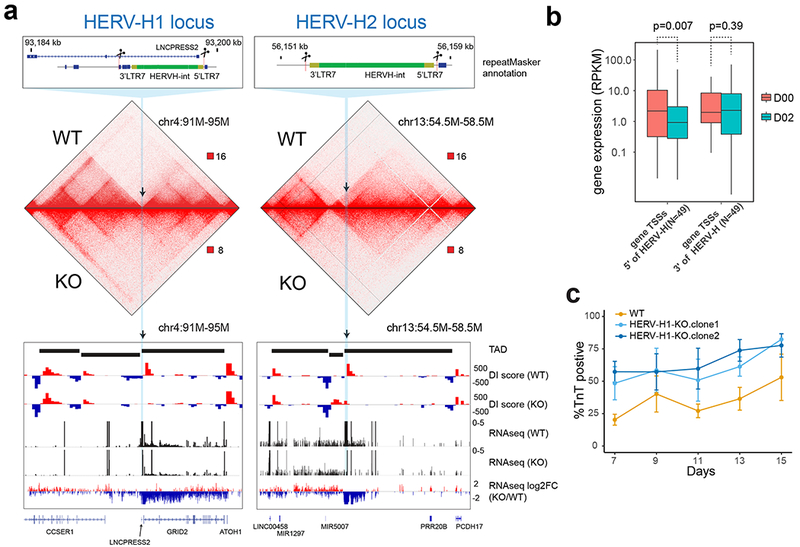
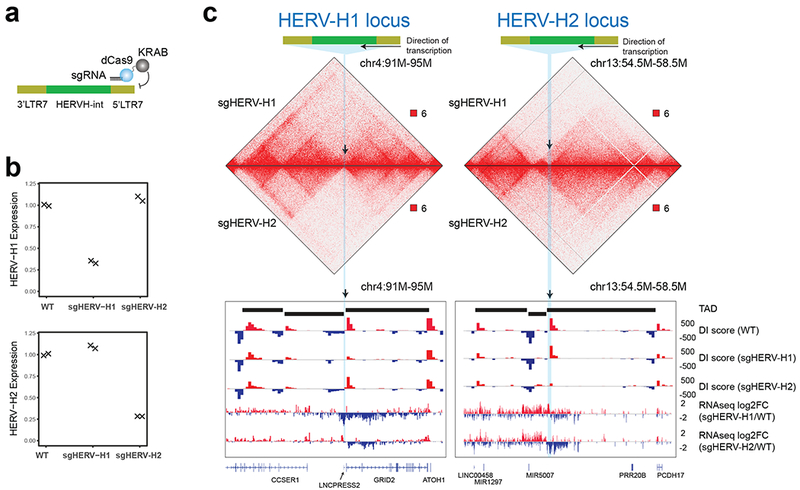
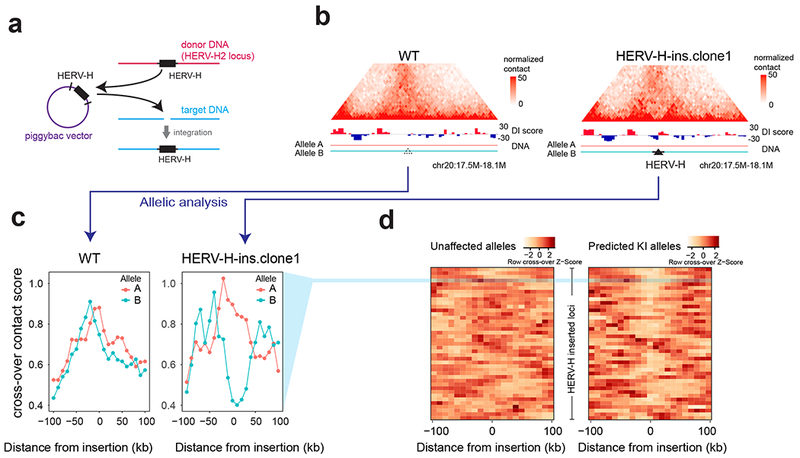
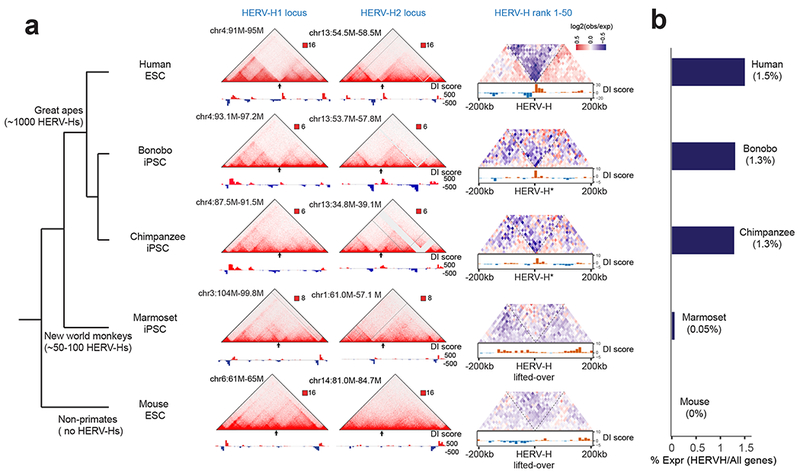
Chromatin architecture has been implicated in cell type-specific gene regulatory programs, yet how chromatin remodels during development remains to be fully elucidated. Here, by interrogating chromatin reorganization during human pluripotent stem cell (hPSC) differentiation, we discover a role for the primate-specific endogenous retrotransposon human endogenous retrovirus subfamily H (HERV-H) in creating topologically associating domains (TADs) in hPSCs. Deleting these HERV-H elements eliminates their corresponding TAD boundaries and reduces the transcription of upstream genes, while de novo insertion of HERV-H elements can introduce new TAD boundaries. The ability of HERV-H to create TAD boundaries depends on high transcription, as transcriptional repression of HERV-H elements prevents the formation of boundaries. This ability is not limited to hPSCs, as these actively transcribed HERV-H elements and their corresponding TAD boundaries also appear in pluripotent stem cells from other hominids but not in more distantly related species lacking HERV-H elements. Overall, our results provide direct evidence for retrotransposons in actively shaping cell type- and species-specific chromatin architecture.


Conflict of interest statement

Competing Interests Statement:

B.R. is a co-founder of Arima Genomics, Inc.

Figures

Figure 1.
Figure 1.. Reorganization of TADs during human cardiomyocyte differentiation.
(a) Hi-C contact matrices for each stage of cardiomyocyte differentiation at mega-base resolution. (b) A heatmap showing hierarchical clustering of dynamic chromatin compartments during cardiomyocyte differentiation. The pseudo-color reflects the PC1 values (compartment A/B) of compartment bins. Negative PC1 value stands for compartment B and positive for compartment A. Representative genes located in corresponding compartment bins are annotated to the right of the heatmap. (c) A heatmap showing the DI delta scores for the stage-specific TAD boundaries, ordered by the presence of TADs at six stages. vCM(−) stands for TAD boundaries lost in purified ventricular cardiomyocytes at D80, ESC(+) stands for hESC-specific TAD boundaries. (d) Scatter plot shows the fold enrichment and −log10(P values) for various repeat element classes at ESC(+) (N = 198) and vCM(−) (N = 329) TAD boundaries relative to the static TAD boundaries (N = 2,622). P values are from two-sided proportion test.
Figure 2.
Figure 2.. Transcriptionally active HERV-H forms human ESC-specific TAD boundaries.
(a) Aggregated RNA-seq expression profile (RPKM normalized) at ESC(+) TAD boundaries that overlap HERV-H element. (b) Scatterplot shows the expression levels (RPKM) across different HERV-H loci (ordered by expression levels from high to low in ESC) at D0, D2 and D5 stages of differentiation. (c) Heatmap of aggregated Hi-C contact matrix [log2(observed/expected)] within 200 kb of the top 50, 51-100 and 101-150 ranked HERV-Hs, at D0. (d) Heatmap of the aggregated Hi-C matrix [log2(observed/expected)] within 200 kb of the top 50 HERV-Hs, at D0, D2 and D5. (e,f) Representative Hi-C interaction matrices of two HERV-H loci located at ESC(+) TAD boundaries at D0, D2 and D5 (top) are shown as heatmaps along with genome browser tracks of POLR2A, SMC3, CTCF, H3K27ac ChIP-seq and RNA-seq data of the expanded genomic region containing the TAD boundary (arrow). (g) Aggregated genomic profiles of RNA-seq, POLR2A, SMC3 and CTCF ChIP-seq around top 50 HERV-Hs located on the ESC(+) TAD boundaries (red) and lower ranked HERV-Hs (grey).
Figure 3.
Figure 3.. Deletion of two HERV-H sequences leads to merging of TADs in hESCs.
(a) Hi-C interaction matrices of the wild-type (WT) and transgenic hESC lines (HERV-H1-KO and HERV-H2-KO) are shown, along with DI scores, expression levels (RPKM) and fold changes of gene expression at the HERV-H1 and HERV-H2 loci. The loss of TAD boundary in the transgenic cells is accompanied with decrease of RNA expression of genes 5’ terminus to the HERV-H sequences. (b) Boxplots show expression levels (RPKMs) of genes whose TSSs are located from −500 kb to the 5’ LTR (N = 49) and from 3’ LTR to +500 kb (N = 49) of boundary-associated HERV-Hs. P values are from two-sided paired t test on the log-transformed expression levels. The elements of the boxplot are: center line, median; box limit, upper and lower quartiles; whiskers, 1.5× interquartile range. (c) Line chart (mean ± standard error, N = 3 cardiomyocyte differentiations) shows percentage of TNNT2 positive cells during cardiomyocyte differentiation of WT and HERV-H1-KO hESC lines (two HERV-H1-KO clones analyzed). HERV-H1-KO hESCs display increased cardiomyocyte differentiation efficiency compared to WT hESCs.
Figure 4.
Figure 4.. Silencing of HERV-H sequences weakened the TAD boundaries in hESC.
(a) Design of the CRISPR-dCas9-KRAB system to silence HERV-H expression using sgRNAs targeting 5’ LTR7. (b) Gene expression values of HERV-H1 and HERV-H2 in WT and CRISPRi-targeted hESCs. (c) Hi-C interaction matrices of the CRISPRi targeted hESC lines (sgHERV-H1 and sgHERV-H2) are shown, along with DI scores, and log2(fold-change) of gene expression in engineered cell lines over control at the HERV-H1 and HERV-H2 loci.
Figure 5.
Figure 5.. HERV-H insertion creates de novo TAD boundaries.
(a) Design of the piggybac vector to “transpose” HERV-H to random genomic locations in the hESC (HERV-H2-KO line). (b) Hi-C contact matrices of the parental cell line (HERV-H2-KO) and the cell line with HERV-H insertions (HERV-H-ins.clone1) are shown, along with DI scores at the locus of one HERV-H insertion. (c) Line plots showing the cross-over contact scores of both alleles in parental cell line (HERV-H2-KO) and HERV-H-ins.clone1 at the same locus as in (b). Only the allele (B) harboring HERV-H insertion shows a decrease of cross-over contact score (increase of insulation). (d) Heatmap shows the z-transformed cross-over contact scores for all predicted knock-in (KI) alleles and unaffected alleles in the HERV-H inserted cells.
Figure 6.
Figure 6.. HERV-H introduces new TAD boundaries during primate evolution.
(a) A simplified tree of primate evolution with the copies of HERV-H annotated (left) and Hi-C interaction matrices of human ESCs, bonobo iPSCs, chimpanzee iPSCs, marmoset iPSCs and mouse ESCs are shown, along with DI scores at the syntenic regions to human HERV-H1 locus, HERV-H2 locus, and all top 50 transcribing HERV-Hs. The chimpanzee and bonobo syntenic regions are denoted with a star as they also contain HERV-H sequence. (b) Bar chart shows the percentage of HERV-H transcripts over all transcripts in the PSCs from each indicated species.

References

    1. Dekker J & Mirny L The 3D Genome as Moderator of Chromosomal Communication. Cell 164, 1110–1121, doi:10.1016/j.cell.2016.02.007 (2016). - DOI - PMC - PubMed
    1. Yu M & Ren B The Three-Dimensional Organization of Mammalian Genomes. Annu Rev Cell Dev Biol 33, 265–289, doi:10.1146/annurev-cellbio-100616-060531 (2017). - DOI - PMC - PubMed
    1. Meaburn KJ & Misteli T Cell biology: chromosome territories. Nature 445, 379–781, doi:10.1038/445379a (2007). - DOI - PubMed
    1. Lieberman-Aiden E et al. Comprehensive mapping of long-range interactions reveals folding principles of the human genome. Science 326, 289–293, doi:10.1126/science.1181369 (2009). - DOI - PMC - PubMed
    1. Dixon JR et al. Topological domains in mammalian genomes identified by analysis of chromatin interactions. Nature 485, 376–380, doi:10.1038/nature11082 (2012). - DOI - PMC - PubMed

Methods-only references

    1. Lian X et al. Directed cardiomyocyte differentiation from human pluripotent stem cells by modulating Wnt/beta-catenin signaling under fully defined conditions. Nature protocols 8, 162–175, doi:10.1038/nprot.2012.150 (2013). - DOI - PMC - PubMed
    1. Hashem SI et al. Brief Report: Oxidative Stress Mediates Cardiomyocyte Apoptosis in a Human Model of Danon Disease and Heart Failure. Stem cells 33, 2343–2350, doi:10.1002/stem.2015 (2015). - DOI - PMC - PubMed
    1. Shen Y et al. A map of the cis-regulatory sequences in the mouse genome. Nature 488, 116–120, doi:10.1038/nature11243 (2012). - DOI - PMC - PubMed
    1. Gorkin D et al. Systematic mapping of chromatin state landscapes during mouse development. bioRxiv (2017).
    1. Jolma A et al. DNA-binding specificities of human transcription factors. Cell 152, 327–339, doi:10.1016/j.cell.2012.12.009 (2013). - DOI - PubMed

Publication types