. 2019 Jul 13;8(9):e1638211.
doi: 10.1080/2162402X.2019.1638211. eCollection 2019.

Phenotypic and functional analysis of malignant mesothelioma tumor-infiltrating lymphocytes

Affiliations

Phenotypic and functional analysis of malignant mesothelioma tumor-infiltrating lymphocytes

Astero Klampatsa et al. Oncoimmunology. .

Abstract

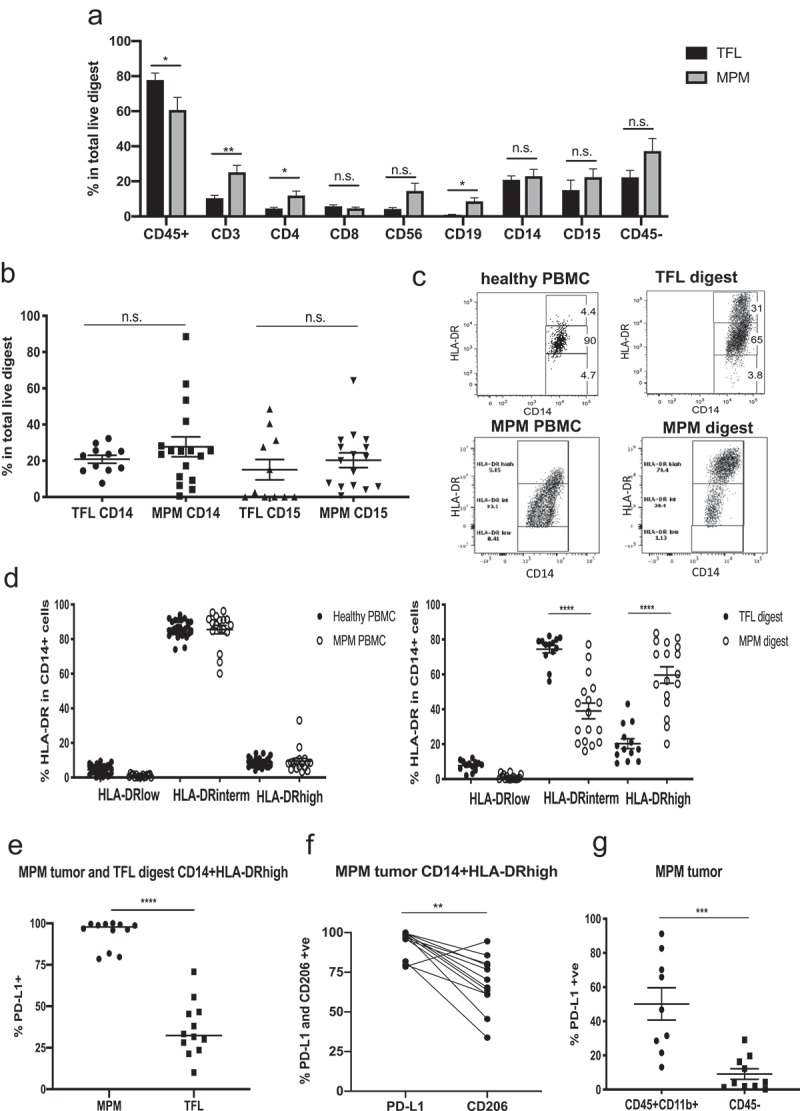
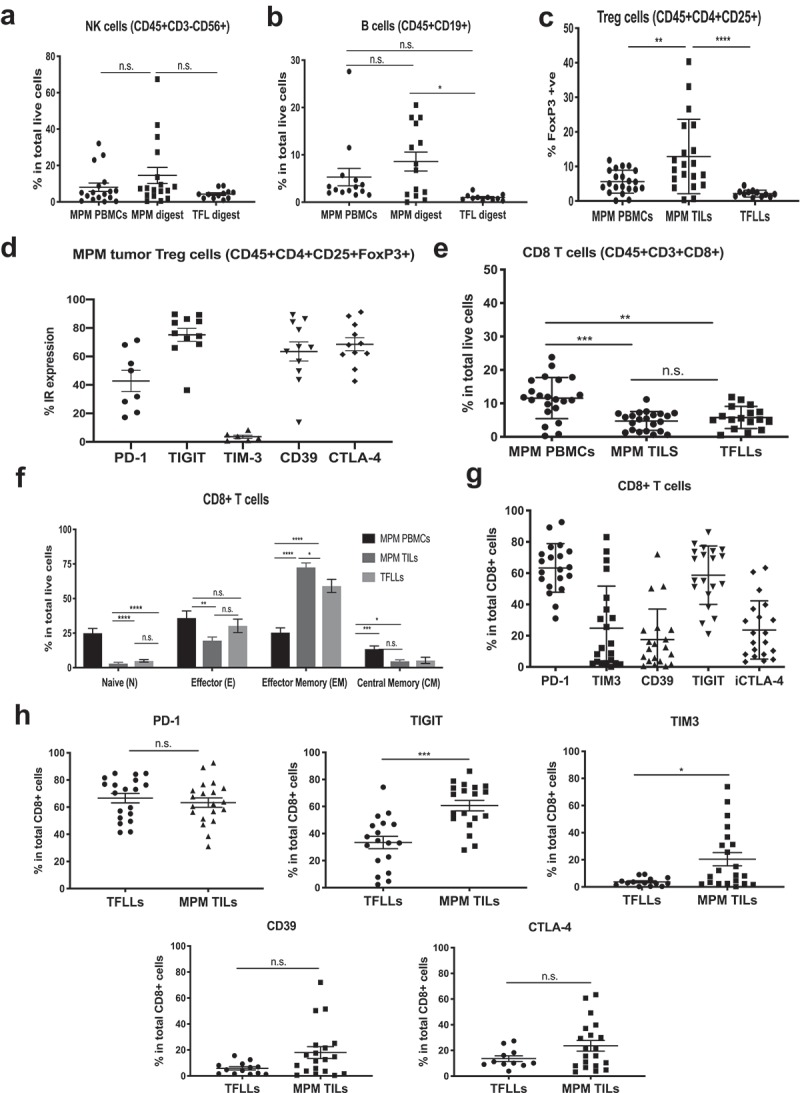
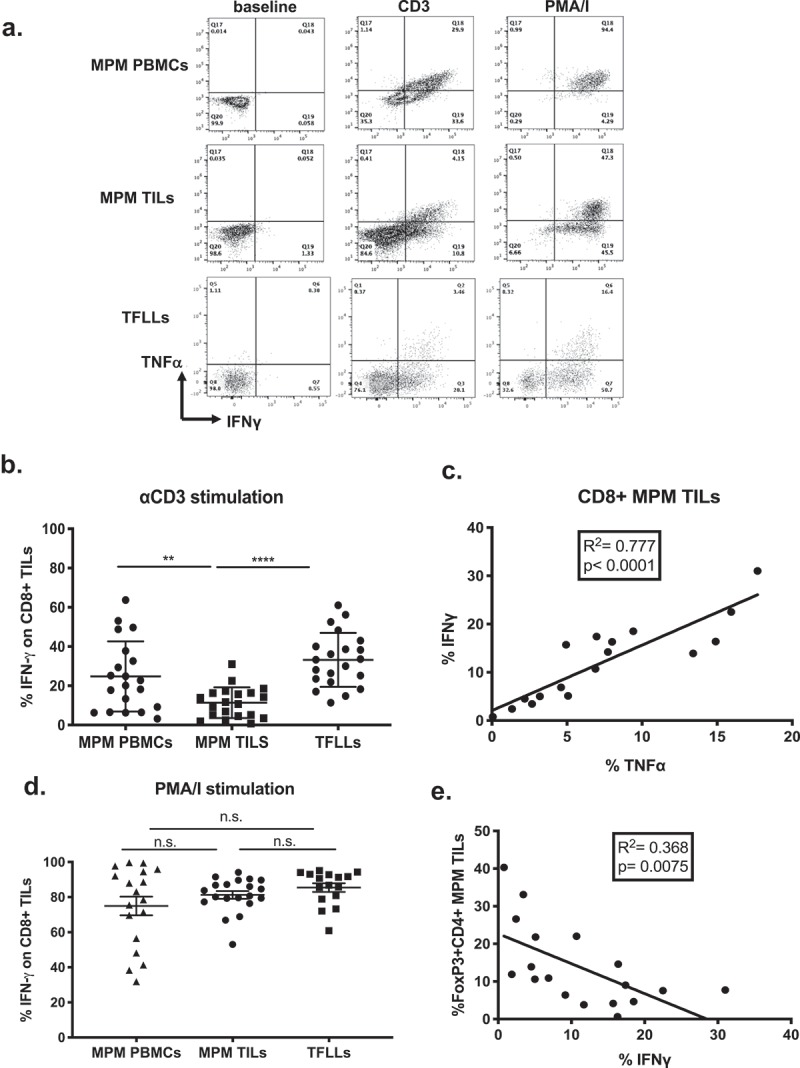
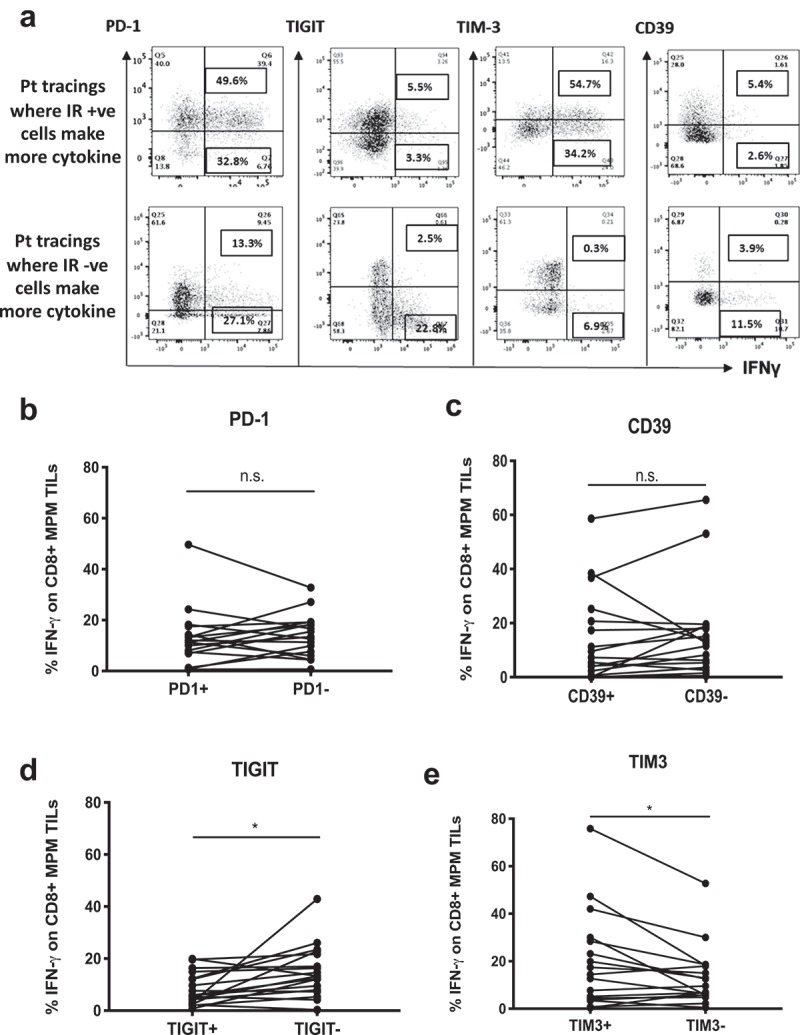
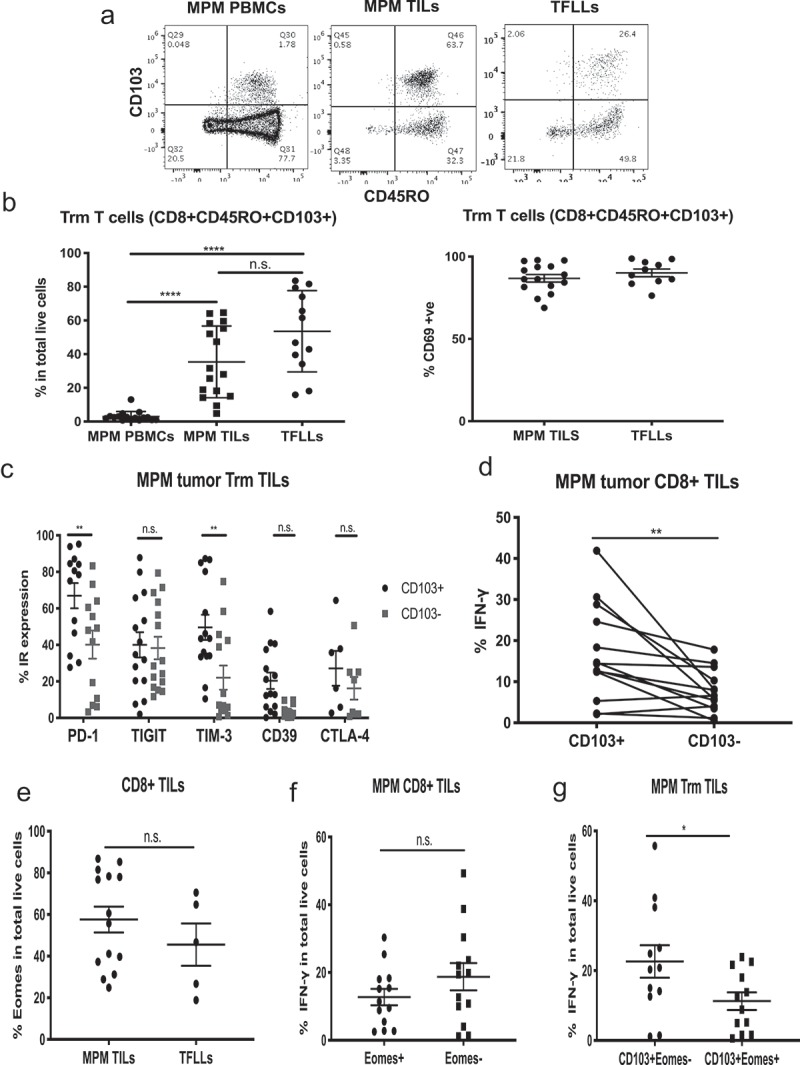
Given the growing interest and promising preliminary results of immunotherapy in malignant pleural mesothelioma (MPM), it has become important to more fully understand the immune landscape in this tumor. This may be especially relevant in deciding who might benefit most from checkpoint blockade or agonist antibody therapy. Since the phenotype of tumor infiltrating lymphocytes (TILs) in MPM has not been fully described and their function has not been carefully assessed, we collected fresh tumor and blood from 22 patients undergoing surgical resection and analysed single cell suspensions by flow cytometry. The functionality of TILs was assessed by measurement of cytokine expression (IFN-γ) following overnight stimulation ex vivo. Results showed low numbers of CD8+ TILs whose function was either moderately or severely suppressed. The degree of TIL hypofunction did not correlate with the presence of co-existing macrophages or neutrophils, nor with expression of the inhibitory receptors PD-1, CD39 and CTLA-4. Hypofunction was associated with higher numbers of CD4 regulatory T cells (Tregs) and with expression of the inhibitory receptor TIGIT. On the other hand, presence of tissue-resident memory (Trm) cells and expression of TIM-3 on CD8+ cells were positively associated with cytokine production. However, Trm function was partially suppressed when the transcription factor Eomesodermin (Eomes) was co-expressed. Understanding the function of TILs in malignant mesothelioma may have clinical implications for immunotherapy, especially in choosing the best immunotherapy targets. Our data suggests that Treg cell blocking agents or TIGIT inhibitor antibodies might be especially valuable in these patients.

Keywords: CD8+ TILs; Eomes; Mesothelioma; hypofunction; inhibitory receptors; tissue resident memory cells.


Figures

Figure 1.
Figure 1.
Immune cell frequencies in tumor-free lung (TFL) and malignant pleural mesothelioma (MPM) digests. Flow cytometry was used to characterize cells in the PBMCs of MPM patients or the digests of MPM tumors or tumor-free lungs (TFL). (a) Frequency of main immune cell subsets in total live TFLs versus MPM tumor digests demonstrating significantly less CD45+ immune cell infiltration in the tumors, but more T (CD3+, CD4+, CD56+) and B (CD19+) cell subsets. Statistics by multiple t tests (*p < .05, **p < .01). (b) Frequency of CD14+ and CD15+ cells in TFL and MPM digests. There were no significant differences. (c) Representative flow tracings showing the distribution of HLA-DR levels between healthy PBMC, TLF digest, MPM PBMCs and MPM digest on CD14-gated cells. CD14 cells with intermediate levels of HLA-DR are classified as monocytes, while those with high levels of HLA-DR are classified as macrophages. (d) Frequency of HLA-DR expression in CD14-gated cells in healthy and MPM PBMCs (left graph) showing no differences, and between TFL and MPM digests (right graph) showing HLA-DRhi cells are more frequent in the MPM digests. Statistics by Mann-Whitney t-test (****p < .0001). (e) The level of PDL-1 expression on the CD14+ HLA-DRhigh cells is plotted for MPM and TFL digests. Expression of PDL1 is significantly higher on the MPM CD14+ cells. Statistics by Mann-Whitney t-test (****p < .0001). (f) The expression of PDL1 and CD206 in CD45+ CD11b+CD14+ HLA-DRhigh for each patient is plotted. Whereas PDL1 expression is uniformly high, CD206 expression is variable and significantly lower than PDL1 expression. Statistics by Mann-Whitney t-test (**p < .01). (g) PD-L1 expression in all myeloid cells (CD45+ CD11b+ gated cells) versus the CD45 -ve gated cells in MPM digests. Expression on the myeloid cells is significantly higher. Statistics by Mann-Whitney t-test (***p < .001).
Figure 2.
Figure 2.
Frequencies and phenotype of lymphocytes in the MPM microenvironment. Flow cytometry was used to characterize cells in the PBMCs of MPM patients or the digests of MPM tumors or tumor-free lungs (TFL). All Statistics by Mann-Whitney test (*p < .05, **p < .01, ***p < .001, ****p < .0001; ns = not significant). (a) Frequency of NK cells was determined in PBMC and total live digests. There were no significant differences. (b) Frequency of B cells was determined in PBMC and total live digests. The percentage of B cells in MPM tumor digest was significantly higher in MPM vs TFL digests. (c) Frequency of FOXP3+ in total CD4+ cells (Tregs) in MPM PBMCs, MPM and TFL digests. MPM digests had significantly increased percentages of Tregs compared to PBMC or TFL digests. (d) Individual inhibitory receptor expression on Tregs from MPM digests was determined. High levels of TIGIT, CD39, and CTLA-4, moderate levels of PD-1 and low levels of TIM3 were observed. (e) Frequency of CD8+ T cells was determined in PBMC and total live digests. Whereas PBMC levels were significantly higher than seen in tissue digests, there were no significant differences noted between MPM and TFL digests. (f) The frequency of CD8+ T cell Naïve, Effector, Central Memory, and Effector Memory frequencies in MPM PBMCs, MPM TILS and TFLLs were determined. Naïve cells were higher in PBMC, while tumor digests had more effector and central memory cells. (g) Expression of IRs (PD-1, TIM-3, CD39, TIGIT and CTLA-4) on CD8+ MPM TILs. High levels of PD-1 and TIGIT, with moderate levels of CD39, TIM3, and CTLA-4, were observed. (h) Inhibitory receptor expression on CD8+ TILs from TFL and MPM digests was determined. There were no significant differences in expression of PD-1, CD39, or CTLA4. The levels of TIGIT and TIM3 were significantly greater on MPM TILs vs TFLLs.
Figure 3.
Figure 3.
Function of CD8+ T cells is suppressed in MPM TILs. T cells were stimulated with plate-bound anti-CD3 antibody or PMA/Ionomycin overnight and the levels of intracellular IFN-γ or TNF-α expression were measured using flow cytometry. (a) Representative flow tracings of CD8+ T cells of MPM PBMCs, MPM TILs and TFLLs showing cytokine (IFN-γ on x-axis and TNF-α on y-axis) production at baseline, or following overnight stimulation with anti-CD3 or PMA/I. MPM PBMCs and MPM TILs are from the same patient. (b) Percent of CD8 + T cells of MPM PBMCs, MPM TILs and TFLLs producing IFN-γ following overnight stimulation with plate-bound anti-CD3 antibody. MPM TILs made significantly less IFN-γ. Statistics by one-way ANOVA (**p < .01). (c) Intracellular IFN-γ and TNFα production in each patient’s MPM TILs was highly and significantly correlated (R2 = 0.777; p < .0001). (d) The percent of CD8+ T cells producing IFN-γ in MPM TILs and TFLLs following overnight stimulation with PMA/I was high in all groups with no statistically significant differences. Statistics by one-way ANOVA. (e) The percent of Tregs (CD4+ FOXP3+) of total CD4+ cells was significantly negatively correlated with IFN-γ production by CD8+ MPM TILs (R2 = 0.368; p = .0075).
Figure 4.
Figure 4.
Function of CD8+ T cells in relation to IR expression. TILs from individual patients were stimulated with anti-CD3 antibody overnight and flow cytometry performed with surface and intracellular staining to determine the IR expression levels on the cells making IFN-γ. (a) Representative flow tracings where the IFN-γ expression is plotted on the X axis vs the level of IR expression (PD1, TIGIT, TIM-3 or CD39) on the Y axes. The top row panels show examples where T cells of a given patient with high levels of IRs made more IFN-γ than the T cells of the same patient which lacked IR expression. The bottom row panels show examples where T cells lacking or downregulating IRs produced more cytokine than the T cells of the same patient that expressed IRs. (b) The % of cells making IFN-γ in PD-1+ vs. PD-1- CD8 MPM TILs for each individual patient were compared. No significant differences were observed (Mann-Whitney test, p = ns). (c) The percent of cells making IFN-γ in CD39+ vs. CD39- CD8 MPM TILs for each individual patient were compared. No significant differences were observed (Mann-Whitney test, p = ns). (d) The percent of cells making IFN-γ in TIGIT+ vs. TIGIT- CD8 MPM TILs for each individual patient were compared. A significant difference was observed with TIGIT+ cells making less IFN-γ (Mann-Whitney test, *p = .014). (e) The percent of cells making IFN-γ in TIM-3+ vs. TIM-3- CD8 MPM TILs for each individual patient (n = x) are compared. A significant difference was observed with TIM+ cells making more IFN-γ (Mann-Whitney test, *p = .023).
Figure 5.
Figure 5.
Phenotype and function of tissue-resident memory (Trm) cells in MPM. Trms were defined as CD8+ CD45RO+CD103+ cells. (a) Representative flow tracings of tissue resident memory cells (Trms) of MPM PBMCs, MPM TILs and TFLLs. (b) Left graph: Frequency of Trms in MPM TILs and TFLLs are significantly higher than in PBMCs. Statistics by Mann-Whitney test (****p < .0001). Right graph: TFLL Trms and MPM TIL Trms are characterized by high expression of CD69. (c) IR expression in Trms. Levels of PD1 and TIM3 are statistically higher in the CD103+ vs. CD103- MPM TILs. Statistics by multiple t tests (**p < .01). (d) IFN-γ production was statistically significantly higher in CD103+ vs. CD103- cells in each individual MPM patient (paired parametric t test, **p = .0085). (e) Expression of Eomes in CD8+ MPM TILs and TFLLs shows no significant differences. (Mann-Whitney test, p = n.s.). (f) The IFN-γ production in Eomes+ vs. Eomes- CD8+ MPM TILs was not significantly different. (Mann-Whitney test, p = n.s.). (g) IFN-γ production in CD103+ vs. CD103- cell in relation to Eomes expression was significantly different (Mann-Whitney test, *p = .04).

References

    1. Odgerel C-O, Takahashi K, Sorahan T, Driscoll T, Fitzmaurice C, Yoko-O M, Sawanyawisuth K, Furuya S, Tanaka F, Horie S, et al. Estimation of the global burden of mesothelioma deaths from incomplete national mortality data. Occup Environ Med. 2017;74(12):851–858. doi:10.1136/oemed-2017-104298. - DOI - PMC - PubMed
    1. Stayner L, Welch LS, Lemen R.. The worldwide pandemic of asbestos-related diseases. Annu Rev Public Health. 2013;34:205–216. doi:10.1146/annurev-publhealth-031811-124704. - DOI - PubMed
    1. Nelson DB, Rice DC, Niu J, Atay SM, Vaporciyan AA, Antonoff MB, Hofstetter WL, Walsh GL, Swisher SG, Roth JA, et al. Predictors of trimodality therapy and trends in therapy for malignant pleural mesothelioma. Eur J Cardiothorac Surg. 2018;53(5):960–966. doi:10.1093/ejcts/ezx427. - DOI - PubMed
    1. Vogelzang NJ, Rusthoven JJ, Symanowski J, Denham C, Kaukel E, Ruffie P, Gatzemeier U, Boyer M, Emri S, Manegold C, et al. Phase III study of pemetrexed in combination with cisplatin versus cisplatin alone in patients with malignant pleural mesothelioma. J Clin Oncol. 2003;21(14):2636–2644. doi:10.1200/JCO.2003.11.136. - DOI - PubMed
    1. Aerts J, de Goeje PL, Cornelissen R, Kaijen-Lambers MEH, Bezemer K, van der Leest CH, Mahaweni NM, Kunert A, Eskens FALM, Waasdorp C, et al. Autologous dendritic cells pulsed with allogeneic tumor cell lysate in mesothelioma: from mouse to human. Clin Cancer Res. 2018;24(4):766–776. doi:10.1158/1078-0432.CCR-17-2522. - DOI - PubMed

Publication types