. 2019 Aug 8:2:303.
doi: 10.1038/s42003-019-0550-z. eCollection 2019.

Electromagnetic fields alter the motility of metastatic breast cancer cells

Affiliations

Electromagnetic fields alter the motility of metastatic breast cancer cells

Ayush Arpit Garg et al. Commun Biol. .

Abstract

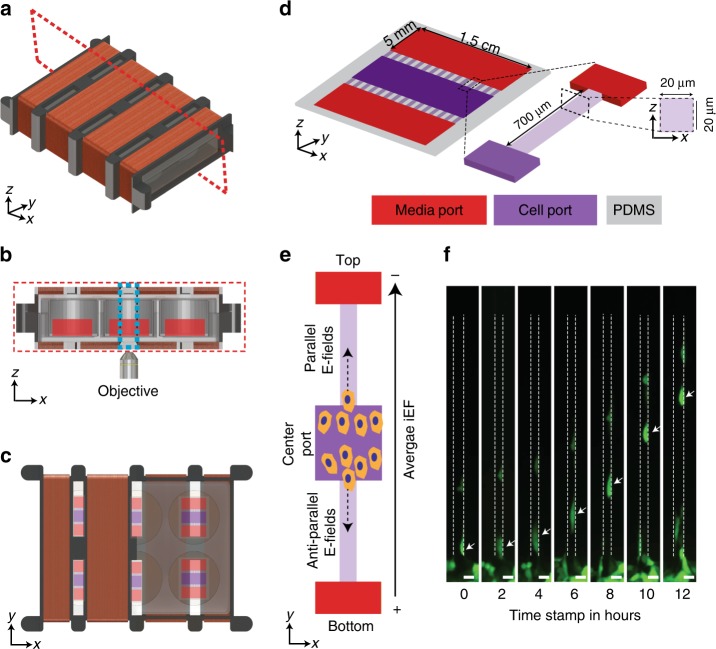
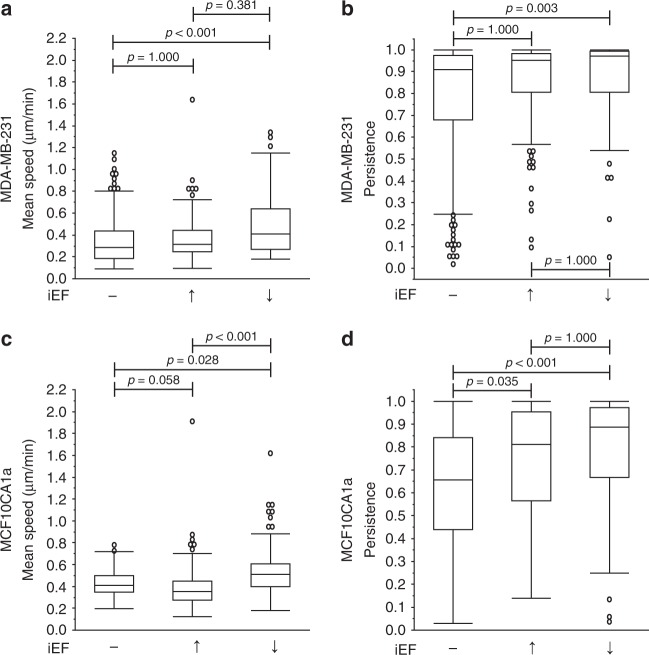
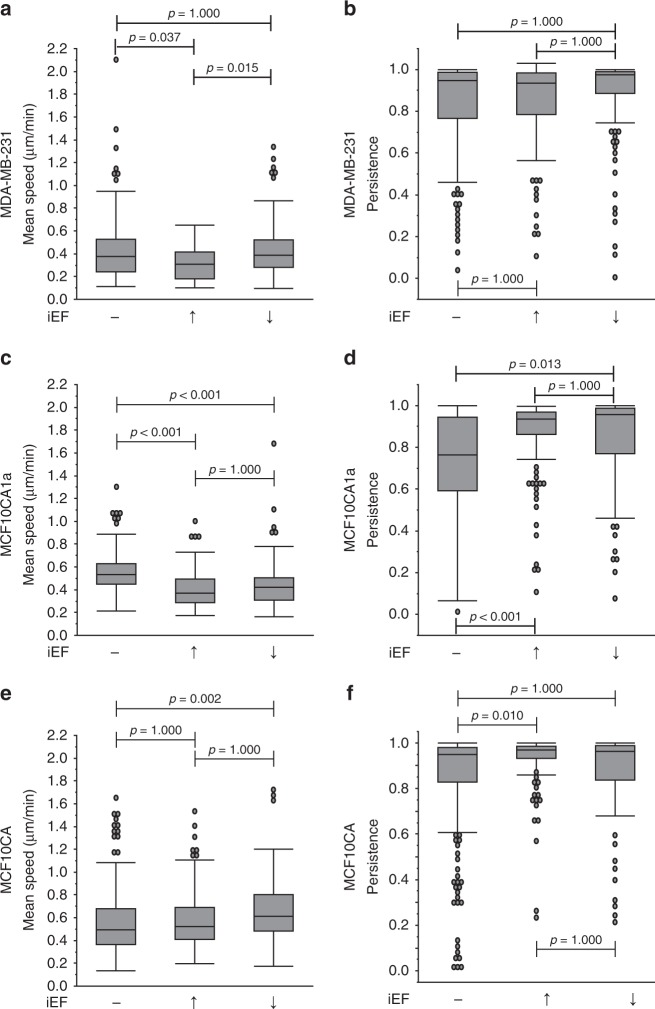
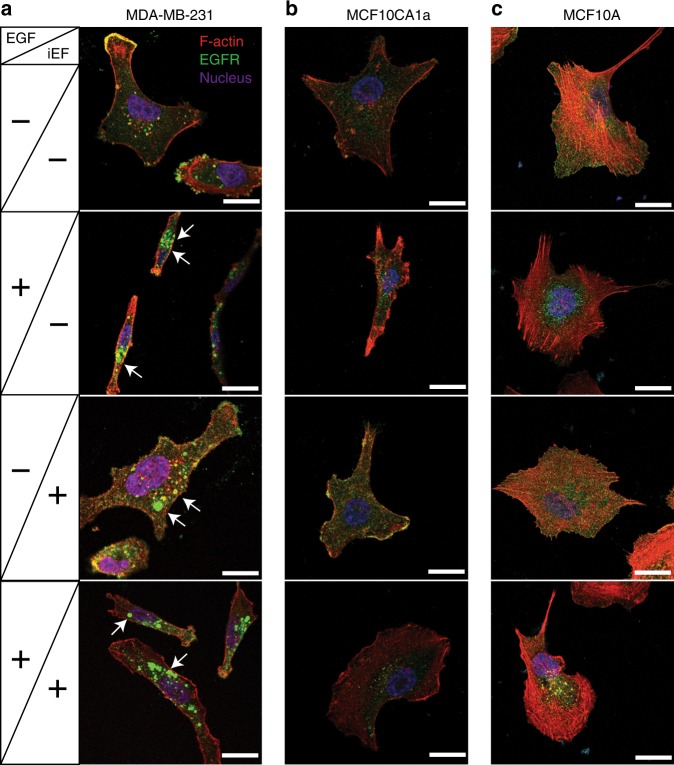
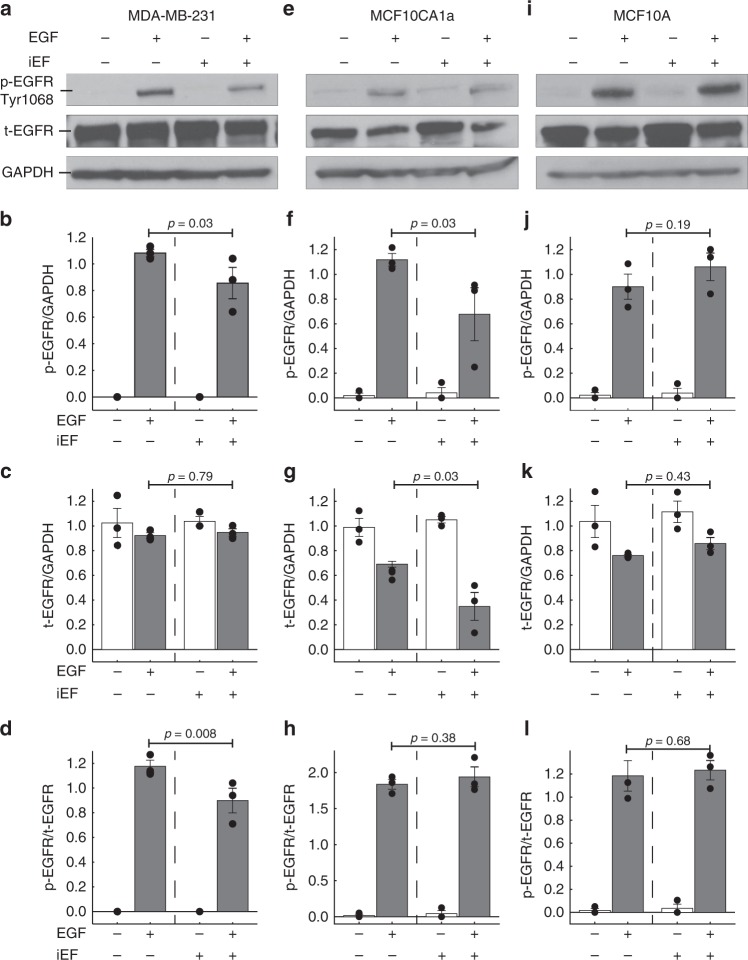
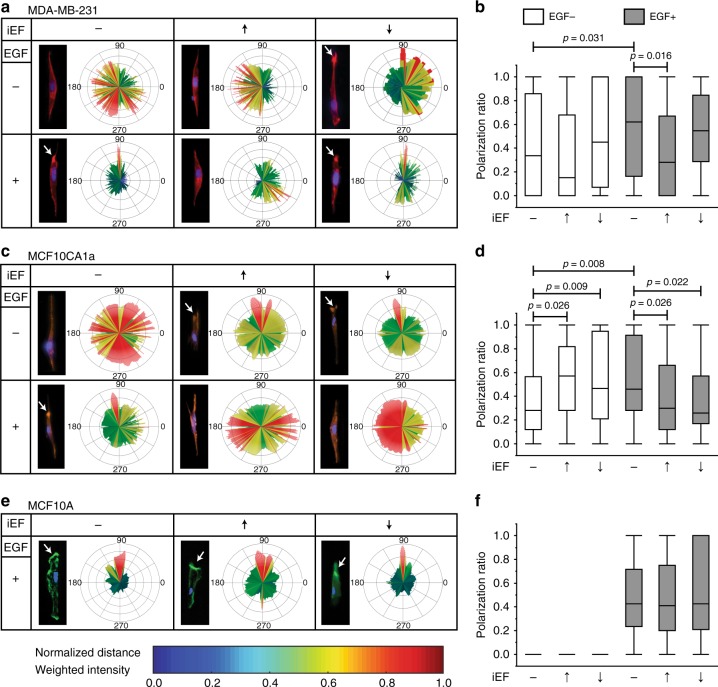
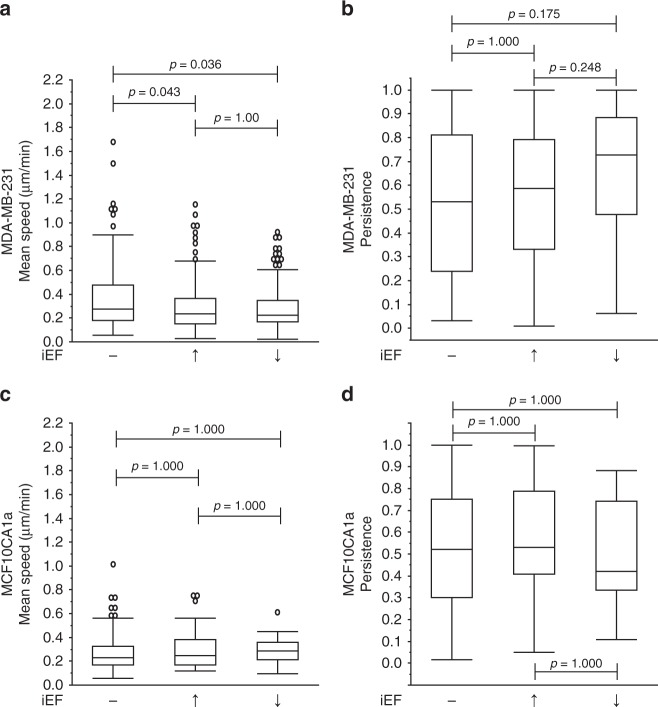
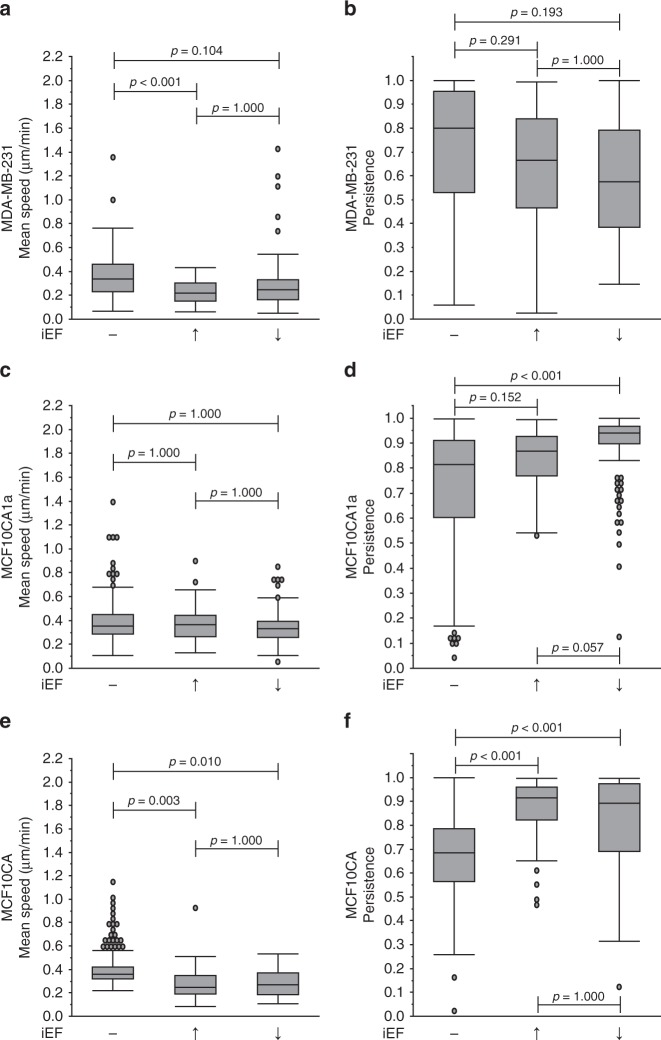
Interactions between cells and their environment influence key physiologic processes such as their propensity to migrate. However, directed migration controlled by extrinsically applied electrical signals is poorly understood. Using a novel microfluidic platform, we found that metastatic breast cancer cells sense and respond to the net direction of weak (∼100 µV cm-1), asymmetric, non-contact induced Electric Fields (iEFs). iEFs inhibited EGFR (Epidermal Growth Factor Receptor) activation, prevented formation of actin-rich filopodia, and hindered the motility of EGF-treated breast cancer cells. The directional effects of iEFs were nullified by inhibition of Akt phosphorylation. Moreover, iEFs in combination with Akt inhibitor reduced EGF-promoted motility below the level of untreated controls. These results represent a step towards isolating the coupling mechanism between cell motility and iEFs, provide valuable insights into how iEFs target multiple diverging cancer cell signaling mechanisms, and demonstrate that electrical signals are a fundamental regulator of cancer cell migration.

Keywords: Cellular motility; Chemotaxis; Metastasis.


Conflict of interest statement

Competing interestsThe authors declare no competing interests.

Figures

Fig. 1
Fig. 1
Experimental setup for quantifying cell migration in response to iEF treatment. a Isometric view of the Helmholtz coil used to apply inductive electric field (iEF) treatment on migrating cells. b Cross-section cut (plane marked with dotted red line in a indicating the location of the microfluidic bi-directional migration (MBDM) assay) and its relative position with the microscope objective. c Top view of the Helmholtz coil showing the location of devices in d and the microscope observation window. d Schematic of MBDM assay. Cells are seeded in the center port (purple) and are tracked as they migrate to the outer ports (red) through the microtracks (inset) connecting them. e Cells from the center port can migrate into the opposing microtracks and migrate either toward the top or bottom media ports and under the influence of iEFs applied either parallel or antiparallel to the direction of cell migration. f Time-lapse images of GFP-tagged MDA-MB-231 cell migrating through a single microtrack. (*Scale Bar = 20 µm)
Fig. 2
Fig. 2
Antiparallel iEF treatment increases the migration speeds of breast cancer cells migrating without exogenous EGF gradients. a MDA-MB-231: iEFs applied antiparallel to the direction of migration increased migration speeds compared with untreated controls but had no effects when applied parallel to the direction of migration. b Antiparallel iEFs increased cell persistence. c MCF10CA1a: antiparallel iEFs increased migration speeds. d iEFs bi-directionally increased cell persistence. The normal MCF10A cells do not migrate under these conditions, and iEFs have no effect on the migratory behavior of these cells under these set of conditions. All data is presented as box plots show the minimum, 1st quartile, median, 3rd quartile, and maximum. All data pooled from three independent biological replicates for each condition. (Nonparametric independent samples Kruskal–Wallis test)
Fig. 3
Fig. 3
iEF treatment decreases the motility of breast cancer cells migrating under EGF gradients. a MDA-MB-231: parallel iEFs decreased migration speeds by 21% compared with cells migrating under EGF gradients, but no inhibitory effects were observed with antiparallel iEFs. b iEFs had no effect (parallel or antiparallel) on persistence of cells migrating under EGF gradients. c MCF10CA1a: iEFs bi-directionally inhibit EGF-gradient promoted motility. d iEFs bi-directionally increase persistence of these cells migrating under EGF-gradients. e MCF10A: antiparallel iEFs increased migrating speeds of cells migrating under EGF-gradients. f Parallel iEFs increased persistence of these cells migrating under EGF-gradients. All data is presented as box plots show the minimum, 1st quartile, median, 3rd quartile, and maximum. All data pooled from three independent biological replicates for each condition. (Nonparametric independent samples Kruskal–Wallis Test)
Fig. 4
Fig. 4
iEF treatment promotes EGFR aggregation in MDA-MB-231 breast cancer cells. a MDA-MB-231: iEFs induce EGFR clustering and cause receptor aggregation independent of EGF treatment. b MCF10CA1a: iEFs have no effect of EGFR distribution, however, iEF treatment in presence of EGF results in downregulation of EGFR expression. c MCF10A: iEFs have no effect on EGFR aggregation/clustering. (Red—Actin, Blue—nucleus, and Green—EGFR, scale bar is 10 µm). The standalone split channel EGFR images shown in Supplementary Fig. 5
Fig. 5
Fig. 5
iEF treatment downregulates EGFR phosphorylation in breast cancer cells. a MDA-MB-231: western blot analysis shows that iEFs downregulate EGFR phosphorylation in EGF-treated cells. b Densitometry analysis for phosphorylated EGFR (p-EGFR) levels. c Densitometry analysis for total EGFR (t-EGFR) levels. d Ratio of p-EGFR to t-EGFR levels. e MCF10CA1a: Western blot analysis shows that iEFs downregulate EGFR phosphorylation and expression in EGF-treated cells. f Densitometry analysis for phosphorylated EGFR (p-EGFR) levels. g Densitometry analysis for total EGFR (t-EGFR) levels. h Ratio of p-EGFR to t-EGFR levels. i MCF10A: western blot analysis shows that iEFs have no effect on EGFR phosphorylation or expression. j Densitometry analysis for phosphorylated EGFR (p-EGFR) levels. k Densitometry analysis for total EGFR (t-EGFR) levels. l Ratio of p-EGFR to t-EGFR levels. All data presented as mean ± SEM. (Unpaired two-tailed Student t test, *p < 0.05, all data were pooled from three independent biological replicates for each condition)
Fig. 6
Fig. 6
iEF treatment inhibits EGF-promoted actin aggregation at the leading edge of migrating cancer cells. a MDA-MB-231: immunofluorescence images of MDA-MB-231 cells stained for F-actin with phalloidin (red) and nuclei with DAPI (blue). b Quantification of the F-actin polarization ratio. c MCF10CA1a: immunofluorescence images of MCF10CA1a cells stained for F-actin with phalloidin (red) and nuclei with DAPI (blue). d Quantification of the F-actin polarization ratio. e MCF10A: immunofluorescence images of MCF10CA1a cells stained for F-actin with phalloidin (red) and nuclei with DAPI (blue). f Quantification of the F-actin polarization ratio. All data is presented as box plots show the minimum, 1st quartile, median, 3rd quartile, and maximum. All data pooled from three independent biological replicates for each condition. (Nonparametric independent samples Kruskal–Wallis test)
Fig. 7
Fig. 7
Inhibition of Akt phosphorylation impairs the ability of breast cancer cells to sense directionality of iEFs. a MDA-MB-231: treatment with MK2206 (2.5 µM) nullified pro-migratory stimulatory effect of antiparallel iEFs. b MK2206 treatment also nullified pro-migratory stimulus of antiparallel iEFs on cell persistence. c MCF10CA1a: MK2206 treatment had a significant effect on their migration speeds and also resulted in stimulatory effects of antiparallel iEFs on spontaneous migration. d MK2206 treatment also nullified the effects of iEFs on cell persistence. The normal MCF10A cells do not migrate under these conditions and iEFs have no effect on the migratory behavior of these cells under these set of conditions. All data is presented as box plots show the minimum, 1st quartile, median, 3rd quartile, and maximum. All data pooled from three independent biological replicates for each condition. (Nonparametric independent samples Kruskal–Wallis test)
Fig. 8
Fig. 8
Co-treatment with iEFs and MK2206 inhibits EGF-gradient promoted motility. a MDA-MB-231: parallel iEFs and MK2206 work together to inhibit EGF-promoted migration speeds below levels of untreated controls. b iEFs and MK2206 work together to inhibit cell persistence significantly below levels of untreated control levels. c MCF10CA1a: co-treatment with iEFs and MK2206 significantly reduced migration speeds well below levels of untreated controls. d Co-treatment of MK2206 with iEFs increased persistence of these cancer cells. e MCF10A: co-treatment with iEFs and MK2206 inhibited EGF-promoted motility of normal breast cells. f The co-treatment resulted in increase in cell persistence compared with standalone MK2206 treatment. All data are presented as box plots show the minimum, 1st quartile, median, 3rd quartile, and maximum. All data pooled from three independent biological replicates for each condition. (Nonparametric independent samples Kruskal–Wallis test)

References

    1. Friedl P, Wolf K. Tumour-cell invasion and migration: diversity and escape mechanisms. Nat. Rev. Cancer. 2003;3:362–374. doi: 10.1038/nrc1075. - DOI - PubMed
    1. Friedl P, Alexander S. Cancer invasion and the microenvironment: plasticity and reciprocity. Cell. 2011;147:992–1009. doi: 10.1016/j.cell.2011.11.016. - DOI - PubMed
    1. Petrie RJ, Doyle AD, Yamada KM. Random versus directionally persistent cell migration. Nat. Rev. Mol. Cell Biol. 2009;10:538. doi: 10.1038/nrm2729. - DOI - PMC - PubMed
    1. Corkery B, Crown J, Clynes M, O’Donovan N. Epidermal growth factor receptor as a potential therapeutic target in triple-negative breast cancer. Ann. Oncol. 2009;20:862–867. doi: 10.1093/annonc/mdn710. - DOI - PubMed
    1. Lamouille S, Xu J, Derynck R. Molecular mechanisms of epithelial–mesenchymal transition. Nat. Rev. Mol. Cell Biol. 2014;15:178. doi: 10.1038/nrm3758. - DOI - PMC - PubMed

Publication types