. 2019 Aug 9:2:307.
doi: 10.1038/s42003-019-0532-1. eCollection 2019.

Targeting p16-induced senescence prevents cigarette smoke-induced emphysema by promoting IGF1/Akt1 signaling in mice

Affiliations

Targeting p16-induced senescence prevents cigarette smoke-induced emphysema by promoting IGF1/Akt1 signaling in mice

Christopher T Cottage et al. Commun Biol. .

Abstract

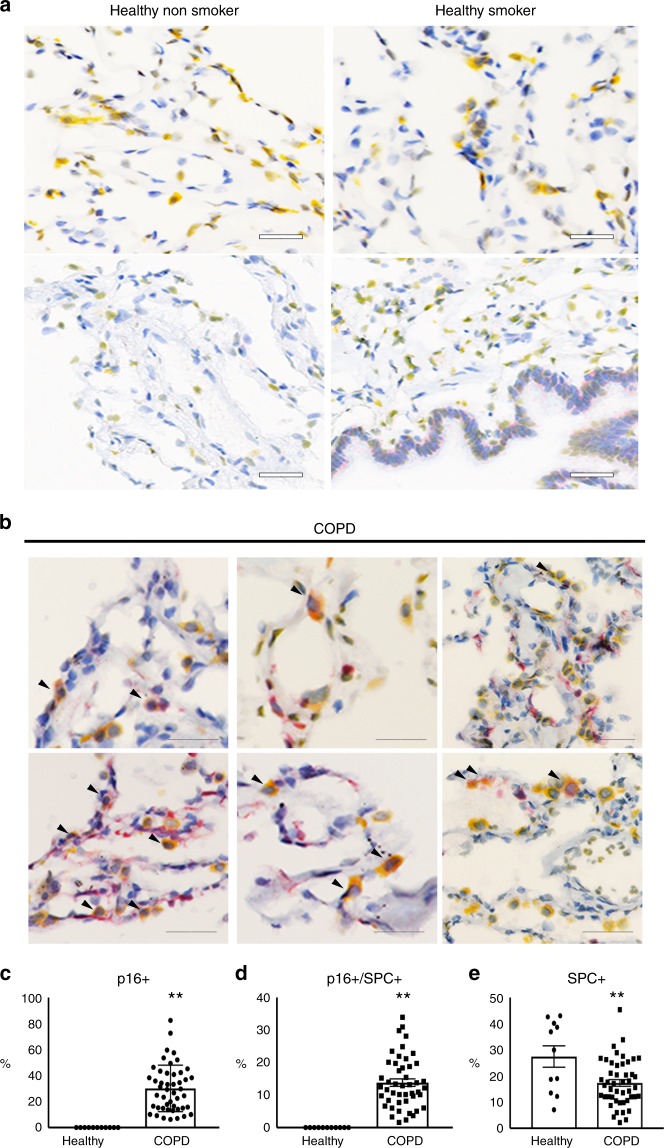
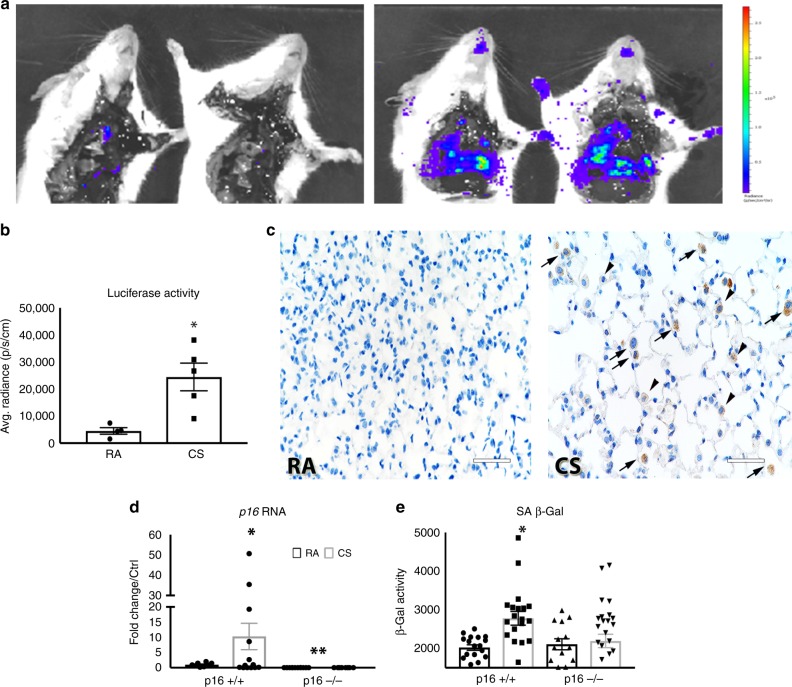
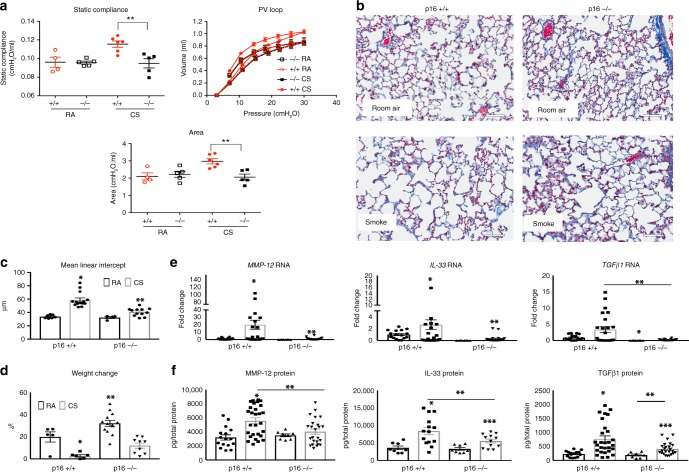
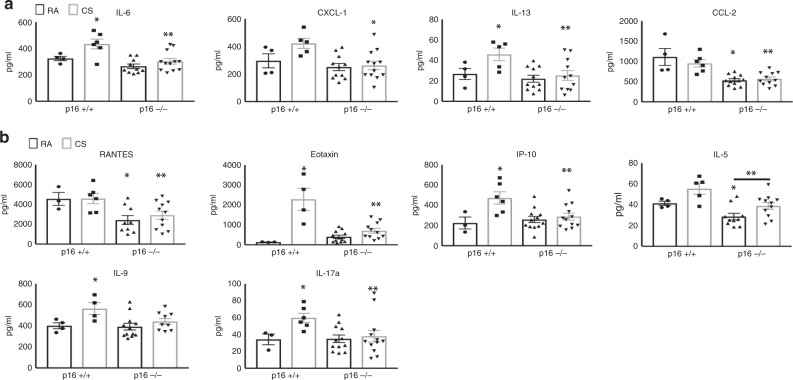
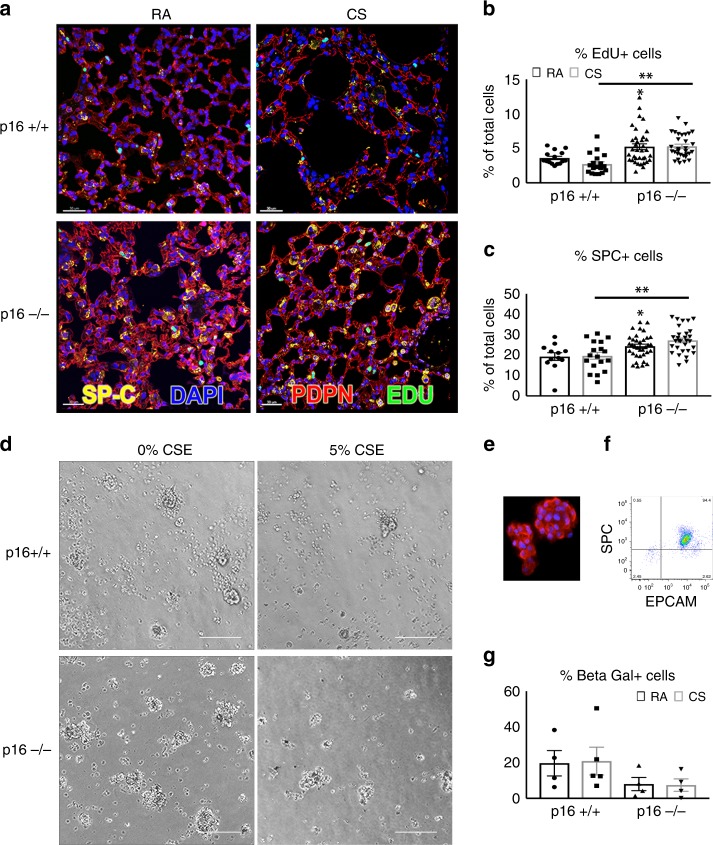
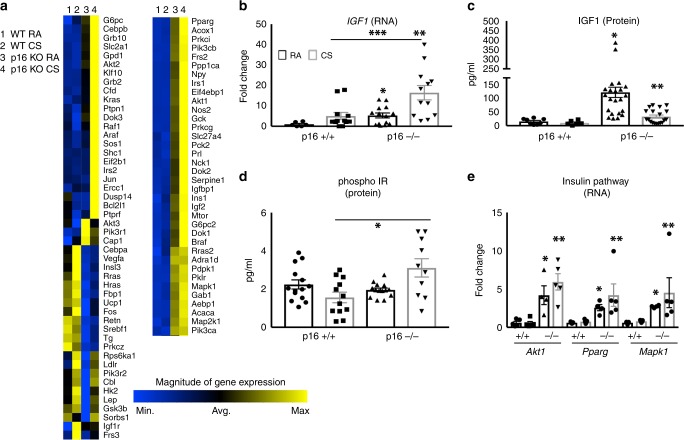
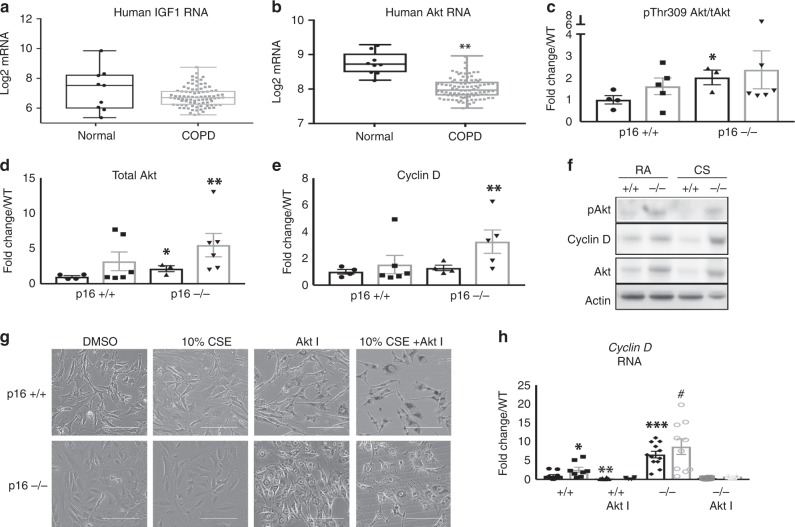
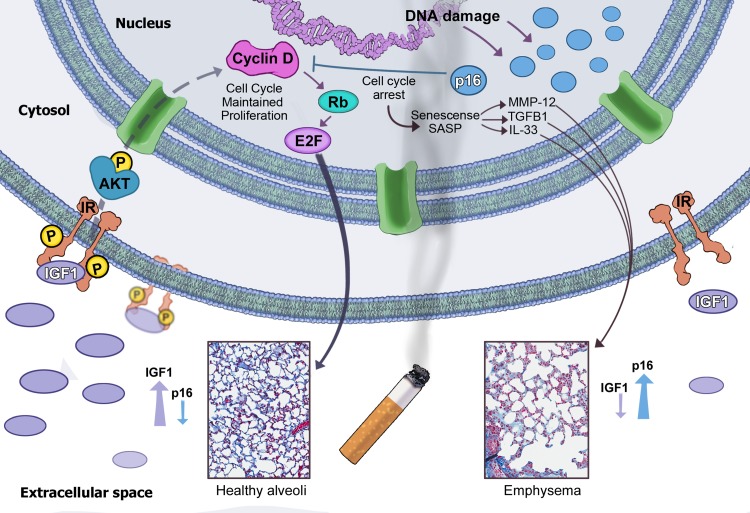
Senescence is a mechanism associated with aging that alters tissue regeneration by depleting the stem cell pool. Chronic obstructive pulmonary disease (COPD) displays hallmarks of senescence, including a diminished stem cell population. DNA damage from cigarette smoke (CS) induces senescence via the p16 pathway. This study evaluated the contribution of p16 to CS-associated lung pathologies. p16 expression was prominent in human COPD lungs compared with normal subjects. CS induces impaired pulmonary function, emphysema, and increased alveolar epithelial cell (AECII) senescence in wild-type mice, whereas CS-exposed p16-/- mice exhibit normal pulmonary function, reduced emphysema, diminished AECII senescence, and increased pro-growth IGF1 signaling, suggesting that improved lung function in p16-/- mice was due to increased alveolar progenitor cell proliferation. In conclusion, our study suggests that targeting senescence may facilitate alveolar regeneration in COPD emphysema by promoting IGF1 proliferative signaling.

Keywords: Molecular biology; Senescence; Stem cells.


Conflict of interest statement

Competing interestsAll but G.C. are full time employees at AstraZeneca. N.P., J.K., A.B., X.X., A.H., W.Z., C.B., A.M., K.Z., R.K., J.C. and R.L. are shareholders of AstraZeneca. The remaining authors declare no competing interests.

Figures

Fig. 1
Fig. 1
Immunohistochemical localization of p16 in human lungs. p16 (red) and SPC (yellow) staining in a healthy non-smoker, healthy smoker, and b COPD human lungs. Arrowheads indicate co-localization of p16 and SPC (scale bar = 40 µm). c Percentage of p16 + (**p < 0.0001), d p16 + /SPC + (**p < 0.0001), and e SPC + cells in healthy and COPD lungs (*p = 0.0034). N = 3–11
Fig. 2
Fig. 2
Cigarette smoke promotes p16 promoter-driven luciferase activity and senescence. a Luciferase imaging of p16−/− lungs from mice exposed to RA or CS for 4 months. b Average radiance measuring luciferase activity in p16−/− lungs (*p = 0.0114). c Luciferase staining in RA- and CS-treated lungs; images were taken of alveolar space in p16−/− mice. Arrowheads indicate luciferase-positive AECII cells and arrows indicate macrophages (scale bar = 40 µm). d Quantitative real-time PCR of p16 RNA (*p = 0.0307, **p = 0.0003) and e SA β-Gal activity measured in whole lung homogenates after 4 months of RA or CS (*p = 0.0005). N, p16+/+ RA = 4–8, p16+/+ CS = 10–14, p16−/− RA = 4–7, and p16−/− CS = 12–14 mice
Fig. 3
Fig. 3
p16−/− lungs maintain function and structure when challenged with CS. a Lung compliance (**p < 0.0177), pressure/volume, and area (**p < 0.0001) between the inflation and deflation limb of the PV loop measured using Flexi-Vent. b Representative Masson’s trichrome staining of lungs exposed to RA or CS (scale bar = 40 µm), mean linear intercept was determined c from these images and quantified (*p < 0.0001 and **p < 0.0001 vs. p16−/− RA). d Body weight increases over 4 months, values are the percentage increase from day 0 (*p = 0.0031, **p < 0.0001). Quantitative RT-PCR analysis e of MMP-12 (*p = 0.029 vs. p16+/+ RA, **p = 0.0077 vs. p16+/+ CS), IL-33 (*p = 0.012 vs. p16+/+ RA, **p = 0.045 vs. p16+/+ CS), and TGFβ1 (*p = 0.0021 vs. p16+/+ RA, **p = 0.0036). After 4 months of CS, all samples were normalized to mouse GAPDH. f MMP-12 (*p = 0.0004 vs. p16+/+ RA, **p = 0.0088 vs. p16+/+ CS), IL-33 (*p = 0.004 vs. p16+/+ RA, **p = 0.023 vs. p16+/+ CS, ***p = 0.0452 vs. p16−/− RA), and TGFβ1 (*p = 0.0005 vs. p16+/+ RA, **p = 0.0097, ***p = 0.0036 vs. p16+/+ RA), protein levels determined by ELISA. All protein levels are normalized to total protein in the lysate. All data is expressed as mean ± SEM, n = 4–14 mice per group
Fig. 4
Fig. 4
SASPs and Inflammatory cytokines upregulated with CS ameliorated in p16−/− lungs. a Cytokines associated with senescent-associated secretory phenotype (SASP) and b inflammation on p16+/+ and p16−/− lungs exposed to RA or CS. IL-6 *p = 0.0499, **p = 0.0043 vs. p16+/+ CS, CXCL-1 *p = 0.0084, IL-13 *p = 0.05, **p = 0.0260, CCL-2 *p = 0.0006 vs. p16+/+ RA **p = 0.0009 vs. p16+/+ CS, RANTES *p = 0.0346, **p = 0.0267 vs. p16+/+ CS, Eotaxin *p = 0.0221 vs. p16+/+ RA, **p = 0.0010 vs. p16+/+ CS, IP-10 *p = 0.0372 vs. p16+/+ RA, **p = 0.0108, IL-5 *p = 0.0308, **p = 0.0377, IL-9 *p = 0.0425, IL-17a *p = 0.0234, **p = 0.05 vs. p16+/+ CS. N = 4–12 lungs per group
Fig. 5
Fig. 5
Increased cell proliferation and reduced AECII senescence in p16−/− lungs. a Twenty-four hours post IP EdU injection (50 mg/kg), p16+/+ and p16−/− lungs exposed to RA and CS were fixed and stained with Click-It EdU (green), SPC (yellow), Podoplatin (PDPN, red), and DAPI (blue, scale bar = 30 µm). b Quantification of lung proliferating (EdU+) cells in the alveolar airspace. At least 1500 nuclei per airspace were counted in each lung *p = 0.0197, **p < 0001. N = 4–12 lungs per group. c Percentage of SPC+ cells in the alveolar region of the lung *p = 0.015, **p = 0.0004. d Images of Isolated AECIIs from p16+/+ and p16−/− lungs treated with 5% CSE in 10% serum for 24 h and probed for β-galactosidase activity using C12FDG substrate (scale bar = 400 µm). e AECIIs immunostained with SPC (red) and DAPI (blue). f Flow cytometry analysis of AECII measuring purity of isolation. X axis is measuring EPCAM for epithelial cell specificity and y axis is measuring SPC for AECII specificity. g AECIIs treated with 5% CSE and C12FDG, and quantified with flow cytometry. Data represent the average ± SEM of four to five independent experiments
Fig. 6
Fig. 6
Increased IGF1 signaling in p16−/− lungs. a Heat map of 84 insulin-related genes in lungs treated with CS. Genes in blue are reduced, while genes in yellow are increased. N = 5 lungs per group. b IGF RNA levels measured by TAQman qPCR. *p = 0.016, **p = 0.007, ***p = 0.008. c IGF1 measured by ELISA from whole lung lysates. *p = 0.0028, **p = 0.0421 vs. + /+ CS. d Phospho-insulin receptor measured by ELISA (*p = 0.0085). e Levels of key proliferation signaling genes Akt1 (*p = 0.0137, **p = 0.0011), Pparγ (*p = 0.0009, **p = 0.0392), and MapK1 (*p < 0.0001, **p = 0.039) from profiler array. N = 5 lungs per group
Fig. 7
Fig. 7
Diminished IGF1 and Akt mRNA in human COPD lungs and loss of p16 increases Akt signaling in CS-exposed lungs. a, b Gene microarray analysis of whole lung lysates from 9 normal and 94 COPD donors **p = .85e−6. ce Protein profile of phosphor-Akt Thr308 (*p = 0.0359), total Akt (*p = 0.0396, **p = 0.0416), and Cyclin D (**p = 0.0249). f Representative western blotting of whole lung lysates exposed to RA and CS (n = 4–6). g Representative images of fibroblasts isolated from p16+/+ and p16−/− lungs then treated with DMSO or Akt I (10 μM, scale bar = 400 µm). h QPCR was performed to determine Cyclin D gene expression. Data are expressed as the average ± SEM of at least three independent experiments, *p = 0.0471, **p = 0.0230, ***p < 0.0001, #p = 0.001
Fig. 8
Fig. 8
Proposed mechanism of protection. In the presence of chronic CS, p16 levels increase and cells become senescent. CS induces pro-inflammatory cytokines throughout the lung, and in the senescent cells SASPs are secreted, which perpetuate senescence and alveolar destruction (right side). When the cell cycle inhibitor p16 is not present (left side), basal levels of IGF1 are upregulated, resulting in stimulated insulin receptors and activation of Akt. Activated Akt stimulates cell proliferation evidenced by increases in Cyclin D expression and the maintenance of healthy alveoli

References

    1. Adeloye D, et al. Global and regional estimates of COPD prevalence: systematic review and meta-analysis. J. Glob. Health. 2015;5:020415. doi: 10.7189/jogh.05.020415. - DOI - PMC - PubMed
    1. Karrasch S, Holz O, Jorres RA. Aging and induced senescence as factors in the pathogenesis of lung emphysema. Respir. Med. 2008;102:1215–1230. doi: 10.1016/j.rmed.2008.04.013. - DOI - PubMed
    1. Sarker RS, et al. Coactivator-associated arginine methyltransferase-1 function in alveolar epithelial senescence and elastase-induced emphysema susceptibility. Am. J. Respir. Cell Mol. Biol. 2015;53:769–781. doi: 10.1165/rcmb.2014-0216OC. - DOI - PMC - PubMed
    1. Rhee CK, et al. Natural course of early COPD. Int J. Chron. Obstruct Pulmon. Dis. 2017;12:663–668. doi: 10.2147/COPD.S122989. - DOI - PMC - PubMed
    1. Guirguis-Blake JM, Senger CA, Webber EM, Mularski RA, Whitlock EP. Screening for chronic obstructive pulmonary disease: evidence report and systematic review for the US Preventive Services Task Force. JAMA. 2016;315:1378–1393. doi: 10.1001/jama.2016.2654. - DOI - PubMed

Publication types

MeSH terms