. 2019 Oct 10;47(18):9658-9665.
doi: 10.1093/nar/gkz721.

The autoregulator Aca2 mediates anti-CRISPR repression

Affiliations

The autoregulator Aca2 mediates anti-CRISPR repression

Nils Birkholz et al. Nucleic Acids Res. .

Abstract

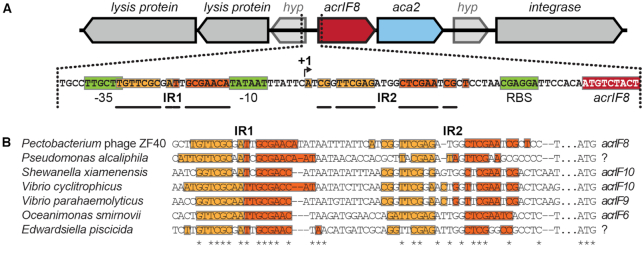
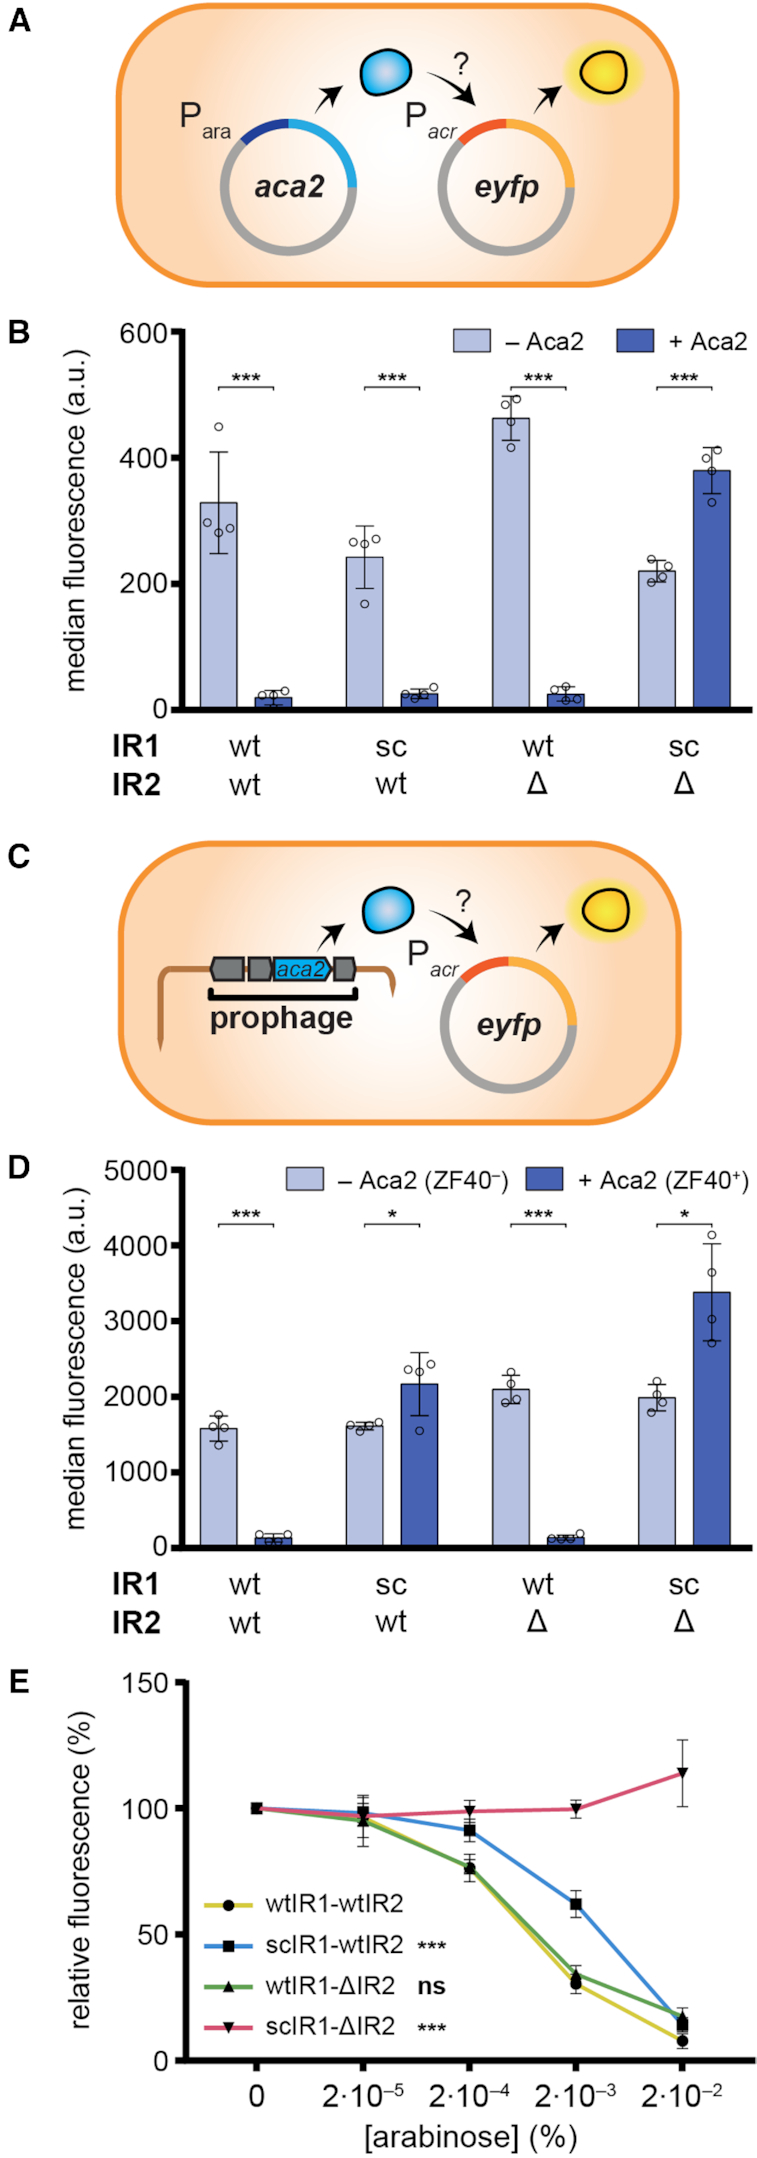
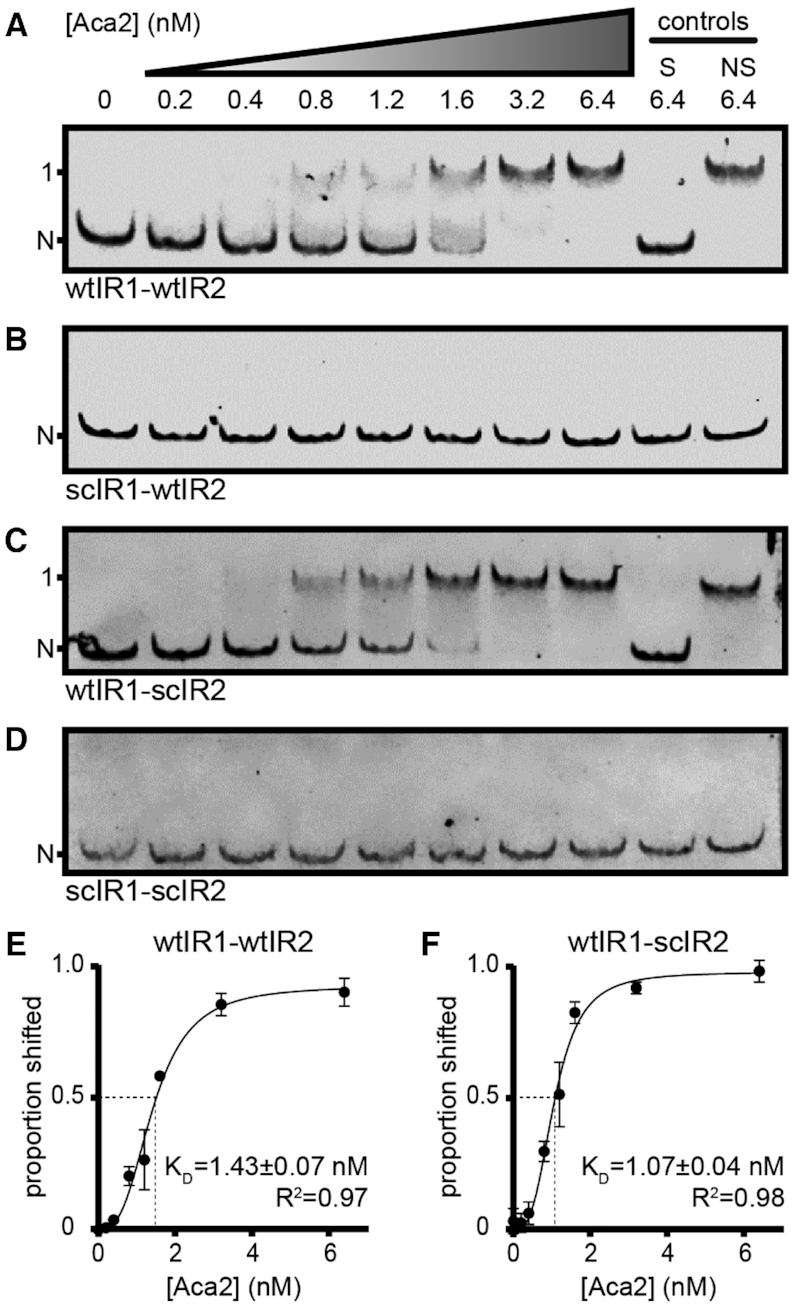
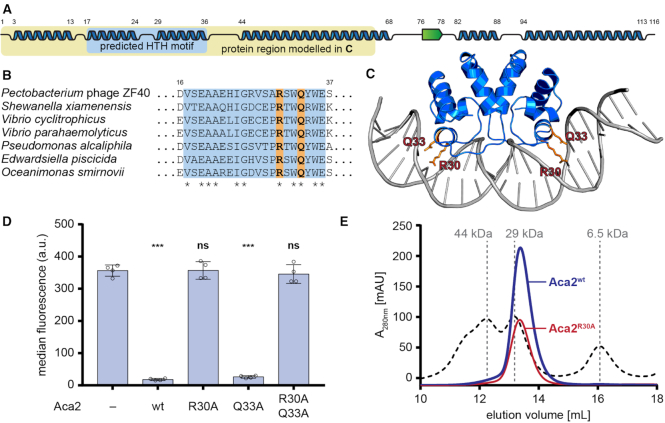
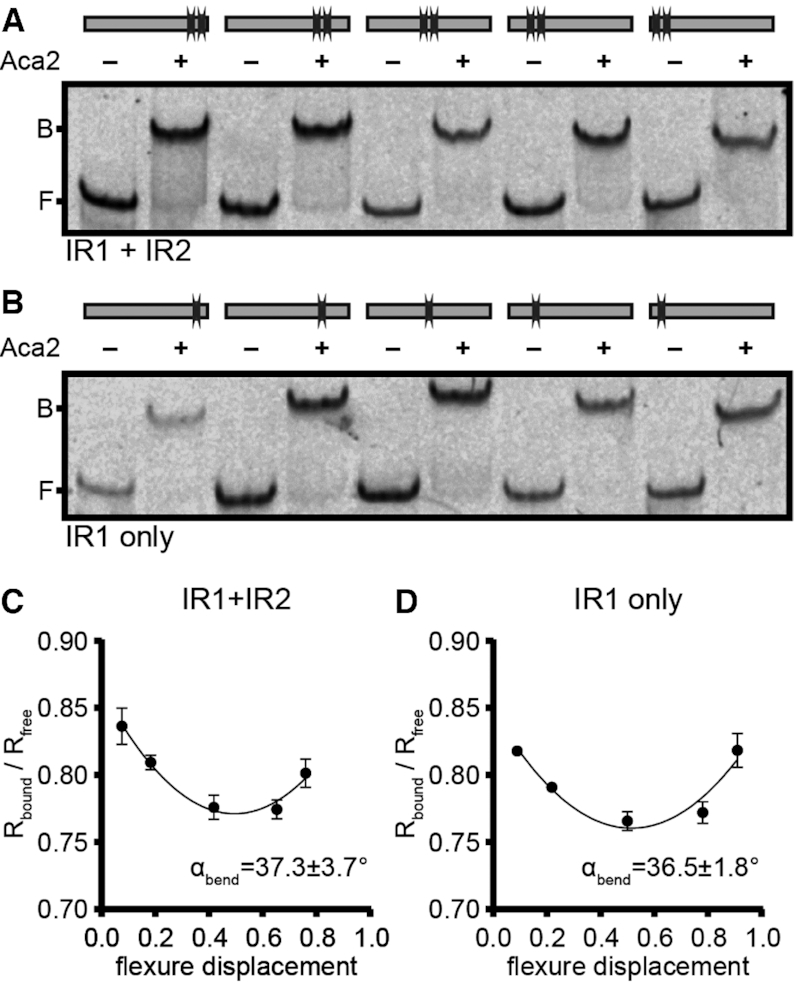
CRISPR-Cas systems are widespread bacterial adaptive defence mechanisms that provide protection against bacteriophages. In response, phages have evolved anti-CRISPR proteins that inactivate CRISPR-Cas systems of their hosts, enabling successful infection. Anti-CRISPR genes are frequently found in operons with genes encoding putative transcriptional regulators. The role, if any, of these anti-CRISPR-associated (aca) genes in anti-CRISPR regulation is unclear. Here, we show that Aca2, encoded by the Pectobacterium carotovorum temperate phage ZF40, is an autoregulator that represses the anti-CRISPR-aca2 operon. Aca2 is a helix-turn-helix domain protein that forms a homodimer and interacts with two inverted repeats in the anti-CRISPR promoter. The inverted repeats are similar in sequence but differ in their Aca2 affinity, and we propose that they have evolved to fine-tune, and downregulate, anti-CRISPR production at different stages of the phage life cycle. Specific, high-affinity binding of Aca2 to the first inverted repeat blocks the promoter and induces DNA bending. The second inverted repeat only contributes to repression at high Aca2 concentrations in vivo, and no DNA binding was detectable in vitro. Our investigation reveals the mechanism by which an Aca protein regulates expression of its associated anti-CRISPR.


Figures

Figure 1.
Figure 1.
Inverted repeat pairs are conserved in acr–aca2 operon promoters. (A) Genomic context of the acrIF8–aca2 locus of phage ZF40 with inverted repeat pairs (shades of orange; bold bars illustrate symmetry and distance between each half-site of the respective repeat). Predicted regulatory sequences (-35 and -10 sites, and ribosome binding site (RBS)) in green, predicted transcription start site (+1) indicated by an arrow. (B) Alignment (24) of acr–aca2 operon promoters with inverted repeats displayed as in (A). Invariant residues are indicated by an asterisk and the acr genes encoded downstream are given where known. Question marks indicate genes that have no matches among known acr genes.
Figure 2.
Figure 2.
Aca2 represses the acrIF8–aca2 operon. (A) Schematic of the plasmid setup for the assay to measure autoregulation of the acrIF8–aca2 promoter by Aca2 in a Pca ZF40 host (Pca RC5297). (B) Activity of acrIF8–aca2 promoter variants in Pca ZF40 in the presence and absence of Aca2, determined as the median eYFP fluorescence. The IR sites were mutated as indicated; sc: scrambled or Δ: deleted. (C) Schematic of the acrIF8–aca2 promoter assay in the ZF40+ strain (Pca lysogen ZM1). (D) Activity of acrIF8–aca2 promoter variants in the Pca ZF40+ strain, determined as the median eYFP fluorescence. The Pca ZF40 control strain lacks aca2 and in the Pca ZF40+ strain aca2 is expressed natively from the ZF40 prophage. (E) Activity of acrIF8–aca2 promoter variants in the Pca ZF40 strain in the presence of different concentrations of arabinose to induce aca2 expression. In (B) and (D), data are presented as the mean ± standard deviation of four biological replicates and statistical significance was tested by two-tailed unpaired t-tests (*P < 0.05, ***P < 0.001). In (E), data are presented as the mean ± standard deviation of six biological replicates and statistical significance compared to the wtIR1-wtIR2 promoter was tested by two-way ANOVA with Dunnett's Multiple Comparisons Test (***P < 0.001, ns: P > 0.05).
Figure 3.
Figure 3.
Aca2 binds tightly to IR1 in the acrIF8–aca2 promoter. (AD) Representative mobility shifts of indicated DNA probes with increasing Aca2 concentrations. Specific and non-specific controls (200-fold excess) are denoted S and NS, respectively. N and 1 indicate non-shifted and single-shifted bands, respectively. (E, F) Dose-response curves of the proportion of shifted probe (± standard deviation) as a function of Aca2 concentration and the resulting apparent dissociation constants (KD) based on three independent assays.
Figure 4.
Figure 4.
Aca2 is a dimeric HTH protein. (A) Predicted secondary structures of Aca2 from phage ZF40, with α-helices displayed as blue ribbons and a β-strand as a green arrow and their amino acid positions indicated by numbers. The predicted HTH motif is highlighted in light blue. The yellow box highlights the part of the protein used for modelling in panel (C). (B) Alignment of Aca2 HTH motifs from various bacterial species, with highly conserved residues indicated by an asterisk. Residues mutated in Aca2 point mutants are highlighted in orange. Numbers indicate amino acid positions in the ZF40 homolog. (C) An Aca2 dimer (region highlighted in panel A) modeled with a DNA template, based on the published structure of MqsA in complex with DNA. The residues R30 and Q33 are highlighted. (D) Median eYFP fluorescence, as measured during a reporter assay, for different Aca2 point mutants. Data presented are the mean ± standard deviation of four biological replicates and statistical significance was calculated by one-way ANOVA with Dunnett's Multiple Comparisons Test (***P < 0.001, ns: P > 0.05). (E) SEC elution profile of wild-type Aca2 (blue) and Aca2R30A (red), with size standards indicated by dashed lines for comparison.
Figure 5.
Figure 5.
Aca2 binding bends the acrIF8–aca2 promoter DNA. (A, B) Mobility shifts of DNA probes with varying flexure displacement (as indicated by the binding site schematics) in the absence or presence of Aca2. B and F indicate the positions of bound and free DNA, respectively. (C, D) DNA bending curves used to determine bending angles (αbend) ± standard deviation based on the difference of mobility for bound and unbound DNA (Rbound/Rfree) at varying flexure displacements of the probes, based on three independent replicates.

References

    1. Dy R.L., Richter C., Salmond G.P.C., Fineran P.C.. Remarkable mechanisms in microbes to resist phage infections. Annu. Rev. Virol. 2014; 1:307–331. - PubMed
    1. Rostøl J.T., Marraffini L.. (Ph)ighting phages: how bacteria resist their parasites. Cell Host Microbe. 2019; 25:184–194. - PMC - PubMed
    1. Koonin E.V., Makarova K.S.. Origins and evolution of CRISPR-Cas systems. Philos. Trans. R. Soc. B Biol. Sci. 2019; 374:20180087. - PMC - PubMed
    1. Barrangou R., Fremaux C., Deveau H., Richards M., Boyaval P., Moineau S., Romero D.A., Horvath P.. CRISPR provides acquired resistance against viruses in prokaryotes. Science. 2007; 315:1709–1712. - PubMed
    1. Jackson S.A., McKenzie R.E., Fagerlund R.D., Kieper S.N., Fineran P.C., Brouns S.J.J.. CRISPR-Cas: adapting to change. Science. 2017; 356:eaal5056. - PubMed

Publication types

MeSH terms