

Urinary markers of hydration during 3-day water restriction and graded rehydration
- PMID: 31428854
- PMCID: PMC7351875
- DOI: 10.1007/s00394-019-02065-7
Urinary markers of hydration during 3-day water restriction and graded rehydration
Abstract
Purpose: This investigation had three purposes: (a) to evaluate changes in hydration biomarkers in response to a graded rehydration intervention (GRHI) following 3 days of water restriction (WR), (b) assess within-day variation in urine concentrations, and (c) quantify the volume of fluid needed to return to euhydration as demonstrated by change in Ucol.
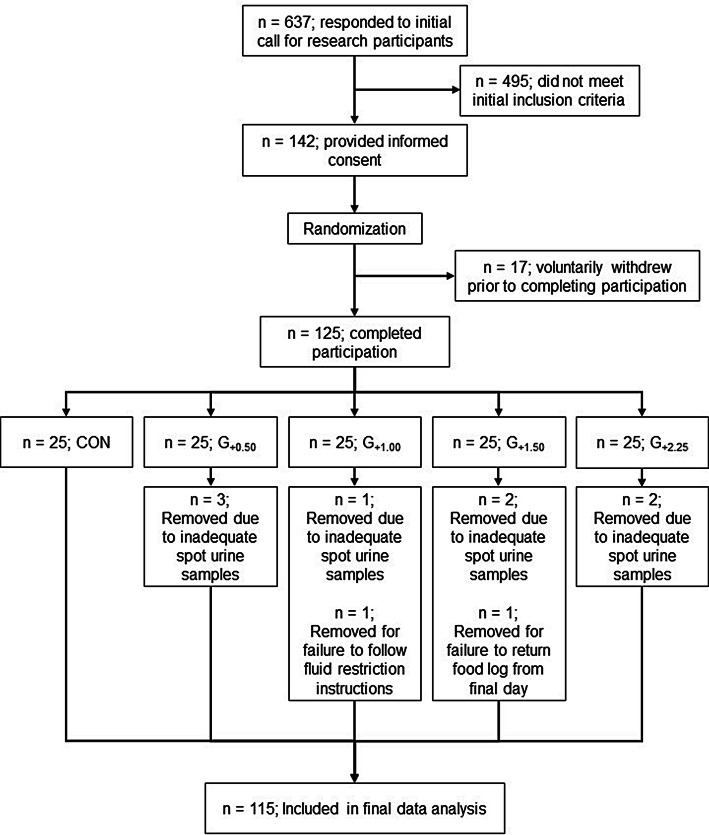
Methods: 115 adult males and females were observed during 1 week of habitual fluid intake, 3 days of fluid restriction (1000 mL day-1), and a fourth day in which the sample was randomized into five different GRHI groups: no additional water, CON; additional 500 mL, G+0.50; additional 1000 mL, G+1.00; additional 1500 mL, G+1.50; additional 2250 mL, G+2.25. All urine was collected on 1 day of the baseline week, during the final 2 days of the WR, and during the day of GRHI, and evaluated for urine osmolality, color, and specific gravity.
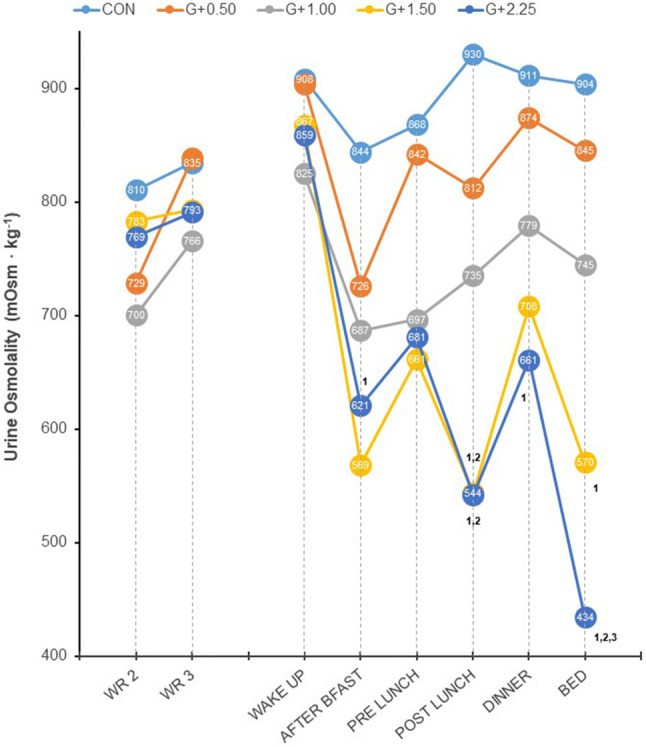
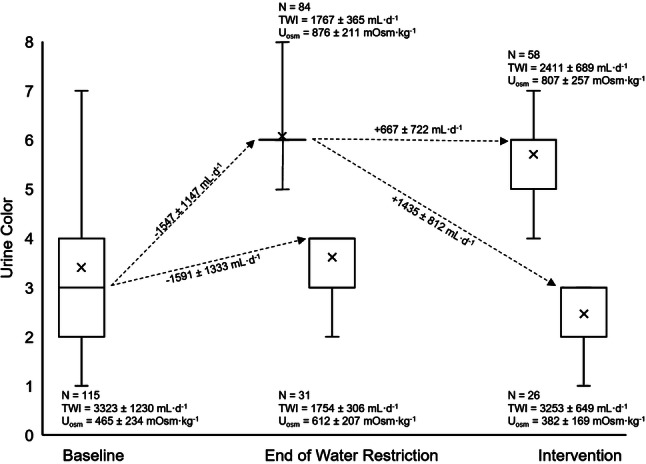
Results: Following the GRHI, only G+1.50 and G+2.25 resulted in all urinary values being significantly different from CON. The mean volume of water increase was significantly greater for those whose Ucol changed from > 4 to < 4 (+ 1435 ± 812 mL) than those whose Ucol remained ≥ 4 (+ 667 ± 722 mL, p < 0.001).
Conclusions: An additional 500 mL of water is not sufficient, while approximately 1500 mL of additional water (for a total intake between 2990 and 3515 mL day-1) is required to return to a urine color associated with adequate water intake, following 3 days of WR.
Keywords: Hydration; Hypohydration; Urine color; Urine osmolality; Water recommendations.
Conflict of interest statement
This investigation was funded by a research grant by Danone Research. ECJ received this grant and was partially funded during his graduate studies by similar grants from Danone Research. Alberto Dolci and Erica T. Perrier are employees of Danone Research, but did not participate in the collection or analysis of the data. Lawrence E. Armstrong has received previous research grants and consulting income from Danone Research, and served as an independent contractor to the University of Wyoming as part of this investigation. Ainsley E. Huffman, Hillary Yoder, and D. Enette Larson-Meyer have not received funding associated with this or past projects.
Figures
References
-
- Food and Nutrition Board, Institute of Medicine . Dietary reference intakes for water, potassium, sodium, chloride, and sulfate. Washington, DC: National Academies Press; 2004.
Publication types
MeSH terms
Substances
Grants and funding
LinkOut - more resources
Full Text Sources
Medical
