. 2019 Aug 20;20(1):663.
doi: 10.1186/s12864-019-6018-1.

Transcriptome profile of Corynebacterium pseudotuberculosis in response to iron limitation

Affiliations

Transcriptome profile of Corynebacterium pseudotuberculosis in response to iron limitation

Izabela Coimbra Ibraim et al. BMC Genomics. .

Abstract

Background: Iron is an essential micronutrient for the growth and development of virtually all living organisms, playing a pivotal role in the proliferative capability of many bacterial pathogens. The impact that the bioavailability of iron has on the transcriptional response of bacterial species in the CMNR group has been widely reported for some members of the group, but it hasn't yet been as deeply explored in Corynebacterium pseudotuberculosis. Here we describe for the first time a comprehensive RNA-seq whole transcriptome analysis of the T1 wild-type and the Cp13 mutant strains of C. pseudotuberculosis under iron restriction. The Cp13 mutant strain was generated by transposition mutagenesis of the ciuA gene, which encodes a surface siderophore-binding protein involved in the acquisition of iron. Iron-regulated acquisition systems are crucial for the pathogenesis of bacteria and are relevant targets to the design of new effective therapeutic approaches.

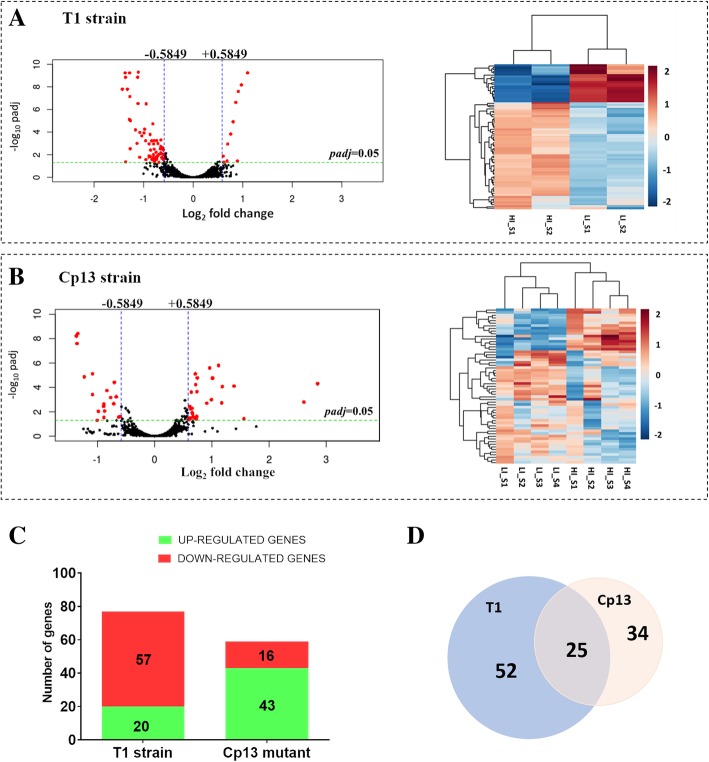
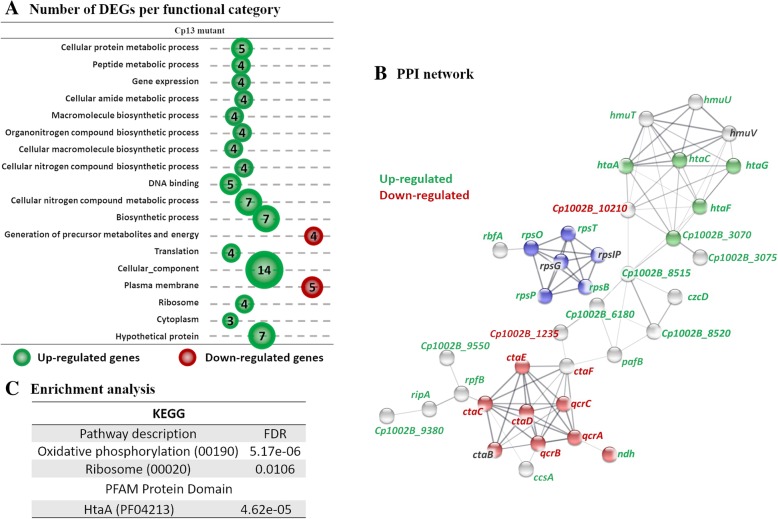
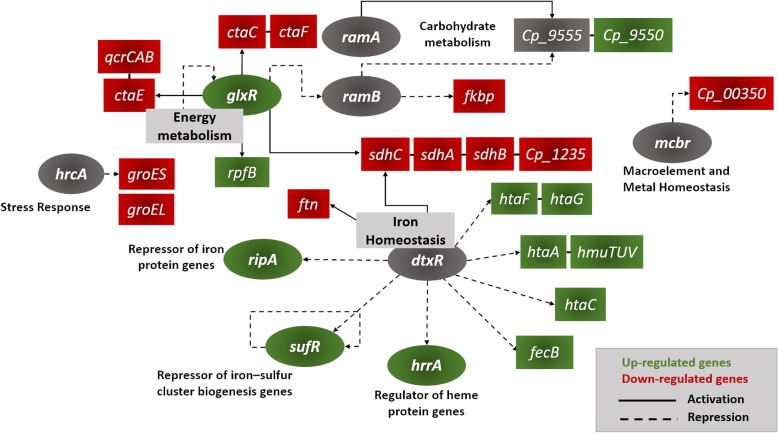
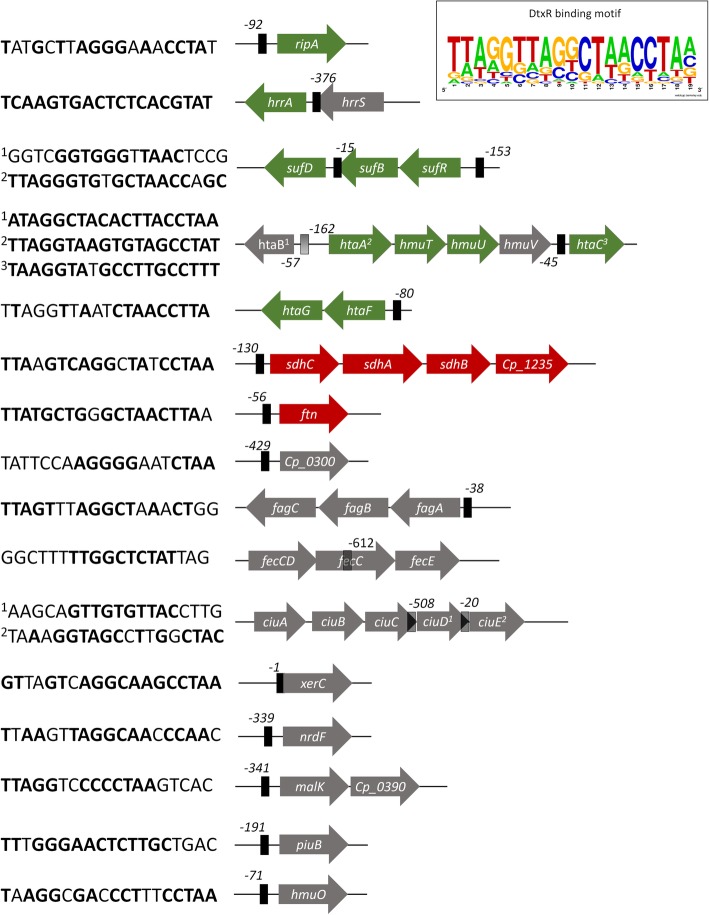
Results: Transcriptome analyses showed differential expression in 77 genes within the wild-type parental T1 strain and 59 genes in Cp13 mutant under iron restriction. Twenty-five of these genes had similar expression patterns in both strains, including up-regulated genes homologous to the hemin uptake hmu locus and two distinct operons encoding proteins structurally like hemin and Hb-binding surface proteins of C. diphtheriae, which were remarkably expressed at higher levels in the Cp13 mutant than in the T1 wild-type strain. These hemin transport protein genes were found to be located within genomic islands associated with known virulent factors. Down-regulated genes encoding iron and heme-containing components of the respiratory chain (including ctaCEF and qcrCAB genes) and up-regulated known iron/DtxR-regulated transcription factors, namely ripA and hrrA, were also identified differentially expressed in both strains under iron restriction.

Conclusion: Based on our results, it can be deduced that the transcriptional response of C. pseudotuberculosis under iron restriction involves the control of intracellular utilization of iron and the up-regulation of hemin acquisition systems. These findings provide a comprehensive analysis of the transcriptional response of C. pseudotuberculosis, adding important understanding of the gene regulatory adaptation of this pathogen and revealing target genes that can aid the development of effective therapeutic strategies against this important pathogen.

Keywords: Corynebacterium pseudotuberculosis; Differential gene expression; Heme acquisition; Iron homeostasis; Iron-regulated transcriptional factors.


Conflict of interest statement

The authors declare that they have no competing interests.

Figures

Fig. 1
Fig. 1
C. pseudotuberculosis growth assays. Growth proliferation was determined by measuring the OD of low iron (LI) and high iron (HI) cultures at 600 nm of the wild-type (parent) T1 strain and the Cp13 mutant strain, reflecting the growth dynamics of the bacterial strains in the culture media over the different time points. BHI broth was supplemented with 250 μM of the iron chelator 2,2′-dipyridyl (DIP) to iron stress the bacteria. The stress was confirmed at 6h30min with a significant reduction in the final culture density of both strains. At the 6h30min, both strains presented a final LI culture density of 63 and 52.6% of the bacteria grown in the high iron BHI broth a wild-type T1 strain and b Cp13 mutant. C. pseudotuberculosis viability was measured by determining the number of CFU/mL after 6h30min of incubation in a low iron (LI) dipyridyl-chelated and high iron (HI) non-chelated media. Average log10 (CFU/mL) along with the standard deviation (error bars) for the experimental cultured conditions (HI vs LI) from three individual biological replicates are represented. Differences between HI and LI for the wild-type T1 strain and Cp13 mutant were shown to be statistically significant using a two-tailed t test with a p-value < 0.001(****). Log10 (CFU/mL) in the c wild-type T1 strain and the d Cp13 mutant
Fig. 2
Fig. 2
Differential gene expression of C. pseudotuberculosis CpT1 strain and Cp13 mutant under iron limitation. Counts were normalized using DESeq2 and differentially expressed genes were filtered using a false discovery rate (FDR) of < 0.05 and a log2fold change > 0.5849 or < − 0.5849 for biological significance. Volcano plots (on the left) of the log2-fold change of each detected gene in relation to their -log10 of adjusted p values and heatmaps (on the right) are shown in figure a for the 77 differentially expressed genes in the wild-type T1 strain and figure b shows 59 DEGs in the Cp13 mutant. In the volcano plots threshold of log2fold change and p adjusted value are represented by blue and green lines, respectively. Rlog-transformed normalized counts in the heatmap were clustered based on Euclidean distance. Rows indicate genes and columns represent individual samples from the two experimental conditions (LI and HI represent low iron and high iron conditions, respectively). c Stacked-bar graph representing the total number of the up and down-regulated genes identified in the T1 and Cp13 strains, considering a greater than 1.5-fold change (log2fold change 0.5849 and − 0.5849), where 57 and 16 genes with diminished expression, 20 and 43 genes with increased expression under iron restriction are specified. d Comparative analysis of the DEGs between wild-type and Cp13 mutant is represented by a scaled Venn diagram showing 52 genes expressed only in the wild-type T1 strain, 34 genes expressed only in the Cp13 mutant and 25 genes common to both wild-type and mutant (intersection)
Fig. 3
Fig. 3
Functional annotation and PPI analysis of the DEGs in the wild-type T1 strain. a The number of differentially expressed genes are shown by functional categories, where circle sizes are proportional to the number of genes with significant differential expression. Green circles represent genes with increased expression and red circles represent genes with diminished expression. Only terms with > 2 genes assigned to a functional category are shown. b PPI analyses were carried out using the STRING database analysis tool and line thickness indicates the strength of data support for each interaction. Only connected nodes and interaction with a medium (> 0.4), high (> 0.7) and highest confidence (> 0.9) are visualized in the network. Node colors represent enriched functional categories and gene identification color represents up-regulation (green), down-regulation (red) and unchanged expression (gray). p-value of PPI interactions indicates significance of protein association. a The STRING PPI network of the T1 strain contained 75 nodes and 298 edges with PPI interaction enrichment p-value of < 1.0e-16 (Additional file 5: Figure S4). 4 enriched categories are shown: TCA cycle (green), oxidative phosphorylation (red), ribosome (blue) and HtaA domain (pink). c Enrichment analysis was conducted using STRING and significant expressed categories (FDR < 0.01) are indicated
Fig. 4
Fig. 4
Functional annotation and PPI analysis of the DEGs in the Cp13 mutant. a The number of differentially expressed genes are shown by functional categories, where circle sizes are proportional to the number of genes with significant differential expression. Green circles represent genes with increased expression and red circles represent genes with diminished expression. Only terms with > 2 genes assigned to a functional category are shown. b PPI analysis was carried out using the STRING database analysis tool and line thickness indicates the strength of data support for each interaction. Only connected nodes and interaction with a medium (> 0.4), high (> 0.7) and highest confidence (> 0.9) are visualized in the network. Node colors represent enriched functional categories and gene identification color represents up-regulation (green), down-regulation (red) and unchanged expression (gray). p-value of PPI interactions indicates significance of protein association. Cp13 PPI interactions contained 56 nodes and 94 edges with a PPI interaction enrichment p-value of 6.02e-14 (Additional file 5: Figure S4). Three enrichments are shown: oxidative phosphorylation (red), ribosome (blue) and HtaA domain (green). c Enrichment analysis was conducted using STRING and significant expressed categories (FDR < 0.05) are indicated
Fig. 5
Fig. 5
Expression pattern of commonly expressed genes identified between the T1 strain and the Cp13 mutant. Hierarchical clustering of the 25 DEGs commonly expressed between the strains was used to identify the pattern of expression of these genes. Rlog-transformed normalized counts in the heatmap were clustered based on Euclidean distance and show 25 DEGs consistently up- or down-regulated in the T1 strain and Cp13 mutant. Columns represent sample identification in relation to experimental condition and strains. Representative gene clusters identified between both strains are indicated highlighting the clusters involving high-affinity hemin-binding acquisition systems, transcription factors and genes encoding the cytochrome bcc-aa3 super complex of the respiratory chain. Up-regulated genes are shown as green arrows; down-regulated genes are shown as red arrows and genes with unchanged expression are shown as gray. Black solid bars represent DtxR predicted regulatory binding sites and striped-bars represent GlxR regulatory binding sites
Fig. 6
Fig. 6
Gene network of the DEGs between wild-type T1 strain and Cp13 mutant. Networks shown involve DEGs identified in the transcriptional profile of both strains. TF genes are shown as circles. The colors represent the type of expression pattern and it is consistent with data in Table 1. Green indicates up-regulated genes, red indicates down-regulated genes and gray indicates genes with no difference in fold-change expression. Black solid lines represent transcriptional activation of the target gene and black dashed lines represent transcriptional repression of the target gene. Connected genes represent operons
Fig. 7
Fig. 7
Genetic map of the target genes identified as having a putative iron-DtxR regulated binding site. Conserved residues in relation to the reference are indicated in bold. DtxR target site prediction was based on orthologous target and experimentally confirmed sites of DtxR orthologous identified in taxonomically closely related species: C. glutamicum (NC_003450), C. diphtheriae (NZ_LN831026) and M. tuberculosis (NC_000962). Upregulated genes are shown as green arrows; downregulated genes are shown as red arrows and genes with unchanged expression are shown as gray. Detected DtxR binding sites are indicated as black boxes upstream the genes coding regions. The 19-bp consensus sequence of the DtxR-binding site of C. pseudotuberculosis is shown as DNA sequence logo

References

    1. Baird GJ, Fontaine MC. Corynebacterium pseudotuberculosis and its role in ovine Caseous lymphadenitis. J Comp Pathol. 2007;137(4):179–210. - PubMed
    1. Dorella Fernanda Alves, Carvalho Pacheco L., Oliveira Sergio Costa, Miyoshi Anderson, Azevedo Vasco. Corynebacterium pseudotuberculosis: microbiology, biochemical properties, pathogenesis and molecular studies of virulence. Veterinary Research. 2006;37(2):201–218. - PubMed
    1. Pépin M., Pardon P., Lantier F., Marly J., Levieux D., Lamand M. Experimental Corynebacterium pseudotuberculosis infection in lambs: kinetics of bacterial dissemination and inflammation. Veterinary Microbiology. 1991;26(4):381–392. - PubMed
    1. Cassat James E., Skaar Eric P. Iron in Infection and Immunity. Cell Host & Microbe. 2013;13(5):509–519. - PMC - PubMed
    1. Schaible Ulrich E., Kaufmann Stefan H. E. Iron and microbial infection. Nature Reviews Microbiology. 2004;2(12):946–953. - PubMed

MeSH terms