. 2019 Aug 20;7(1):134.
doi: 10.1186/s40478-019-0761-z.

Retinal ischemia induces α-SMA-mediated capillary pericyte contraction coincident with perivascular glycogen depletion

Affiliations

Retinal ischemia induces α-SMA-mediated capillary pericyte contraction coincident with perivascular glycogen depletion

Luis Alarcon-Martinez et al. Acta Neuropathol Commun. .

Abstract

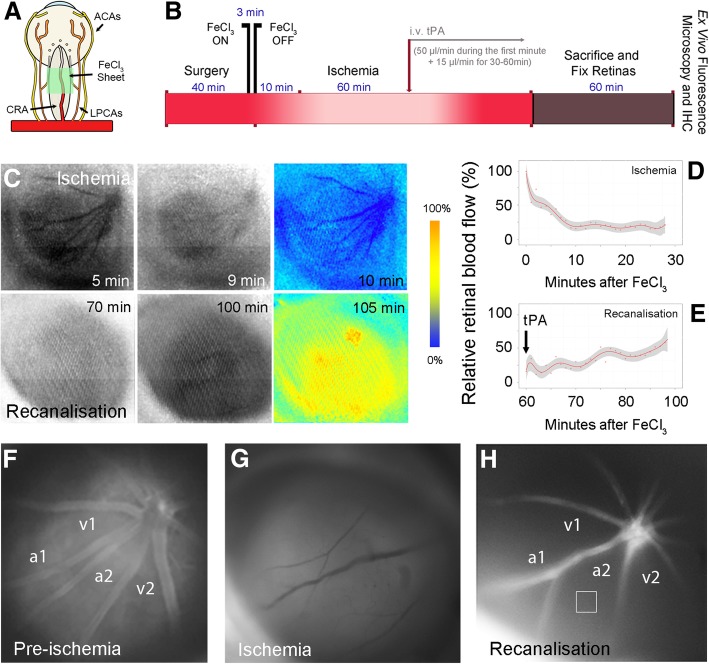
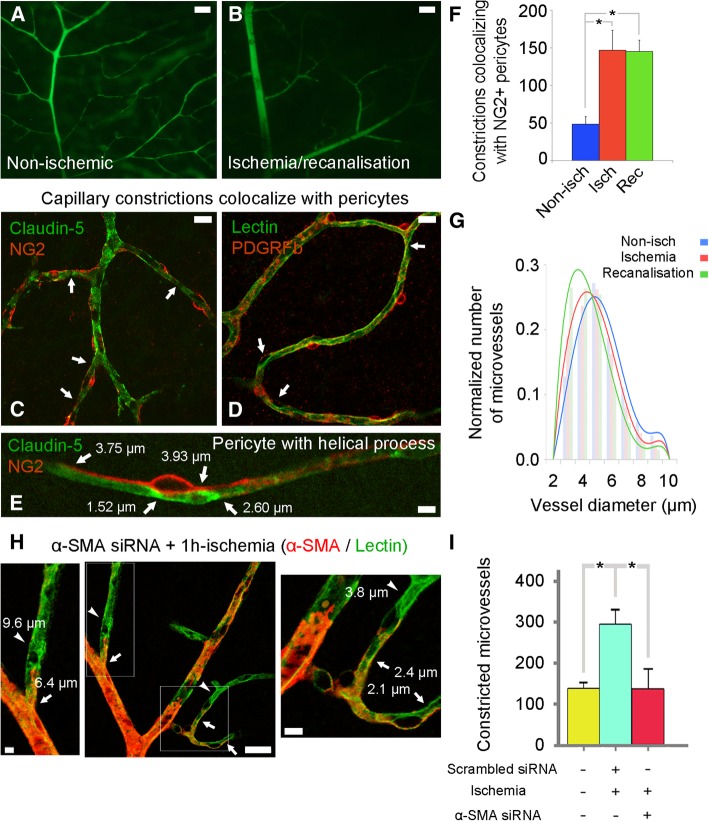
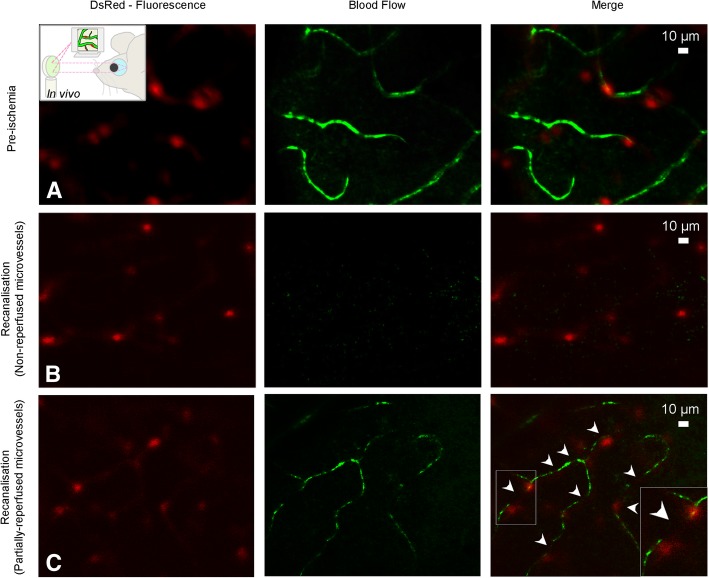
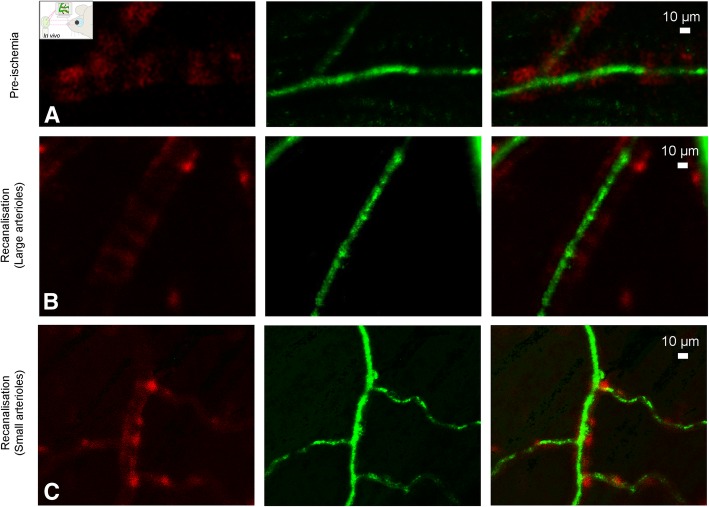
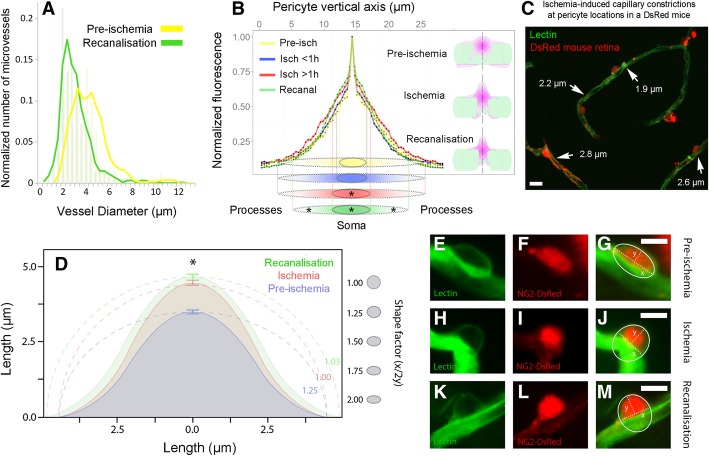
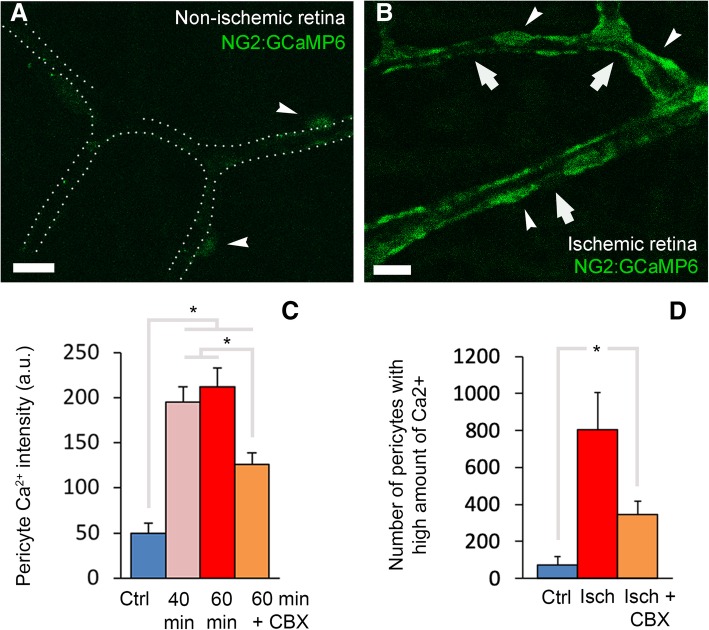
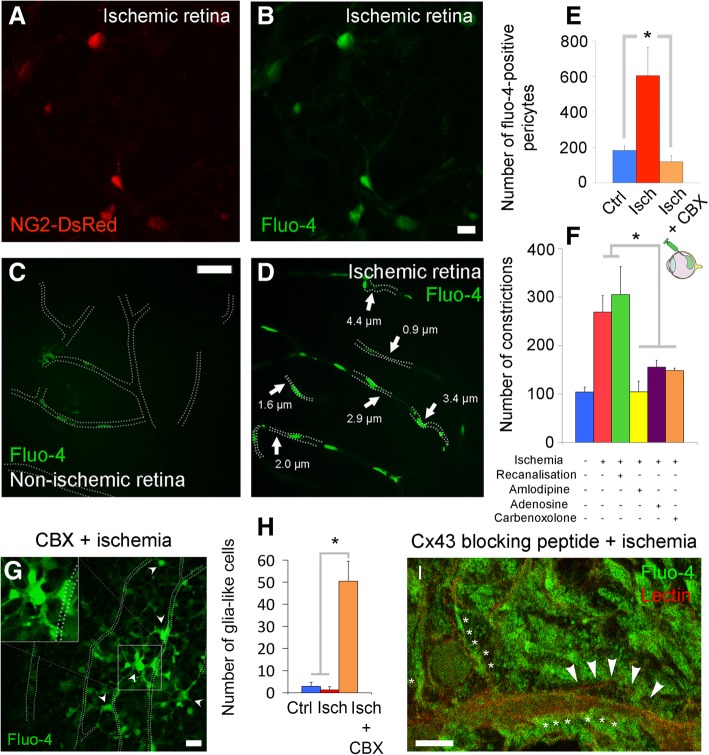
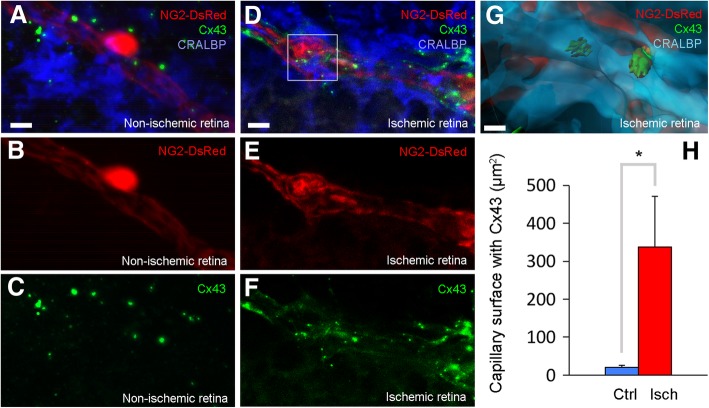
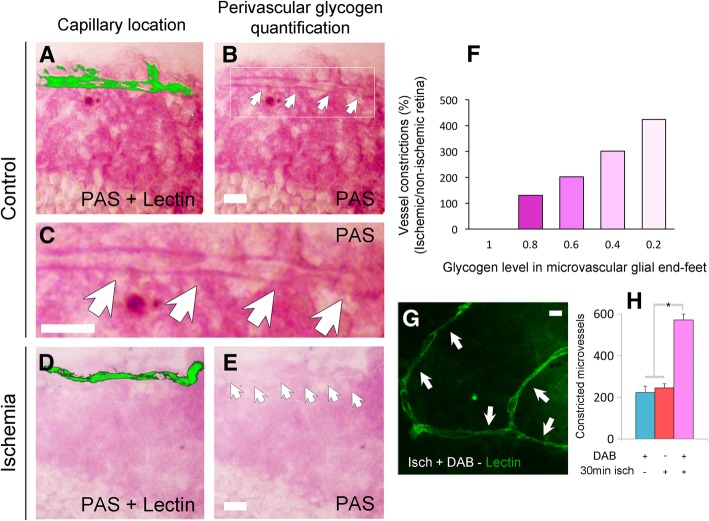
Increasing evidence indicates that pericytes are vulnerable cells, playing pathophysiological roles in various neurodegenerative processes. Microvascular pericytes contract during cerebral and coronary ischemia and do not relax after re-opening of the occluded artery, causing incomplete reperfusion. However, the cellular mechanisms underlying ischemia-induced pericyte contraction, its delayed emergence, and whether it is pharmacologically reversible are unclear. Here, we investigate i) whether ischemia-induced pericyte contractions are mediated by alpha-smooth muscle actin (α-SMA), ii) the sources of calcium rise in ischemic pericytes, and iii) if peri-microvascular glycogen can support pericyte metabolism during ischemia. Thus, we examined pericyte contractility in response to retinal ischemia both in vivo, using adaptive optics scanning light ophthalmoscopy and, ex vivo, using an unbiased stereological approach. We found that microvascular constrictions were associated with increased calcium in pericytes as detected by a genetically encoded calcium indicator (NG2-GCaMP6) or a fluoroprobe (Fluo-4). Knocking down α-SMA expression with RNA interference or fixing F-actin with phalloidin or calcium antagonist amlodipine prevented constrictions, suggesting that constrictions resulted from calcium- and α-SMA-mediated pericyte contractions. Carbenoxolone or a Cx43-selective peptide blocker also reduced calcium rise, consistent with involvement of gap junction-mediated mechanisms in addition to voltage-gated calcium channels. Pericyte calcium increase and capillary constrictions became significant after 1 h of ischemia and were coincident with depletion of peri-microvascular glycogen, suggesting that glucose derived from glycogen granules could support pericyte metabolism and delay ischemia-induced microvascular dysfunction. Indeed, capillary constrictions emerged earlier when glycogen breakdown was pharmacologically inhibited. Constrictions persisted despite recanalization but were reversible with pericyte-relaxant adenosine administered during recanalization. Our study demonstrates that retinal ischemia, a common cause of blindness, induces α-SMA- and calcium-mediated persistent pericyte contraction, which can be delayed by glucose driven from peri-microvascular glycogen. These findings clarify the contractile nature of capillary pericytes and identify a novel metabolic collaboration between peri-microvascular end-feet and pericytes.

Keywords: Alpha-smooth muscle actin; Capillary constriction; Retinal ischemia/reperfusion; Retinal pericytes; Retinal vasculature.


Conflict of interest statement

The authors declare that they have no competing interests.

Figures

Fig. 1
Fig. 1
Incomplete retinal microcirculatory reperfusion after ischemia. a The illustration depicts the placement of a small strip (0.3 × 1 mm) of 20% FeCl3–saturated filter paper over the optic nerve for 3 min to produce retinal ischemia by occluding the central retinal artery (CRA). ACA: anterior cilliary artery, LPCA: long posterior cilliary artery. b The diagram depicts in vivo ischemia/recanalisation experiments and preparation of retinae for ex vivo studies. c Raw (black and white) and relative (pseudo-colored) laser speckle contrast (LSC) images recorded within the first 10 min after FeCl3 application (upper row) or within 35 min of tPA infusion (lower row) show progress of retinal ischemia and reperfusion after recanalisation. Time (minutes) elapsed after FeCl3 placement is indicated on each panel. The relative LSC images at the end of each row were generated by comparing the raw image to the first images in each row to illustrate the relative changes in retinal blood flow. Cold colors (blue) depict a decrease, whereas hot colors (yellow, red) represent an increase in blood flow relative to the beginning of ischemia or tPA infusion. Note the blood flow decrease in vessels as well as retina during ischemia. d Illustrates the typical retinal blood flow drop measured in a mouse from 3 non-overlapping randomly selected region of interests over the retina within 10 min after induction of clot formation by FeCl3 in the central retinal artery as detected by LSC imaging. Red dots represent the individual measurements obtained every 10 s, and the red line and shaded area illustrate the mean and its standard deviation, respectively. e Illustrates the retinal blood flow recovery within 35 min following the beginning of tPA infusion relative to the maximum flow drop during ischemia. f-h In vivo fluorescence retinal angiograms obtained with infusion of FITC–dextran-70S (i.v.) before (pre-ischemia) (f) or during ischemia (g), and after successful recanalisation (h). Note less intense fluorescence emission from the retinal tissue (square) and draining venules (v1, v2) after recanalisation despite re-filling of the retinal arterioles (a1, a2), suggesting impaired microcirculatory reflow
Fig. 2
Fig. 2
Ischemia-induced microvascular constrictions are caused by pericyte contraction mediated by α-SMA. a and b Ex vivo fluorescence imaging of vasculature filled with FITC–dextran-70S on whole-mounted retinae from non-ischemic and recanalized eyes confirms incomplete filling of microcirculation after recanalization (b) compared to the well-visualized microvessels in a non-ischemic retina (a). c-e Ex vivo co-labeling of the retinae with anti-claudin-5 and anti-NG2 antibodies (c and e) or lectin and anti-PDGFRβ antibody (d) shows that several capillary segments (green) under the pericyte soma or processes (red, in c and d) were constricted (a focal narrowing to < 1/2 diameter, arrows) in retinae subjected to 1 h of central retinal artery occlusion and 1 h of recanalisation. Note that, in addition to the constricted segments under the junctional pericytes, constrictions were also present near the pericytes with helical processes located at the straight parts of capillaries (e, see also the green channel separately in Additional file 1: Figure S1). f The number of microvessel (< 9 μm) constrictions (measured within < 10 μm away from or under pericyte soma) in a whole-mount retina that colocalized with NG2+ pericytes increased significantly with ischemia (non-ischemia: n = 5 retinae; ischemia: n = 3 retinae; P = 0.004, ANOVA and Dunnett’s test) and did not recover after recanalisation, (recanalisation: n = 5 retinae; P = 0.002 compared to non-ischemia, ANOVA and Dunnett’s test). g The diameter of the microvessels was also reduced after ischemia (red; n = 4268 microvessels in three retinae) and recanalisation (green; n = 4533 microvessels in three retinae) compared to the non-ischemic retina (blue; n = 5444 microvessels in three retinae). The diameter reduction was more evident in small microvessels. h and i Knocking down α-SMA expression prevented 1 h-ischemia-induced constrictions. h Illustrates microvessels from an ischemic retina pre-treated with α-SMA siRNA 24 h before induction of ischemia. α-SMA was immunostained red and vessels were labeled green with lectin. There were no constrictions at capillary segments where α-SMA expression was knockdown (only green labeled, arrowheads), whereas constrictions continued (arrows) at segments where α-SMA expression was preserved (red). Note that the capillary on the right bottom had a smaller radius at the proximal part where α-SMA was still expressed whereas its distal segment had a larger diameter and no constrictions (inset on the right). A similar pattern is also seen in the left upper capillary (inset on the left). i Graph illustrates the number of constrictions in non-ischemic, scrambled siRNA-pretreated ischemic and α-SMA siRNA-pretreated ischemic retinae (n = 3 retinae per group; *P = 0.007, ANOVA and Tukey’s test). Scale bar in a-b = 50 μm; in c-d = 10 μm; in e = 5 μm; in h = 5 μm (left), 25 μm (middle), 5 μm (right)
Fig. 3
Fig. 3
In vivo demonstration of the ischemia-induced pericyte contractions. a-c AOSLO created an opportunity of observing retinal pericytes on microvessels in NG2-DsRed mice in vivo along with retinal blood flow. a Prior to ischemia, pericytes (notably their somas) emitting red fluorescence were visible on microvessels exhibiting an uninterrupted blood flow (green). Vessels were visualized by the motion contrast created by erythrocyte flow and pseudo-colored depending on flow intensity b After recanalisation of the occluded central retinal artery, the microcirculation could not be visualized in some microvessels (no-reflow) because AOSLO makes vessels visible by detecting the erythrocyte motion in their lumen (pseudo-colored in green). c Some microvessels exhibited a thin stream of flow (incomplete reperfusion). The frequent stalls (black segments, arrowheads) in partially reperfused capillaries is due to reduced perfusion pressure caused by constrictions, some of which correspond to pericyte somas visible in the red channel (inset). Scale bars = 10 μm. For videos, please see the Additional files
Fig. 4
Fig. 4
Arterioles were completely reperfused after recanalization and did not exhibit constrictions unlike downstream microvessels. a-c In vivo AOSLO imaging shows that the blood flow in large (b) as well as small arterioles (c) was restored to pre-ischemia levels (a) after re-opening of the central retinal artery. b illustrates one of the arterioles emerging directly from the central retina artery (41.8 μm), whereas the one c is a secondary arteriole (22.4 μm). Red fluorescence comes from the smooth muscle cells surrounding arterioles in NG2-DsRed mice, whereas green signal is generated by pseudo-coloring of erythrocyte motion in their lumina. Scale bars = 10 μm. For videos, please see the Additional files
Fig. 5
Fig. 5
Changes in pericyte morphology during ischemia and recanalisation in vivo suggest pericyte contraction. a In vivo luminal diameters of the visualized microvessels (i.e. those with blood flow) at pericyte locations after recanalisation (green; n = 441 microvessels in three recanalized retinae) were significantly smaller compared to pre-ischemic retinae (yellow; n = 143 microvessels in four pre-ischemic retinae, P < 0.0001, Student’s t-test). b Morphological analysis of DsRed-fluorescent pericytes imaged with AOSLO in vivo disclosed that the pericyte soma rounded up protruding away from the lumen in accordance with a contracted morphology after 1 h of ischemia and remained so after recanalisation. Pericyte shapes at each stage are illustrated on the right and schematically represented at the bottom. The graph shows the distribution of the somatic DsRed signal and, discloses that the soma extended longer along the vertical axis after 1-h of ischemia and during recanalization compared to pre-ischemia (P = 0.005, ANOVA and Tukey’s test; yellow, n = 72 pericytes in four pre-ischemic retinae; blue, n = 226 pericytes in three 0-1 h ischemic retinae; red, n = 125 pericytes in four 1-2 h ischemic retinae; green, n = 530 pericytes in three recanalized retinae). The vertical lines projected from the 50% of the peak signal values show that the soma fluorescence condensed after 1-h of ischemia and during recanalization in line with a contracted cell body profile (red and green scheme at the bottom). The processes were also shortened along the horizontal axis after recanalisation (green scheme at the bottom, P = 0.021, ANOVA and Tukey’s test). c Whole-mount retinae from NG2-DsRed mice treated with lectin were examined ex vivo after completing in vivo recordings, which clearly illustrated that the ischemia-induced microvascular constrictions were colocalized with DsRed+ pericytes (arrows, luminal diameters are given next to the arrows). d Ex vivo analysis of DsRed+ pericyte morphology after labeling pericyte basement membrane with lectin confirms that soma protruded away from the lumen and assumed a circular shape after 1 h of ischemia (P = 0.006, ANOVA and Dunnett’s test) and recanalisation (P = 0.01, ANOVA and Dunnett’s test) compared to non-ischemic retinae as illustrated by their shape factor calculated with the formula, f = x/2y (x horizontal, y vertical axis and f = 1 = sphere, f > 1, horizontal ellipse; blue, 1.25 ± 0.06, n = 530 pericytes in three non-ischemic retinae; red, 1.00 ± 0.02, n = 655 pericytes in three 1 h-ischemic retinae; green, 1.03 ± 0.016, n = 387 pericytes in three recanalisated retinae). e-m Representative examples of pericyte morphology under pre-ischemic (e-g), ischemic (h-j), and recanalisated conditions (k-m). The basement membrane of NG2-DsRed pericytes (f, i and l) was labeled with lectin (e, h and k). Scale bar in C = 10 μm; scale bar in e-m = 5 μm
Fig. 6
Fig. 6
Ischemia-induced pericyte contraction is mediated by calcium and is time dependent in NG2:GCaMP6 mice. a and b images from the retina of mouse expressing a genetically encoded calcium indicator (GCaMP6) under the NG2 promoter (NG2:GCaMP6) specific for pericytes (arrowheads) and the graphs (c-d) illustrate that ischemia induces intracellular calcium increase in pericytes (arrows point to constrictions). The intensity of calcium signal increased over time, starting 40 min after arterial occlusion (c) (non-ischemic: n = 82 pericytes in four retinae; 40-min ischemia: n = 91 pericytes in three retinae; 60-min ischemia: n = 62 pericytes in three retinae; 60 min ischemia+CBX: n = 84 pericytes in five retinae; *P < 0.01, ANOVA and Tukey’s test). The intensity of calcium signal as well as the number of pericytes with high GCaMP6 fluorescence in ischemic retinae was reduced by CBX pre-treatment (c-d; non-ischemic: n = 4 retinae in C and 5 retinae in D; ischemia: n = 3 retinae; ischemia+CBX: n = 5 retinae; *P < 0.05, ANOVA and Tukey’s test). Most of the intensely calcium signal labeled pericytes were colocalized with microvascular constrictions (arrows in b). Scale bars in a-b = 10 μm
Fig. 7
Fig. 7
Ischemia induces pericyte contraction by multiple calcium influx pathways. a-f Intravitreal injection of calcium fluorophore, Fluo-4, to NG2-DsRed (a-b) or wild type (c-d) mice labeled only a small number of pericytes in non-ischemic retinae (c, e), whereas ischemia strikingly enhanced the Fluo-4 signal in pericytes (b, d-e) (non-ischemia: n = 7 retinae; ischemia: n = 3 retinae; P = 0.001, ANOVA and Dunnett’s test). Most of the intensely calcium signal labeled pericytes were colocalized with microvascular constrictions (arrows in d). Vessel contours in non-ischemic retinae were traced by following the week Fluo-4 labeling along the vessel wall. Intravitreal administration of gap junction blocker carbenoxolone (CBX) also reduced the number of pericytes labeled with Fluo-4 (e; ischemia: n = 3 retinae; CBX-treated ischemia: n = 4 retinae; P = 0.018, ANOVA and Dunnett’s test). f Ischemia-induced microvessel constrictions (n = 3 ischemic retinae) were prevented by pre-ischemic intravitreal administration of calcium antagonist amlodipine (n = 3 retinae; P = 0.001, ANOVA and Dunnett’s test), pericyte relaxant adenosine (n = 4 retinae; P = 0.01, ANOVA and Dunnett’s test), and gap junction blocker carbenoxolone (n = 4 retinae), whereas recanalized retinas had similar number of constrictions to the ischemic ones (3 recanalized retinae; P = 0.53, ANOVA and Dunnett’s test). g-i Intravitreal administration of CBX caused glia and their end-feet over the microvessels to become intensely Fluo-4-positive (inset and arrowheads in g), suggesting that blockade of gap junctions might have led to calcium rise within glia (h; non-ischemia: n = 7 retinae; ischemia: n = 3 retinae; CBX-treated ischemia: n = 4 retinae; P < 0.0001, ANOVA and Tukey’s test). i The specific connexin-43 blocking peptide also led to a massive increase of intracellular calcium of Müller cell-like structures and their end-feet during ischemia. Arrowheads and asterisks indicate pericyte soma and Muller end-feet surrounding capillaries, respectively. Scale bars in a-b = 10 μm; in c-d = 40 μm; in g = 20 μm; in i = 5 μm
Fig. 8
Fig. 8
Ischemia induces connexin-43 clustering in Müller end-feet. a-h Ischemia induced connexin-43 (Cx43, green, cf. a, c with d, f), clustering in Müller end-feet (identified with CRALBP, blue, cf. a with d) over pericytes (NG2-DsRed, red, cf. a, b with d, e). g 3D reconstruction displays the view of the selected area in d by using IMARIS software, and shows Cx43 connexons in Muller end-feet overlying pericytes 60 min after ischemia. All images were captured with optical sectioning followed by a 3D reconstruction. h Cx43 expression was much less in non-ischemic retinae and covered a small area on capillary surface in contrast to ischemic retina (h; non-ischemia: n = 18 pericytes in 3 retinae; ischemia: n = 15 pericytes in 4 retinae; P = 0.01, Student’s t-test). Scale bars in a-f = 5 μm; in g = 2 μm
Fig. 9
Fig. 9
Depletion of glycogen within glial end-feet surrounding microvessels contributes to microvessel constrictions. a-f When microvessel constrictions emerged 1 hour after ischemia (n = 3 retinae), glycogen levels (detected by PAS staining) in microvascular glial end-feet (microvessels were detected by lectin staining, a, d; arrows in b, c, e) were significantly decreased (d-e) compared to the non-ischemic eye (n = 3 retinae) (a-c). PAS staining was performed after treatment with dimedone to block aldehyde groups on non-glycogen substances. The number of microvessel constrictions was highly correlated with low levels of end-feet glycogen during ischemia (Pearson product-moment correlation, R2 = 0.992; P < 0.001) (f). g and h Inhibition of glycogen utilization by DAB exacerbated the ischemia-induced constrictions so that they appeared as early as 30 min after ischemia (arrows, g). h The number of microvascular constrictions significantly increased 30 min after ischemia in DAB treated-retinae compared to DAB treatment or 30-min ischemia alone (DAB: n = 3 retinae; 30 min-ischemia: n = 3 retinae; 30-min-ischemia and DAB: n = 3 retinae; P < 0.001, ANOVA and Tukey’s test). Scale bars in a-e, g = 10 μm

References

    1. Rouget C. Memoire sur le developpement, la structure et les proprietes physiologiques des capillaries sanguins et lymphatiques. Arch Physiol Norm Path. 1873;5:603–663.
    1. Herman IM, D’Amore PA. Microvascular pericytes contain muscle and nonmuscle actins. J Cell Biol. 1985;101:43–52. doi: 10.1083/jcb.101.1.43. - DOI - PMC - PubMed
    1. Alarcon-Martinez L, Yilmaz-Ozcan S, Yemisci M, Schallek J, Kılıç K, Can A, Di Polo A, Dalkara T (2018) Capillary pericytes express α-smooth muscle actin, which requires prevention of filamentous-actin depolymerization for detection. eLife 7. 10.7554/eLife.34861 - PMC - PubMed
    1. Hill RA, Tong L, Yuan P, Murikinati S, Gupta S, Grutzendler J. Regional blood flow in the Normal and ischemic brain is controlled by arteriolar smooth muscle cell contractility and not by capillary Pericytes. Neuron. 2015;87:95–110. doi: 10.1016/j.neuron.2015.06.001. - DOI - PMC - PubMed
    1. Fernández-Klett F, Offenhauser N, Dirnagl U, Priller J, Lindauer U. Pericytes in capillaries are contractile in vivo, but arterioles mediate functional hyperemia in the mouse brain. Proc Natl Acad Sci U S A. 2010;107:22290–22295. doi: 10.1073/pnas.1011321108. - DOI - PMC - PubMed

Publication types

MeSH terms

LinkOut - more resources