

Development of Zinc-Specific iCEST MRI as an Imaging Biomarker for Prostate Cancer
- PMID: 31430007
- PMCID: PMC7261412
- DOI: 10.1002/anie.201909429
Development of Zinc-Specific iCEST MRI as an Imaging Biomarker for Prostate Cancer
Abstract
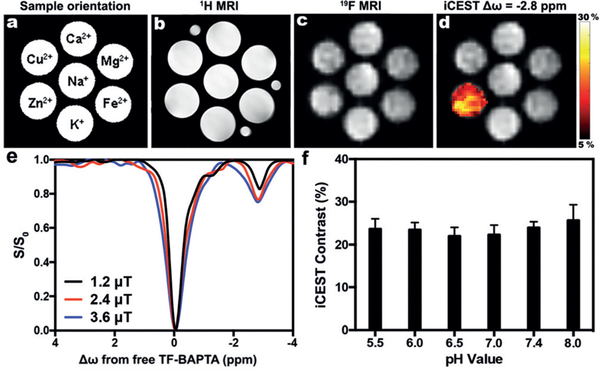
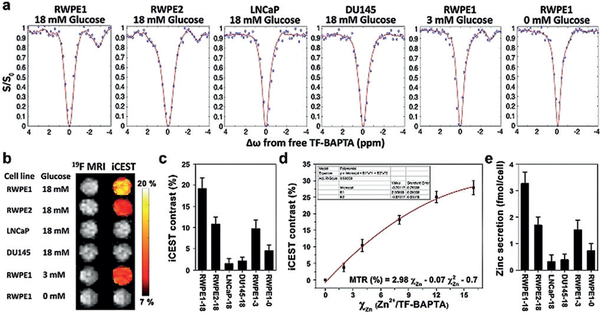
The healthy prostate contains the highest concentration of mobile zinc in the body. As this level decreases dramatically during the initial development of prostate cancer, in vivo detection of prostate zinc content may be applied for diagnosis of prostate cancer. Using 19 F ion chemical exchange saturation transfer magnetic resonance imaging (iCEST MRI) and TF-BAPTA as a fluorinated Zn-binding probe with micromolar sensitivity, we show that iCEST MRI is able to differentiate between normal and malignant prostate cells with a 10-fold difference in contrast following glucose-stimulated zinc secretion in vitro. The iCEST signal decreased in normal prostate cells upon downregulation of the ZIP1 zinc transporter. In vivo, using an orthotopic prostate cancer mouse model and a transgenic adenocarcinoma of the mouse prostate (TRAMP) model, a gradual decrease of >300 % in iCEST contrast following the transition of normal prostate epithelial cells to cancer cells was detected.
Keywords: MRI; imaging agents; prostate cancer; zinc.
© 2019 Wiley-VCH Verlag GmbH & Co. KGaA, Weinheim.
Conflict of interest statement
Conflict of interest
The authors declare no conflict of interest.
Figures


Similar articles
-
Zinc-sensitive MRI contrast agent detects differential release of Zn(II) ions from the healthy vs. malignant mouse prostate.Proc Natl Acad Sci U S A. 2016 Sep 13;113(37):E5464-71. doi: 10.1073/pnas.1609450113. Epub 2016 Aug 25. Proc Natl Acad Sci U S A. 2016. PMID: 27562169 Free PMC article.
-
Inositol hexaphosphate inhibits tumor growth, vascularity, and metabolism in TRAMP mice: a multiparametric magnetic resonance study.Cancer Prev Res (Phila). 2013 Jan;6(1):40-50. doi: 10.1158/1940-6207.CAPR-12-0387. Epub 2012 Dec 4. Cancer Prev Res (Phila). 2013. PMID: 23213071 Free PMC article.
-
Human prostate cancer ZIP1/zinc/citrate genetic/metabolic relationship in the TRAMP prostate cancer animal model.Cancer Biol Ther. 2011 Dec 15;12(12):1078-84. doi: 10.4161/cbt.12.12.18367. Epub 2011 Dec 15. Cancer Biol Ther. 2011. PMID: 22156800 Free PMC article.
-
Putative molecular signatures for the imaging of prostate cancer.Expert Rev Mol Diagn. 2010 Jan;10(1):65-74. doi: 10.1586/erm.09.73. Expert Rev Mol Diagn. 2010. PMID: 20014923 Review.
-
Fluorinated MRI contrast agents and their versatile applications in the biomedical field.Future Med Chem. 2019 May;11(10):1157-1175. doi: 10.4155/fmc-2018-0463. Future Med Chem. 2019. PMID: 31280670 Review.
Cited by
-
Rational Ligand Design Enables pH Control over Aqueous Iron Magnetostructural Dynamics and Relaxometric Properties.Inorg Chem. 2020 Dec 7;59(23):17712-17721. doi: 10.1021/acs.inorgchem.0c02923. Epub 2020 Nov 20. Inorg Chem. 2020. PMID: 33216537 Free PMC article.
-
A Reactive and Specific Sensor for Activity-Based 19F-MRI Sensing of Zn2.ACS Sens. 2024 Nov 22;9(11):5770-5775. doi: 10.1021/acssensors.4c01895. Epub 2024 Oct 24. ACS Sens. 2024. PMID: 39445901 Free PMC article.
-
A Semisynthetic Bioluminescence Sensor for Ratiometric Imaging of Metal Ions In Vivo Using DNAzymes Conjugated to An Engineered Nano-Luciferase.Angew Chem Int Ed Engl. 2023 Sep 11;62(37):e202308086. doi: 10.1002/anie.202308086. Epub 2023 Aug 7. Angew Chem Int Ed Engl. 2023. PMID: 37548922 Free PMC article.
-
Data-driven translational prostate cancer research: from biomarker discovery to clinical decision.J Transl Med. 2020 Mar 7;18(1):119. doi: 10.1186/s12967-020-02281-4. J Transl Med. 2020. PMID: 32143723 Free PMC article. Review.
-
PDGFB-targeted functional MRI nanoswitch for activatable T1-T2 dual-modal ultra-sensitive diagnosis of cancer.J Nanobiotechnology. 2023 Jan 6;21(1):9. doi: 10.1186/s12951-023-01769-7. J Nanobiotechnology. 2023. PMID: 36609374 Free PMC article.
References
Publication types
MeSH terms
Substances
Grants and funding
LinkOut - more resources
Full Text Sources
Medical
Research Materials
Miscellaneous
