. 2019 Dec 2;129(12):5187-5203.
doi: 10.1172/JCI130126.

Salt-inducible kinases dictate parathyroid hormone 1 receptor action in bone development and remodeling

Affiliations

Salt-inducible kinases dictate parathyroid hormone 1 receptor action in bone development and remodeling

Shigeki Nishimori et al. J Clin Invest. .

Abstract

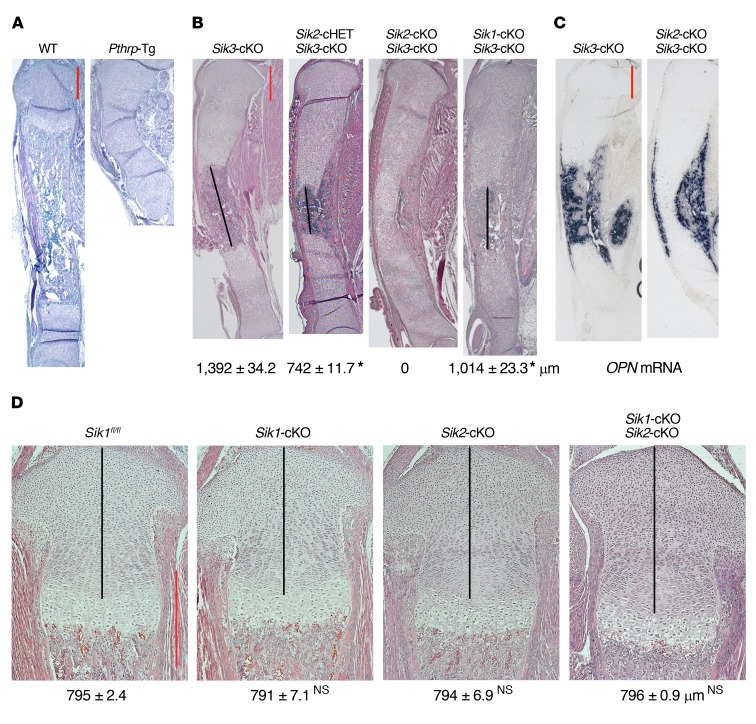
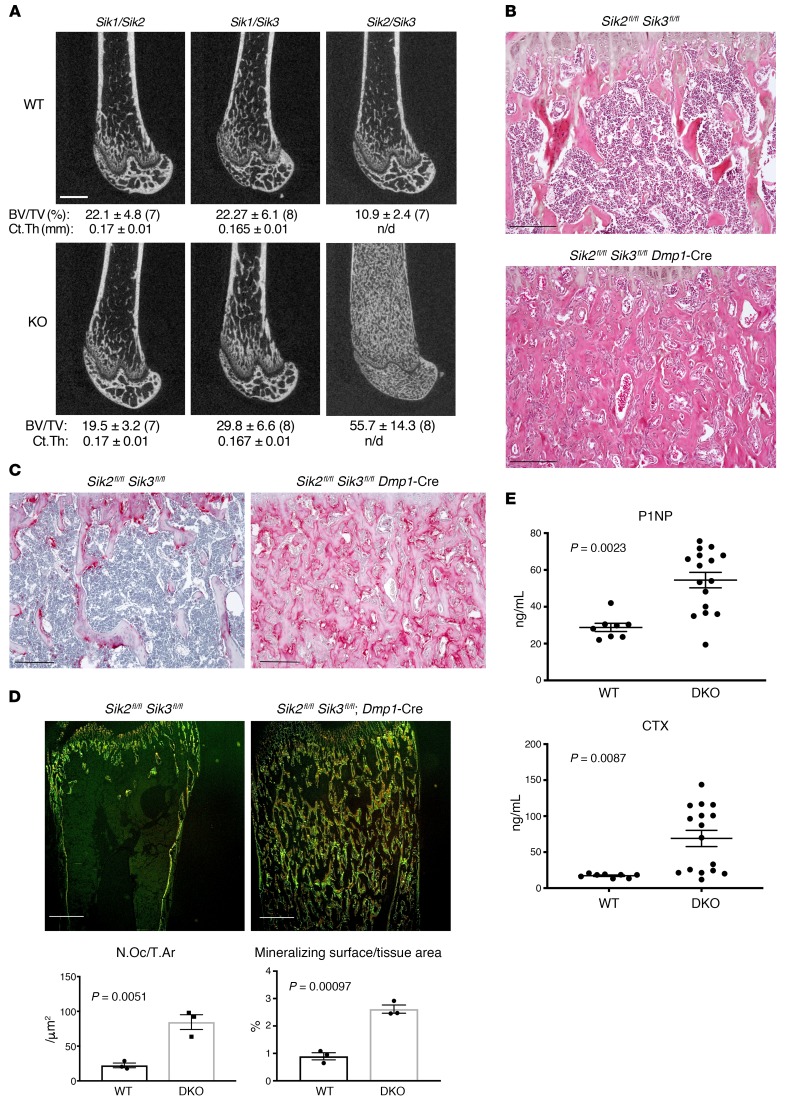
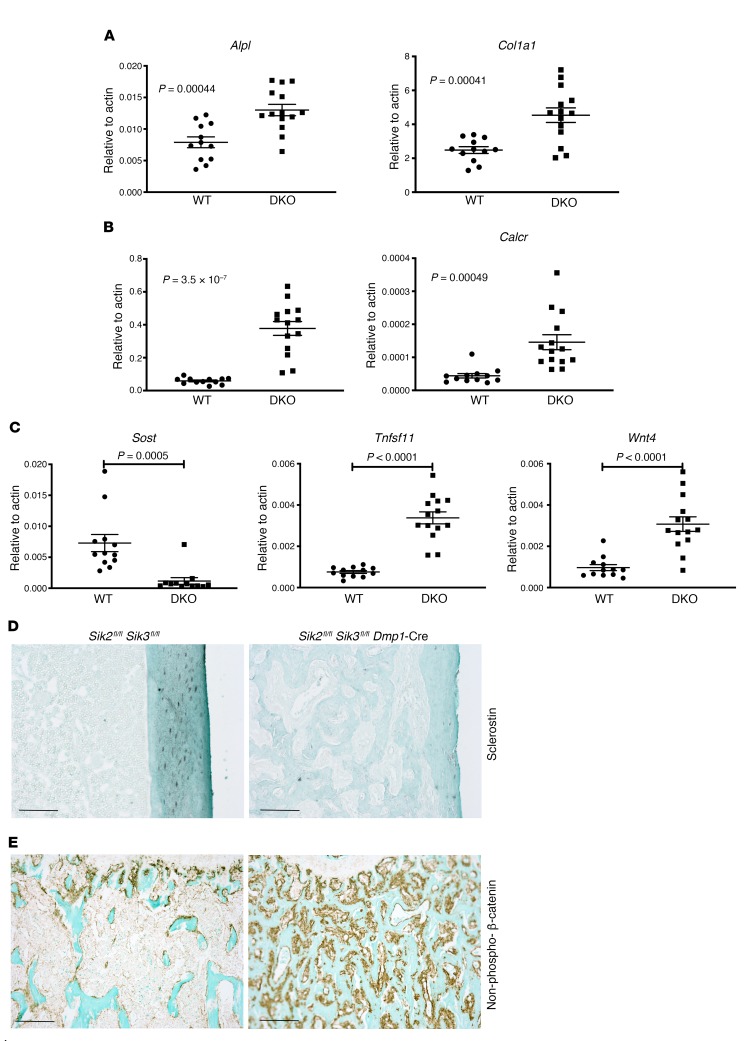
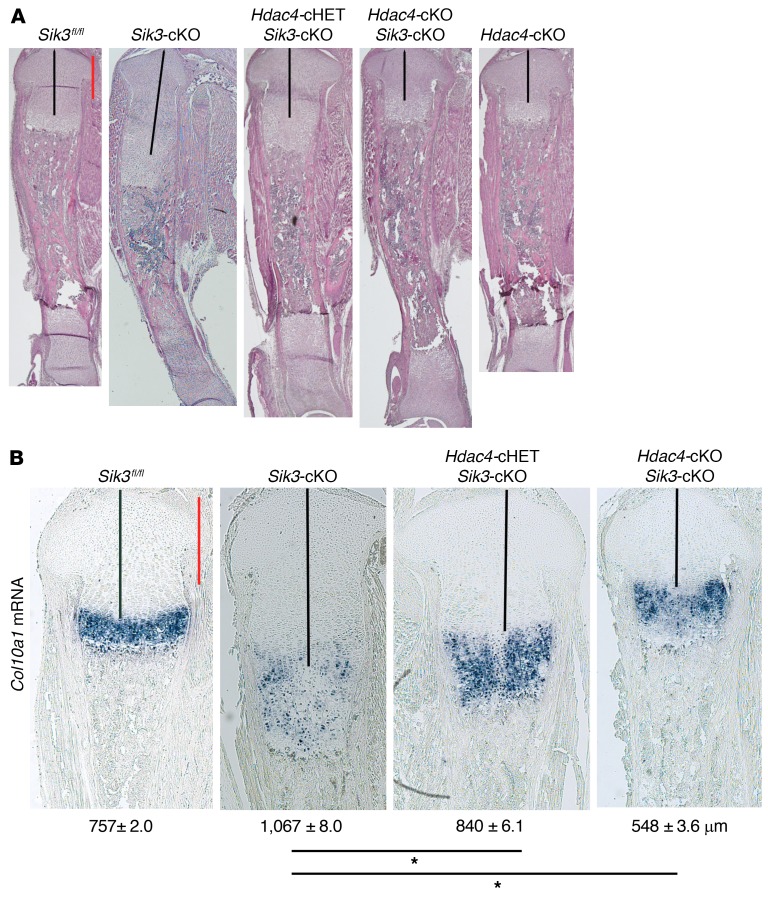
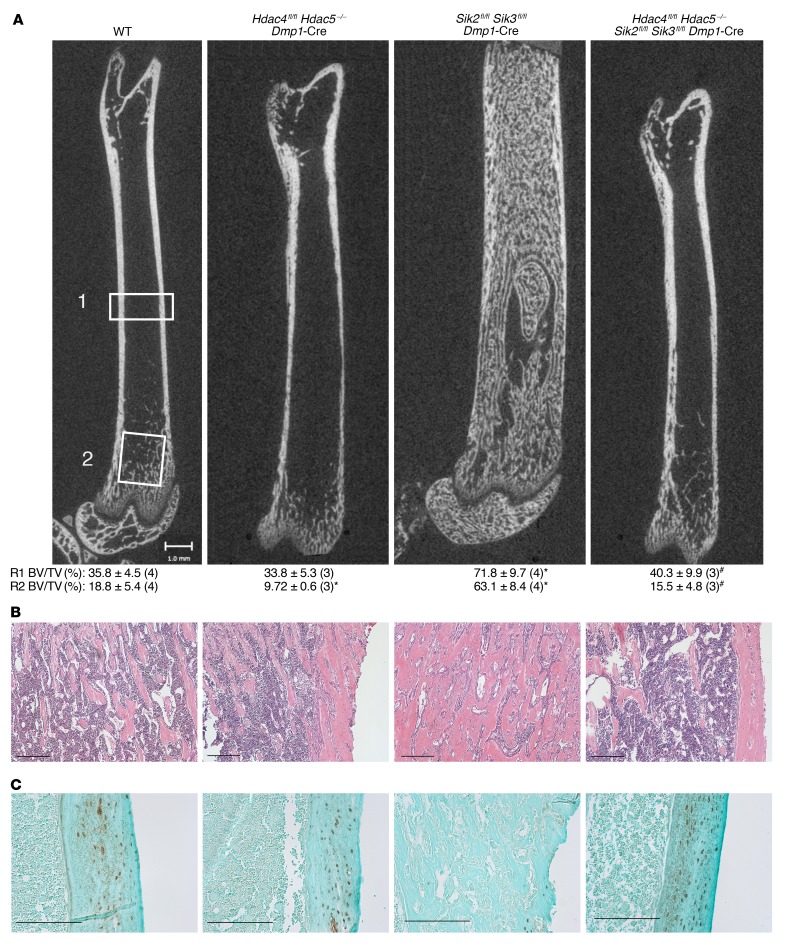
The parathyroid hormone 1 receptor (PTH1R) mediates the biologic actions of parathyroid hormone (PTH) and parathyroid hormone-related protein (PTHrP). Here, we showed that salt-inducible kinases (SIKs) are key kinases that control the skeletal actions downstream of PTH1R and that this GPCR, when activated, inhibited cellular SIK activity. Sik gene deletion led to phenotypic changes that were remarkably similar to models of increased PTH1R signaling. In growth plate chondrocytes, PTHrP inhibited SIK3, and ablation of this kinase in proliferating chondrocytes rescued perinatal lethality of PTHrP-null mice. Combined deletion of Sik2 and Sik3 in osteoblasts and osteocytes led to a dramatic increase in bone mass that closely resembled the skeletal and molecular phenotypes observed when these bone cells express a constitutively active PTH1R that causes Jansen's metaphyseal chondrodysplasia. Finally, genetic evidence demonstrated that class IIa histone deacetylases were key PTH1R-regulated SIK substrates in both chondrocytes and osteocytes. Taken together, our findings establish that SIK inhibition is central to PTH1R action in bone development and remodeling. Furthermore, this work highlights the key role of cAMP-regulated SIKs downstream of GPCR action.

Keywords: Bone Biology; Bone development; Bone disease; Endocrinology; Osteoclast/osteoblast biology.


Conflict of interest statement

Conflict of interest: MNW and HMK are coinventors on a pending patent (US patent application 16/333,546) regarding the use of SIK inhibitors for osteoporosis. MNW and TJG receive research support from Radius Health. MNW and HMK receive research support from Galapagos NV.

Figures

Figure 1
Figure 1. Sik3 deletion rescues perinatal lethality of Pthrp-deficient mice.
(A) Primary rib chondrocytes isolated from newborn WT mice were treated with vehicle or PTH (1–34, 100 nM) for 30 minutes, followed by immunoblotting as indicated. Phosphorylated HDAC4-Ser245 (p-HDAC4-Ser245), p-HDAC5-Ser250, and p-HDAC7-Ser178 represent the residues in mouse HDAC4 protein. Here, contemporaneous immunoblots were run in parallel. This experiment was performed twice, and representative results are shown. (B, top) H&E staining of proximal tibia at birth (original magnification, ×100) demonstrates that the lethal phenotype of the Pthrp-KO mouse is rescued by Sik3 gene deletion. Each mouse genotype shown is defined as follows: Sik3fl/+, Pthrp-KO (universal Pthrp–/–), Sik3-cHET (Sik3fl/+ Col2a1-Cre), Sik3-cKO Pthrp-KO (Sik3fl/fl Pthrp–/– Col2a1-Cre), and Sik3-cKO (Sik3fl/fl Col2a1-Cre). Numbers represent the average length of the proliferating chondrocyte region (black lines) (mean ± SEM, n = 3, biological triplicates; we measured the average length using 6–9 sections per mouse). *P < 0.01, **P < 0.001 by 1-way ANOVA followed by Dunnett’s test for multiple comparisons, when the Pthrp-KO measurement is control. (B, bottom) Col10a1 mRNA in situ hybridization of the anterior rib cage at birth (original magnification, ×40). Abnormal Col10a1 mRNA expression in the Pthrp-KO mice is reduced or absent with combined Sik3 gene deletion (red arrowheads). Normal Col10a1 mRNA expression in the sternum is missing in the Pthrp and Sik3 double-KO mouse and the Sik3-KO mouse (black arrowheads). S indicates the lower end of the sternum. (C) H&E staining of proximal tibia (top) and anterior rib cage (bottom) at P26 (original magnification, ×40) from surviving postnatal mice. Bone formation is severely affected in the Sik3 and Pthrp double-KO mouse and the Sik3-cKO mouse: secondary ossification center (black arrowheads in the top panels) and bone formation in the sternum (black arrowheads in the bottom panels) are missing. Abnormal chondrocyte hypertrophy in the anterior rib is not seen in the Sik3 and Pthrp double-KO mouse (red arrowheads). Scale bars (red lines): 500 μm.
Figure 2
Figure 2. SIK1 and SIK2 control chondrocyte hypertrophy in addition to SIK3.
(A and B) H&E staining of whole tibia at birth (original magnification, ×20) shows that additional homozygous deletion of Sik1 or Sik2 in the Sik3-cKO mouse delays chondrocyte hypertrophy. Each mouse genotype shown is defined as follows: Sik3-cKO (Sik3fl/fl Col2a1-Cre), Sik2-cHET Sik3-cKO (Sik2fl/+ Sik3fl/fl Col2a1-Cre), Sik2-cKO Sik3-cKO (Sik2fl/fl Sik3fl/fl Col2a1-Cre), Sik1-cKO Sik3-cKO (Sik1fl/fl Sik3fl/fl Col2a1-Cre). Numbers represent average length of the bone region between proximal and distal growth plates (black lines) (mean ± SEM, n = 3, biological triplicates; we measured the average length using 6–9 sections for each mouse). *P < 0.001 by 1-way ANOVA followed by Dunnett’s test, when the Sik3-cKO measurement is control. P values less than 0.05 were considered significant. (C) In situ hybridization for osteopontin (OPN) mRNA on the whole tibia at birth (original magnification, ×20). (D) H&E staining of proximal tibial growth plate at birth (original magnification, ×100). Numbers represent the average length of the proliferating chondrocyte region (black lines) (mean ± SEM, n = 3, biological triplicates; we measured the average length using 6–9 sections for each mouse). By 1-way ANOVA followed by Dunnett’s test when the corresponding WT (Sik1fl/fl) measurement is control, we found no significant (NS) differences by knocking out Sik1 and/or Sik2. P values less than 0.05 were considered significant. SIK3 is the major mediator. SIK3 alone can exhibit normal phenotype without SIK1 and SIK2. Scale bars (red lines): 500 μm.
Figure 3
Figure 3. Combined SIK2/3 deletion in osteoblasts and osteocytes causes high bone mass with accelerated bone turnover.
(A) Representative femur micro-CT images from littermate control (top) and compound SIK mutant (bottom) 8-week-old male mice of the indicated genotypes. Mean trabecular bone volume fraction (± SD) in the distal metaphysis (BV/TV) is listed below each representative image, with sample size analyzed of each group following in parentheses. Below trabecular BV/TV, the midshaft cortical thickness (Ct.Th) is listed. All WT mice studied bear the indicated loxP-flanked allele but are negative for the Dmp1-Cre transgene (which on its own does not cause a discernible skeletal phenotype). n/d, not determined. Scale bar: 1 mm. (B) H&E-stained proximal tibia histology from 8-week-old WT and SIK2/3 double-mutant mice from A shown at ×100 original magnification (results shown are representative of n = 6 mice per group). (C) TRAP-stained (pink) proximal tibia histology from WT and SIK2/3 double-mutant mice. (D) Top: WT and SIK2/3 double-mutant mice were labeled with calcein at P26, demeclocycline at P27, then sacrificed 1 day later for dynamic histomorphometry on non-decalcified, plastic-embedded sections. Representative images at ×4 original magnification showing fluorescent signals from dual calcein/demeclocycline labeling are shown; scale bars: 500 μm. Bottom: Quantification of osteoclast and trabecular mineralizing surface (normalized to tissue area) is shown; n = 3 mice per genotype were analyzed. (E) Fasting serum from 8-week-old WT (n = 8) and SIK2/3 double-mutant (DKO, n = 16) mice was collected and analyzed for P1NP (bone formation marker) and CTX (bone resorption marker). Student’s t tests were used for comparison between WT and SIK2/3-DKO mice, with P values listed in the figure panels. Scale bars: 100 μm for all histology panels in this figure unless otherwise indicated. See also Supplemental Figures 1–6.
Figure 4
Figure 4. Molecular correlates of high bone mass phenotype in Sik2fl/fl Sik3fl/fl Dmp1-Cre mice.
(AC) Marrow-flushed cortical bone RNA was isolated from WT (n = 12) and SIK2/3 mutant (n = 14) 6-week-old mice, followed by quantitative reverse transcriptase PCR analysis for the indicated osteoblast marker (A), osteoclast marker (B), and PTH/SIK inhibitor–responsive genes (C). Student’s t tests were used for comparison between WT and Sik2/3-DKO mice, with P values listed in the figure panels. (D) Sclerostin immunohistochemistry (brown; original magnification, ×100) from WT and Sik2fl/fl Sik3fl/fl Dmp1-Cre mice. Osteocytes in mutant trabecular and cortical bone stain poorly for sclerostin. (E) Immunohistochemistry for nonphosphorylated (S33/S37/T41) β-catenin in the primary and secondary spongiosa. Immunostaining results show representative data from n = 5 mice per genotype. Scale bars: 100 μm for all panels in this figure.
Figure 5
Figure 5. Global molecular concordance between Sik2fl/fl Sik3fl/fl Dmp1-Cre and C1HR mice.
(A) Left: H&E-stained images (original magnification, ×100) in the primary and secondary spongiosa of 6-week-old Col1a1-PTH1RH223R (C1HR) mice showing increased bone mass and increased marrow stromal cells. Middle: TRAP-stained images (original magnification, ×20) revealing increased osteoclasts on trabecular surfaces of C1HR mice. Right: Immunostaining for activated β-catenin reveals increased WNT pathway activity in C1HR animals. See Figure 3, B and C, and Figure 4E for similarities to Sik2fl/fl Sik3fl/fl Dmp1-Cre mice. Scale bars: 100 μm for left and right panels, 1 mm for middle panels. (B) RNA-Seq was performed on bone RNA isolated from Sik2fl/fl Sik3fl/fl Dmp1-Cre mice (n = 6) with n = 8 littermate controls, and C1HR mice (n = 12) with n = 11 littermate controls. Volcano plots show the relationship between fold change and statistical significance across these 2 data sets. (C) Venn diagram analysis of lists of differentially expressed genes (DEGs) (log2 FC > 2, FDR < 0.05) between the 2 comparisons. Hypergeometric P values for all overlap analyses are less than 0.05. (D) Heatmap showing extensive coregulation of gene expression in SIK2/3 mutant and C1HR mice. Each row represents a distinct DEG (encompassing all genes found in the first Venn diagram in C), and each column represents a mouse of the indicated genotype. The log2 fold change of each gene is expressed versus the mean of the control mice. (E) Scatterplot demonstrating extensive coregulation between SIK2/3 mutants and C1HR mice. Each dot represents the average log2 fold change for all genes detected by RNA-Seq comparing mutant versus control. Linear regression analysis between the 2 data sets reveals P < 0.0001, slope = 0.9112, R2 = 0.5914. (F) Similar scatterplot demonstrating relative lack of concordance between effects of SIK2/3 deletion in osteoblasts/osteocytes and effects of 2 weeks of sclerostin antibody treatment. Linear regression analysis between the 2 data sets reveals P < 0.0001, slope = 0.1155, R2 = 0.051. See also Supplemental Figures 6–8.
Figure 6
Figure 6. Class IIa HDACs are key downstream mediators of PTH1R/SIK action in the growth plate.
(A) H&E staining of the whole tibia at birth (original magnification, ×20) reveals that the expanded growth plate in the Sik3-cKO mouse is abrogated when the Hdac4 gene is simultaneously deleted. Each mouse genotype shown is defined as follows: Sik3fl/fl, Sik3-cKO (Sik3fl/fl Col2a1-Cre), Hdac4-cHET Sik3-cKO (Hdac4fl/+ Sik3fl/fl Col2a1-Cre), Hdac4-cKO Sik3-cKO (Hdac4fl/fl Sik3fl/fl Col2a1-Cre), Hdac4-cKO (Hdac4fl/fl Col2a1-Cre). (B) In situ hybridization for Col10a1 mRNA on the proximal tibial growth plate at birth (original magnification, ×40). Numbers represent the average length of the proliferating chondrocyte region (black lines) (mean ± SEM, n = 3, biological triplicates; we measured the average length using 6–9 sections for each mouse). *P < 0.001 by 1-way ANOVA followed by Dunnett’s test, when the Sik3-cKO measurement is control. P values less than 0.05 were considered significant. Scale bars (red lines): 500 µm.
Figure 7
Figure 7. Class IIa HDACs are key downstream mediators of PTH1R/SIK action in osteoblasts/osteocytes.
(A) Femurs from 6-week-old mice of the indicated genotypes were analyzed by micro-CT. Full-length images are representative of at least n = 3 mice per genotype; littermate controls were used for all experiments. Mean R1 (midshaft cortical) bone volume fraction (BV/TV, determined from region “1” above including cortical bone) and R2 (trabecular) bone volume fraction (BV/TV, determined from region “2” above excluding cortical bone) (± SD) are shown for each genotype, with sample size analyzed in parentheses. *P < 0.05 vs. WT, #P < 0.05 vs. Sik2/3-DKO. For R1 midshaft whole bone BV/TV comparisons: WT vs. Sik2/3-DKO, P = 0.00053; Sik2/3-DKO vs. Sik2/3 Hdac4/5 quadruple-KO, P = 0.0083. For R2 trabecular BV/TV comparisons: WT vs. Hdac4/5-DKO, P = 0.037; WT vs. Sik2/3-DKO, P = 0.000114; Sik2/3-DKO vs. Sik2/3 Hdac4/5 quadruple-KO, P = 0.000336. One-way ANOVA followed by Dunnett’s multiple-comparisons test was used to determine P values. (B) Representative H&E stain (sample size analyzed of each group is shown in A) of the primary and secondary spongiosa in the proximal tibia at ×100 original magnification. (C) Sclerostin immunohistochemistry from sections in B shown at the level of midshaft cortical bone. Sclerostin immunoreactivity levels are high in HDAC4/5-deficient mice, low in Sik2fl/fl Sik3fl/fl Dmp1-Cre mice, and high in compound HDAC4/5 SIK2/3 mutants. Scale bars: 100 μm for histology panels and 1 mm for micro-CT panels.

References

    1. Gardella T, Jüppner H, Bringhurst F, Potts J Jr. Receptors for parathyroid hormone (PTH) and PTH-related protein. In: Bilezikian J, Raisz L, Martin T, eds. Principles of Bone Biology. 3rd ed. Amsterdam, Netherlands: Elsevier; 2008:555–576.
    1. Bergwitz C, Jüppner H. Regulation of phosphate homeostasis by PTH, vitamin D, and FGF23. Annu Rev Med. 2010;61:91–104. doi: 10.1146/annurev.med.051308.111339. - DOI - PMC - PubMed
    1. de Crombrugghe B, Lefebvre V, Nakashima K. Regulatory mechanisms in the pathways of cartilage and bone formation. Curr Opin Cell Biol. 2001;13(6):721–727. doi: 10.1016/S0955-0674(00)00276-3. - DOI - PubMed
    1. Kronenberg HM. Developmental regulation of the growth plate. Nature. 2003;423(6937):332–336. doi: 10.1038/nature01657. - DOI - PubMed
    1. Wein MN, Kronenberg HM. Regulation of bone remodeling by parathyroid hormone. Cold Spring Harb Perspect Med. 2018;8(8):a031237. doi: 10.1101/cshperspect.a031237. - DOI - PMC - PubMed

Publication types

MeSH terms