. 2019 Nov 15:202:116106.
doi: 10.1016/j.neuroimage.2019.116106. Epub 2019 Aug 17.

Model-based Bayesian inference of brain oxygenation using quantitative BOLD

Affiliations

Model-based Bayesian inference of brain oxygenation using quantitative BOLD

Matthew T Cherukara et al. Neuroimage. .

Abstract

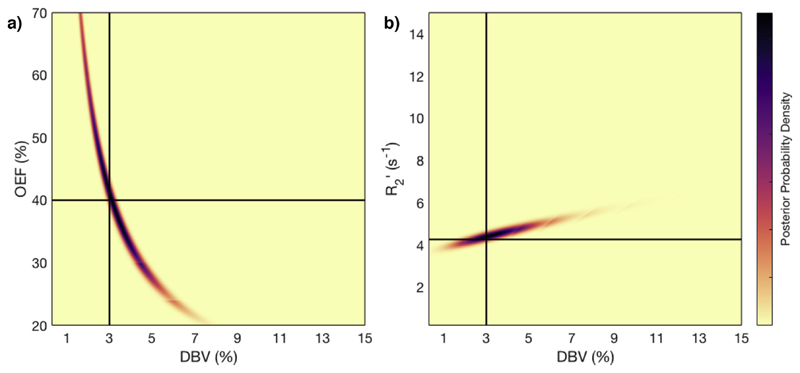
Streamlined Quantitative BOLD (sqBOLD) is an MR technique that can non-invasively measure physiological parameters including Oxygen Extraction Fraction (OEF) and deoxygenated blood volume (DBV) in the brain. Current sqBOLD methodology rely on fitting a linear model to log-transformed data acquired using an Asymmetric Spin Echo (ASE) pulse sequence. In this paper, a non-linear model implemented in a Bayesian framework was used to fit physiological parameters to ASE data. This model makes use of the full range of available ASE data, and incorporates the signal contribution from venous blood, which was ignored in previous analyses. Simulated data are used to demonstrate the intrinsic difficulty in estimating OEF and DBV simultaneously, and the benefits of the proposed non-linear model are shown. In vivo data are used to show that this model improves parameter estimation when compared with literature values. The model and analysis framework can be extended in a number of ways, and can incorporate prior information from external sources, so it has the potential to further improve OEF estimation using sqBOLD.

Keywords: Asymmetric spin echo; Bayesian inference; Oxygen extraction fraction; Oxygen metabolism; Quantitative BOLD.


Figures

Fig. 1
Fig. 1
Results of grid-search posterior sampling on simulated ASE qBOLD data, with SNR 50. a) Posterior probability of OEF-DBV parameter pairs, with true (simulated) values shown as solid black lines. b) Posterior probability of R2-DBV pairs, using the same data. In the OEF-DBV model, there is a large area of collinearity, and the posterior density distribution does not have a Gaussian-like form. By contrast, the R2-DBV model has more separable parameters, and a distribution shape that can more easily be approximated by a multivariate normal distribution, which is a requirement for VB inference as implemented here.
Fig. 2
Fig. 2
Optimization of prior standard deviations σ0 based on error in parameter estimates on simulated data. a) The effect of priors on R2 error, which is not strongly affected by σ0, except at σ0(R2) ≤ 1. b) The effect of priors on DBV error, which diverges quickly at low σ0(R2), but is consistently at σ0(R2) ≥ 10. c) The effect of priors on OEF error, which was lowest for σ0(R2) > 1.
Fig. 3
Fig. 3
Error in parameter estimates of a) R2, b) DBV, and c) OEF as a function of SNR, for each model. Across all SNR levels, the least squares (LS) implementations of the 1C and 2C models performed poorly in estimating DBV and OEF. At SNRs below 100, the variational Bayesian (VB) implementations of the 1C and 2C models estimated OEF significantly (p < 0:001) more accurately than other models.
Fig. 4
Fig. 4
Example parameter maps for a single subject, showing estimated R2 (top), DBV (middle) and OEF (bottom), using the L model (first column), 1C model (second column), 1C model with spatial regularization (third column), 2C model (fourth column), and 2C model with spatial regularization (fourth column). For all parameters, the use of spatial regularization drastically reduces the number of bright voxels, where parameters were previously estimated as extreme values.
Fig. 5
Fig. 5
Group (N = 7) average grey matter estimates of a) R2, b) DBV, and c) OEF, with error bars indicating inter-subject standard deviation, for the L model, and 1C and 2C models; (s) indicates spatial regularization. Two-way ANOVA and pair-wise comparisons show that the 1C and 2C models produce similar R2 estimates as the L model, although the DBV estimates are different except in the non-regularized 1C model. The 1C and 2C models with spatial regularization produce estimates of OEF that are not statistically significantly different from those of the L model.

References

    1. An H, Lin W. Impact of intravascular signal on quantitative measures of cerebral oxygen extraction and blood volume under normo- and hypercapnic conditions using an asymmetric spin echo approach. Magn Reson Med. 2003;50:708–716. doi: 10.1002/mrm.10148. - DOI - PubMed
    1. Attias H. A variational Bayesian framework for graphical models. Adv Neural Inf Process Syst. 2000:209–215.
    1. Berman AJL, Pike GB. Transverse signal decay under the weak field approximation: theory and validation. Magn Reson Med. 2017;80(1):341–350. doi: 10.1002/mrm.27035. - DOI - PubMed
    1. Berman AJL, Mazerolle EL, MacDonald ME, Blockley NP, Luh WM, Pike GB. Gas-free calibrated fMRI with a correction for vessel-size sensitivity. Neuroimage. 2018;169:176–188. - PubMed
    1. Blockley NP, Griffeth VEM, Germuska MA, Bulte DP, Buxton RB. An analysis of the use of hyperoxia for measuring venous cerebral blood volume: comparison of the existing method with a new analysis approach. Neuroimage. 2013;72:33–40. - PMC - PubMed

Publication types