

doi: 10.2337/db19-0098.
Hypothesis: Role of Reduced Hepatic Insulin Clearance in the Pathogenesis of Type 2 Diabetes
Affiliations
- PMID: 31431441
- PMCID: PMC6702636
- DOI: 10.2337/db19-0098
Item in Clipboard
Hypothesis: Role of Reduced Hepatic Insulin Clearance in the Pathogenesis of Type 2 Diabetes
Diabetes.
2019 Sep.
Erratum in
-
Erratum. Hypothesis: Role of Reduced Hepatic Insulin Clearance in the Pathogenesis of Type 2 Diabetes. Diabetes 2019;68:1709-1716.Diabetes. 2019 Dec;68(12):2350. doi: 10.2337/db19-er12a. Epub 2019 Oct 9. Diabetes. 2019. PMID: 31597638 Free PMC article. No abstract available.
Abstract
There is wide variance among individuals in the fraction of insulin cleared by the liver (20% to 80%). Hepatic insulin clearance is 67% lower in African Americans than European Americans. Clearance is also lower in African American children 7-13 years of age. Lower hepatic insulin clearance will result in peripheral hyperinsulinemia: this exacerbates insulin resistance, which stresses the β-cells, possibly resulting in their ultimate failure and onset of type 2 diabetes. We hypothesize that lower insulin clearance can be a primary cause of type 2 diabetes in at-risk individuals.
© 2019 by the American Diabetes Association.
Figures
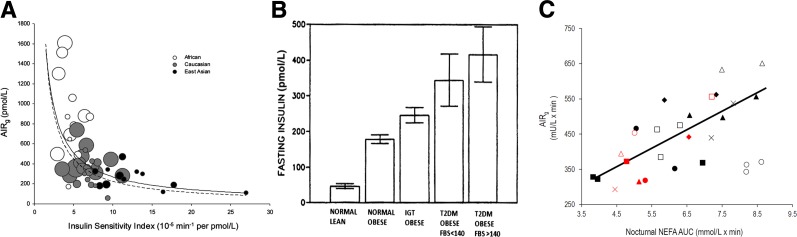
A: Ethnic differences in the relationship between insulin sensitivity and insulin response in normal glucose tolerance (NGT) cohorts. Scatter plot of insulin sensitivity vs. acute insulin response (AIRg) measured in NGT (healthy) African, Caucasian, and East Asian cohorts. Each circle represents one study cohort. Circle area is proportional to cohort sample size. The solid line is the curve calculated in the meta-analysis [ln(AIRg) = –0.915 × ln(SI) – 2.82]. The dashed line is the curve of Kahn et al. (17) describing healthy individuals who were primarily Caucasian [ln(AIRg) = –1.0 × ln(SI) – 3.80]. Adapted with permission from Kodama et al. (16). B: Fasting insulin may increase under conditions associated with the progression of diabetes. However, longitudinal data supporting this latter supposition are not available. FBS, fasting blood glucose. Adapted with permission from Pories et al. (19). C: Correlation between the nocturnal area under the curve (AUC) of nonesterified fatty acids (NEFA) and AIRg; n = 8. Individual animals are represented by the same geometrical shapes; gray shapes indicate week 8 when animals received nocturnal injections of GS-9667; P < 0.01. Adapted with permission from Broussard et al. (21).
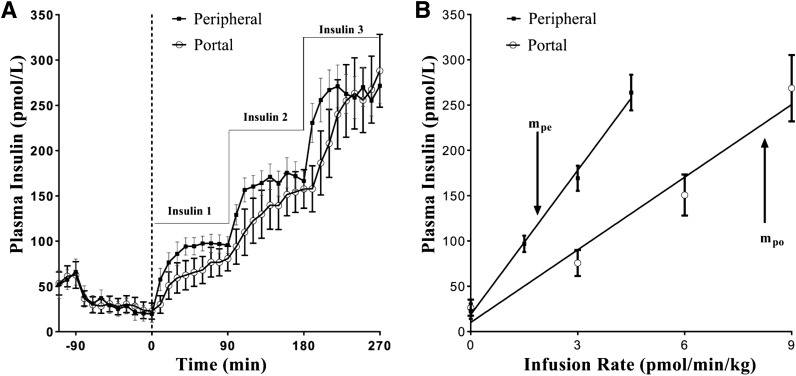
Paired portal/peripheral insulin infusion (PPII) clamp for measuring first-pass hepatic insulin extraction. A: Insulin profile during the PPII experiments. For portal infusion protocol (white circles), insulin 1 = 3.0 pmol ⋅ kg−1 ⋅ min−1, insulin 2 = 6.0 pmol ⋅ kg−1 ⋅ min−1, and insulin 3 = 9.0 pmol ⋅ kg−1 ⋅ min−1. For peripheral infusion protocol (black quares), insulin 1 = 1.5 pmol ⋅ kg−1 ⋅ min−1, insulin 2 = 3.0 pmol ⋅ kg−1 ⋅ min−1, and insulin 3 = 4.5 pmol ⋅ kg−1 ⋅ min−1. One-half of the portal infusion rates were used in the peripheral protocol for matching systemic concentrations. B: Infusion rate vs. steady-state plasma insulin concentrations. Correlation coefficient r for peripheral infusion vs. steady-state concentrations (black squares) was 0.99, and slope, mpe, was 53.1 kg ⋅ min−1 ⋅ L−1. For portal infusion vs. steady-state concentrations (white circles), r = 0.98 and slope, mpo, was 26.7 kg ⋅ min−1 ⋅ L−1. First-pass hepatic insulin extraction (%) = [1 − (mpo/ mpe)] ⋅ 100 = 50%. Each data point is a mean ± SE of n = 9. Adapted with permission from Asare-Bediako et al. (33).
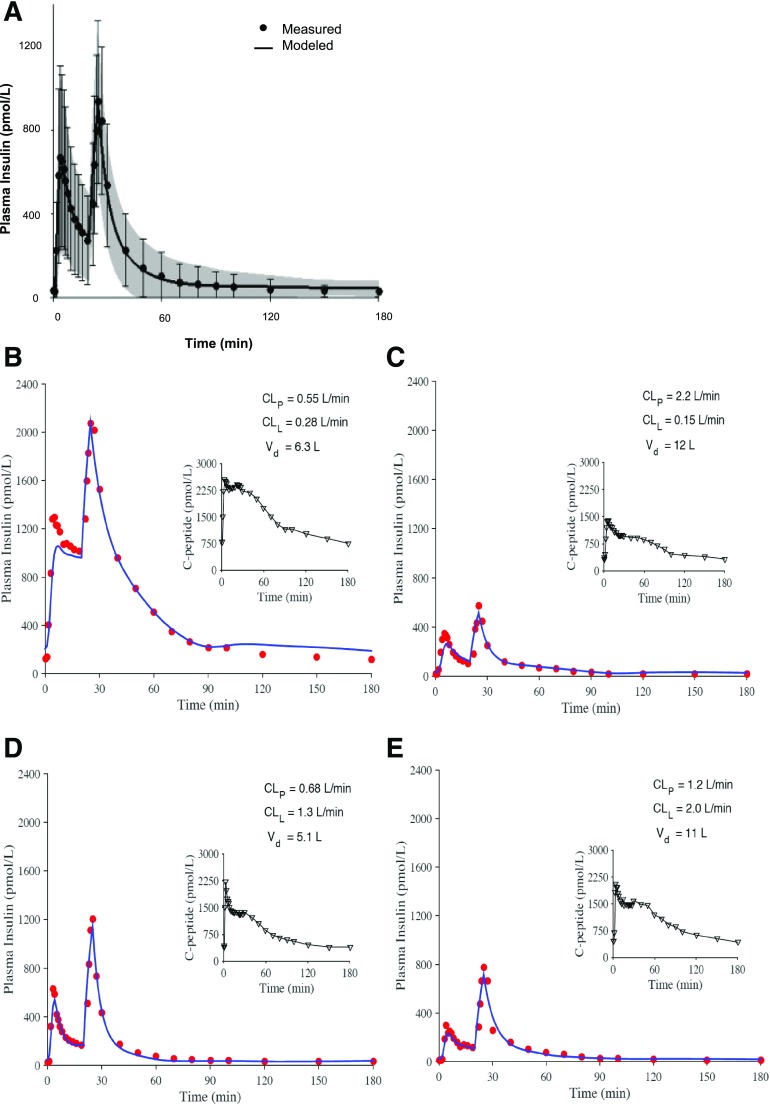
Comparison of modeled and measured insulin profiles. A: Mean ± SD for measured (dots and error bars) and modeled (line and shaded region) values. B–E: Profiles for four representative participants having different plasma insulin profiles and different parameter estimates for hepatic and peripheral clearance. Adapted with permission from Polidori et al. (34).
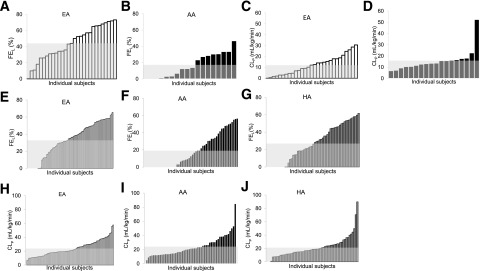
Distribution of hepatic insulin fraction (FEL) (A and B) and extrahepatic clearance individual indices (CLP) (C and D) in EAs and AAs, white and black bars, respectively, in ascending order, and average value (gray area). Adapted with permission from Piccinini et al. (38). Distribution of hepatic insulin fraction (FEL) (E–G) and extrahepatic clearance individual indices (CLP) (H–J) in EAs, AAs, and HAs, white, black, and dark gray bars, respectively, in ascending order, and average value (light gray area).
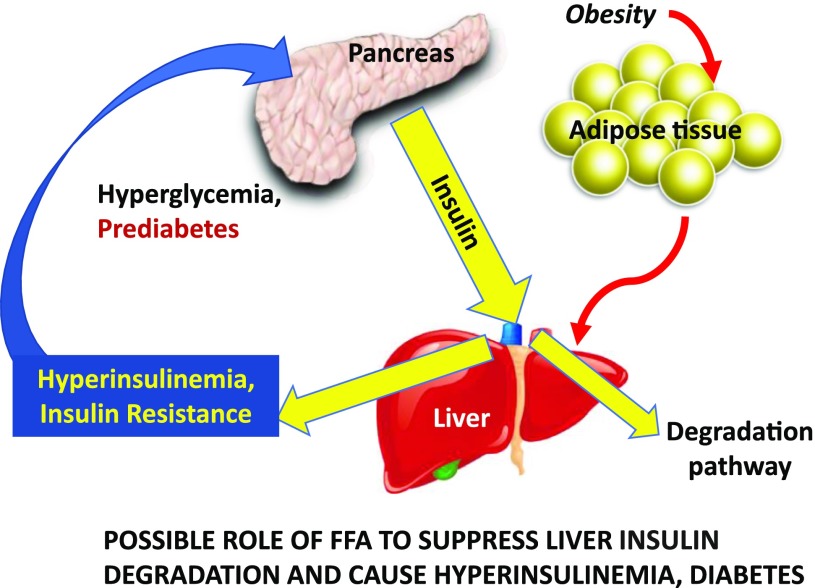
In some patients at risk for type 2 diabetes, liver insulin degradation has been shown to be suppressed (e.g., in AAs). Thus, a larger fraction of the secreted insulin reaches the systemic circulation. Hyperinsulinemia may then result in insulin resistance at muscle, stressing the β-cells, and at adipose tissue, resulting in lipolysis and inappropriately increased endogenous glucose production. Adapted with permission from Bergman et al. (48).
References
-
- Kahn CR. Banting Lecture. Insulin action, diabetogenes, and the cause of type II diabetes. Diabetes 1994;43:1066–1084 - PubMed
-
- Porte D Jr, Kahn SE. Mechanisms for hyperglycemia in type II diabetes mellitus: therapeutic implications for sulfonylurea treatment--an update. Am J Med 1991;90(6A):8S–14S - PubMed
-
- Weyer C, Hanson RL, Tataranni PA, Bogardus C, Pratley RE. A high fasting plasma insulin concentration predicts type 2 diabetes independent of insulin resistance: evidence for a pathogenic role of relative hyperinsulinemia. Diabetes 2000;49:2094–2101 - PubMed
-
- ter Horst KW, Gilijamse PW, Koopman KE, et al. Insulin resistance in obesity can be reliably identified from fasting plasma insulin. Int J Obes 2015;39:1703–1709 - PubMed
-
- Brüning JC, Michael MD, Winnay JN, et al. A muscle-specific insulin receptor knockout exhibits features of the metabolic syndrome of NIDDM without altering glucose tolerance. Mol Cell 1998;2:559–569 - PubMed
Publication types
MeSH terms
Substances
Grants and funding
LinkOut - more resources
Full Text Sources
Medical
