

Targeting Glycolysis through Inhibition of Lactate Dehydrogenase Impairs Tumor Growth in Preclinical Models of Ewing Sarcoma
- PMID: 31431459
- PMCID: PMC6774872
- DOI: 10.1158/0008-5472.CAN-19-0217
Targeting Glycolysis through Inhibition of Lactate Dehydrogenase Impairs Tumor Growth in Preclinical Models of Ewing Sarcoma
Abstract
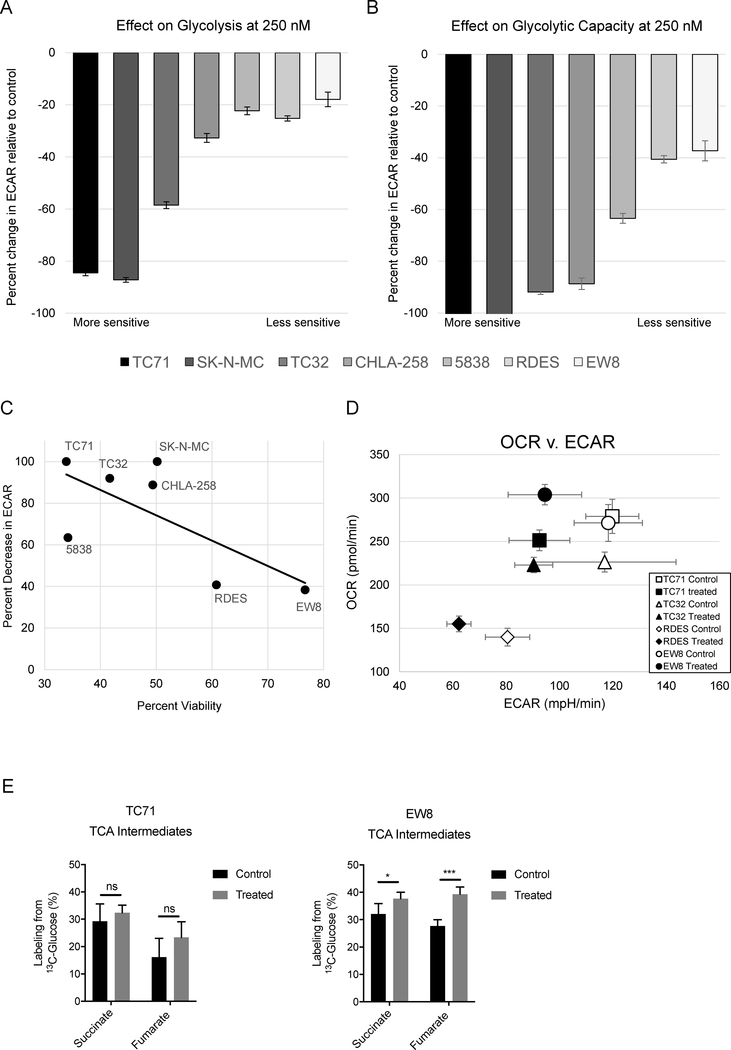
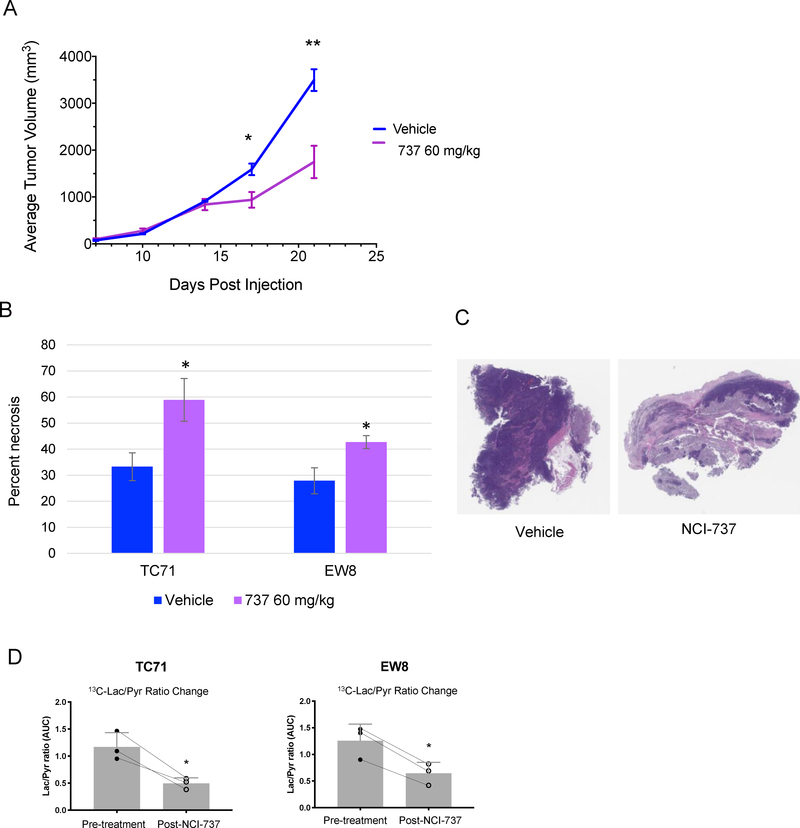
Altered cellular metabolism, including an increased dependence on aerobic glycolysis, is a hallmark of cancer. Despite the fact that this observation was first made nearly a century ago, effective therapeutic targeting of glycolysis in cancer has remained elusive. One potentially promising approach involves targeting the glycolytic enzyme lactate dehydrogenase (LDH), which is overexpressed and plays a critical role in several cancers. Here, we used a novel class of LDH inhibitors to demonstrate, for the first time, that Ewing sarcoma cells are exquisitely sensitive to inhibition of LDH. EWS-FLI1, the oncogenic driver of Ewing sarcoma, regulated LDH A (LDHA) expression. Genetic depletion of LDHA inhibited proliferation of Ewing sarcoma cells and induced apoptosis, phenocopying pharmacologic inhibition of LDH. LDH inhibitors affected Ewing sarcoma cell viability both in vitro and in vivo by reducing glycolysis. Intravenous administration of LDH inhibitors resulted in the greatest intratumoral drug accumulation, inducing tumor cell death and reducing tumor growth. The major dose-limiting toxicity observed was hemolysis, indicating that a narrow therapeutic window exists for these compounds. Taken together, these data suggest that targeting glycolysis through inhibition of LDH should be further investigated as a potential therapeutic approach for cancers such as Ewing sarcoma that exhibit oncogene-dependent expression of LDH and increased glycolysis. SIGNIFICANCE: LDHA is a pharmacologically tractable EWS-FLI1 transcriptional target that regulates the glycolytic dependence of Ewing sarcoma.
©2019 American Association for Cancer Research.
Conflict of interest statement
Figures


Similar articles
-
EWS-FLI1-regulated Serine Synthesis and Exogenous Serine are Necessary for Ewing Sarcoma Cellular Proliferation and Tumor Growth.Mol Cancer Ther. 2020 Jul;19(7):1520-1529. doi: 10.1158/1535-7163.MCT-19-0748. Epub 2020 May 5. Mol Cancer Ther. 2020. PMID: 32371575 Free PMC article.
-
BET bromodomain inhibitors suppress EWS-FLI1-dependent transcription and the IGF1 autocrine mechanism in Ewing sarcoma.Oncotarget. 2016 Jul 12;7(28):43504-43517. doi: 10.18632/oncotarget.9762. Oncotarget. 2016. PMID: 27259270 Free PMC article.
-
Targeting the epigenetic readers in Ewing sarcoma inhibits the oncogenic transcription factor EWS/Fli1.Oncotarget. 2016 Apr 26;7(17):24125-40. doi: 10.18632/oncotarget.8214. Oncotarget. 2016. PMID: 27006472 Free PMC article.
-
Dual targeting of EWS-FLI1 activity and the associated DNA damage response with trabectedin and SN38 synergistically inhibits Ewing sarcoma cell growth.Clin Cancer Res. 2014 Mar 1;20(5):1190-203. doi: 10.1158/1078-0432.CCR-13-0901. Epub 2013 Nov 25. Clin Cancer Res. 2014. PMID: 24277455 Free PMC article.
-
Therapeutic opportunities in Ewing sarcoma: EWS-FLI inhibition via LSD1 targeting.Oncotarget. 2016 Apr 5;7(14):17616-30. doi: 10.18632/oncotarget.7124. Oncotarget. 2016. PMID: 26848860 Free PMC article. Review.
Cited by
-
Efficacy and safety of alectinib in ALK-positive non-small cell lung cancer and blood markers for prognosis and efficacy: a retrospective cohort study.Transl Lung Cancer Res. 2022 Dec;11(12):2521-2538. doi: 10.21037/tlcr-22-857. Transl Lung Cancer Res. 2022. PMID: 36636415 Free PMC article.
-
FOXM1 regulates glycolysis in nasopharyngeal carcinoma cells through PDK1.J Cell Mol Med. 2022 Jul;26(13):3783-3796. doi: 10.1111/jcmm.17413. Epub 2022 Jun 3. J Cell Mol Med. 2022. PMID: 35656815 Free PMC article.
-
Lactate in Sarcoma Microenvironment: Much More than just a Waste Product.Cells. 2020 Feb 24;9(2):510. doi: 10.3390/cells9020510. Cells. 2020. PMID: 32102348 Free PMC article. Review.
-
High Pretreatment LDH Predicts Poor Prognosis in Hypopharyngeal Cancer.Front Oncol. 2021 Mar 11;11:641682. doi: 10.3389/fonc.2021.641682. eCollection 2021. Front Oncol. 2021. PMID: 33777804 Free PMC article.
-
Metabolism of immune cells in cancer.Nat Rev Cancer. 2020 Sep;20(9):516-531. doi: 10.1038/s41568-020-0273-y. Epub 2020 Jul 6. Nat Rev Cancer. 2020. PMID: 32632251 Free PMC article. Review.
References
-
- Koppenol WH, Bounds PL, Dang CV. Otto Warburg’s contributions to current concepts of cancer metabolism. Nature reviews Cancer. 2011;11(5):325–37. - PubMed
Publication types
MeSH terms
Substances
Grants and funding
LinkOut - more resources
Full Text Sources
Other Literature Sources
Miscellaneous
