. 2019 Sep 13;476(17):2499-2514.
doi: 10.1042/BCJ20190203.

RhoBTB1 interacts with ROCKs and inhibits invasion

Affiliations

RhoBTB1 interacts with ROCKs and inhibits invasion

Raquel B Haga et al. Biochem J. .

Abstract

RhoBTB1 is an atypical Rho GTPase with two BTB domains in addition to its Rho domain. Although most Rho GTPases regulate actin cytoskeletal dynamics, RhoBTB1 is not known to affect cell shape or motility. We report that RhoBTB1 depletion increases prostate cancer cell invasion and induces elongation in Matrigel, a phenotype similar to that induced by depletion of ROCK1 and ROCK2. We demonstrate that RhoBTB1 associates with ROCK1 and ROCK2 and its association with ROCK1 is via its Rho domain. The Rho domain binds to the coiled-coil region of ROCK1 close to its kinase domain. We identify two amino acids within the Rho domain that alter RhoBTB1 association with ROCK1. RhoBTB1 is a substrate for ROCK1, and mutation of putative phosphorylation sites reduces its association with Cullin3, a scaffold for ubiquitin ligases. We propose that RhoBTB1 suppresses cancer cell invasion through interacting with ROCKs, which in turn regulate its association with Cullin3. Via Cullin3, RhoBTB1 has the potential to affect protein degradation.

Keywords: Cullin3; Rho GTPases; Rho-kinases; RhoBTB; cell invasion; phosphorylation.


Conflict of interest statement

The Authors declare that there are no competing interests associated with the manuscript.

Figures
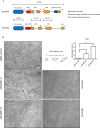
Figure 1.
Figure 1.. RhoBTB1 depletion affects the morphology of PC3 cells.
(A) Diagram showing RhoBTB1 and RhoBTB2 domains (amino acid numbering is for human proteins). Full-length human RhoBTB1 is 65.3% identical with human RhoBTB2. The Rho domain shows 94.3% identity while the BTB domains show 35.7% and 64.7% identity, respectively. (B) PC3 cells were transfected with siRNA oligos targeting RhoBTB1, RhoA or siRNA control. After 48 h, cells were embedded in Matrigel. Phase-contrast images were taken after 24 h. Images are representative of three independent experiments. Cells were scored based on their elongation: 0 = rounded morphology and 3 = elongated morphology. The graph shows quantification of cell elongation scores. Ten different fields from each condition were analyzed per experiment. Values represent mean ± SEM. * P < 0.05, **** P < 0.0001, compared with siRNA control, determined by one-way ANOVA analysis of variance followed by a Dunnett's multiple comparison. Scale bar = 100 µm.
Figure 2.
Figure 2.. RhoBTB1 depletion increases invasion of PC3 cells.
PC3 cells were transfected with siRNA control or siRNA oligos targeting RhoBTB1 (A) or ROCK1 and/or ROCK2 (B). After 48 h, cells were seeded on the top chamber of Matrigel-coated transwells in 0.1% FCS/RPMI. 1% FCS/RPMI was added to the bottom chamber to create a gradient. After 24 h, cells were fixed with 70% ethanol and stained with 0.2% crystal violet. Images are representative of four (A) or three (B) independent experiments. Graphs show relative invasion compared with siRNA control. Five different fields of each condition were analyzed per experiment. Values represent mean ± SEM. * P < 0.05, ** P < 0.01 compared with siRNA control, determined by one-way ANOVA analysis of variance followed by a Dunnett's multiple comparison.
Figure 3.
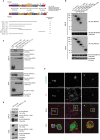
Figure 3.. ROCK1 interacts with RhoBTB1 via its HR1-like domain.
(A) Diagram showing ROCK1 and ROCK2 deletion mutants. (BD) COS7 cells were transfected with pEGFP or vector encoding GFP-RhoBTB1 and the indicated myc-epitope tagged ROCK1 and ROCK2 constructs or HA-ROCK2. After 24 h, cells were lysed and incubated with GFP-binding protein-coupled to agarose (GFP-trap). Total lysates (input) and immunoprecipitates (GFP-IP) were probed to show levels of myc-ROCK1 deletion mutants, myc-ROCK21–436, HA-ROCK2 and GFP-RhoBTB1. GAPDH is used as a loading control. (E) HeLa cells were transfected with vectors encoding GFP-RhoBTB1, myc-ROCK11–420, myc-ROCK11–540 and myc-ROCK1375–727. After 24 h, cells were fixed and stained with anti-myc epitope antibody and for nuclei (DAPI). Scale bar = 50 µm.
Figure 4.
Figure 4.. RhoBTB1 associates with ROCK1 through its Rho domain and mutation of E64 and K197 on RhoBTB1 affects this interaction.
(A) Alignment of Rho domain of RhoBTB1 and RhoA. (B-E) COS7 cells were transfected with (B) a vector encoding GFP-RhoBTB11–210 and the indicated myc-epitope tagged ROCK1 constructs, (C) empty pEGFP and vectors encoding myc-ROCK11–727, GFP-RhoBTB1, GFP-RhoBTB1 R/C/E (R60A/C62A/E64A), GFP-RhoBTB1E64A, GFP-RhoBTB1 E/K (E64A/K197A) and GFP-RhoBTB1 E/K/D (E64A/K197A/D198A), (D) empty pEGFP and vectors encoding myc-ROCK11–727, GFP-RhoBTB1, GFP-RhoBTB1K197A, GFP-RhoBTB1D198A, GFP-RhoBTB1 E/K (E64A/K197A) and (E) empty pEGFP, empty myc-pRK5 and vectors encoding myc-RhoBTB1 and GFP-RhoBTB1. After 24 h, cells were lysed and incubated with GFP-binding protein-coupled to agarose (GFP-trap) (BD) or anti-myc-agarose beads (E). Total lysates (input) and immunoprecipitates were probed to show levels of myc-ROCK1 mutants, myc-RhoBTB1, GFP-RhoBTB1, GFP-RhoBTB11–210 and GFP-RhoBTB1 mutants. GAPDH is used as a loading control. (C and D) The graph shows the quantification of the band density from three (C) or five (D) independent experiments. Band density of myc-ROCK11–727 (myc-IP) was normalized by GFP-RhoBTB1 constructs (GFP IP). All values were normalized to GFP-RhoBTB1 WT condition. Values represent mean ± SEM. ** P < 0.01, compared with GFP-RhoBTB1 WT, determined by one-way ANOVA analysis of variance followed by a Dunnett's multiple comparison. (F) A computational model of the Rho domain of RhoBTB1 (green) modeled by using as a template the crystal structure of RhoA (gray; PDB number 1S1C) in complex with Rho binding domain of ROCK1. RhoBTB1 amino acids E64 and K197 are highlighted in yellow.
Figure 5.
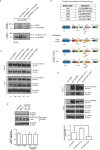
Figure 5.. ROCK1 phosphorylates RhoBTB1 and this phosphorylation alters the association of RhoBTB1 and Cullin3.
(A) COS7 cells were transfected with vectors encoding myc-RhoBTB1, myc-ROCK11–727 or myc-ROCK11–727 (K105A). After 24 h, cells were lysed and incubated with anti-myc-agarose beads. Immunoprecipitated lysates were combined as indicated (myc-RhoBTB1 alone, myc-RhoBTB1 and myc-ROCK11–727, myc-RhoBTB1 and myc-ROCK11–727 (K105A) (kinase-dead), and myc-RhoBTB1 and recombinant GST-ROCK1 17–535. Samples were incubated in a kinase buffer containing 32P-ATP for 30 min and then resolved in a 4–12% SDS-polyacrylamide gel. Bands show the phosphorylated proteins. Levels of myc-RhoBTB1, myc-ROCK11–727 and myc-ROCK11–727 (K105A) were analyzed in the total lysate (Input). (B) Table with sequence of potential phosphorylation sites on RhoBTB1 (PhosphoSite) and diagram showing the mutations on the RhoBTB1 sequence. (C and D) COS7 cells were transfected with (C) vectors encoding myc-tagged RhoBTB1, RhoBTB1S69A, RhoBTB1S480A, RhoBTB1T483A and RhoBTB1T398A and (D) empty pRK5-myc or vectors encoding myc-tagged RhoBTB1, RhoBTB1S3T1A and RhoBTB1S3T2A. After 24 h, cells were lysed and incubated with anti-myc-agarose beads. Total lysates (input) and immunoprecipitates (myc-IP) were probed to show levels of (C) myc-RhoBTB1, RhoBTB1S69A, RhoBTB1S480A, RhoBTB1T483A and RhoBTB1T398A and Cullin3, and (D) myc-RhoBTB1, RhoBTB1S3T1A, RhoBTB1S3T2A and Cullin3. The interaction between myc-RhoBTB1 and Cullin3; and myc-RhoBTB1 mutants and Cullin3, is shown in the immunoprecipitates (myc-IP). GAPDH was used as a loading control. (D) The graph shows the quantification of the band density from four independent experiments. Band density of Cullin3 (myc-IP) was normalized by myc-RhoBTB1 (myc-IP). All values were normalized to myc-RhoBTB1 condition. Values represent mean ± SEM. ** P < 0.01, compared with myc-RhoBTB1 WT, determined by one-way ANOVA analysis of variance followed by a Dunnett's multiple comparison. (E) MDA-MB-231 cells were treated with 1 µM or 2 µM of MLN4924 or DMSO as solvent control for 2 h. Cells were lysed and protein expression was analyzed by western blotting. GAPDH is used as a loading control. The graph shows the quantification of the band density of five independent experiments, normalized to GAPDH and relative to DMSO. All values were normalized to DMSO condition. Values represent mean ± SEM.
Figure 6.
Figure 6.. Model for RhoBTB1 interaction with ROCK1.
The diagram shows a possible model for the interaction between RhoBTB1 and ROCK1. RhoBTB1 consists of a Rho domain, a PRM, a tandem of 2 BTB domains, of which one of them is split; and a conserved C-terminus with a putative nuclear localization sequence (NLS). We propose that RhoBTB1 is found as a dimer and in a folded conformation. Upon post-transcriptional modification (e.g. polyubiquitination on K197), the Rho domain is released and RhoBTB1 can interact with ROCK1 through its HR1-like domain.

Similar articles

Cited by

References

    1. Cherfils J. and Zeghouf M. (2013) Regulation of small GTPases by GEFs, GAPs, and GDIs. Physiol. Rev. 93, 269–309 10.1152/physrev.00003.2012 - DOI - PubMed
    1. Aspenström P., Ruusala A. and Pacholsky D. (2007) Taking Rho GTPases to the next level: the cellular functions of atypical Rho GTPases. Exp. Cell Res. 313, 3673–3679 10.1016/j.yexcr.2007.07.022 - DOI - PubMed
    1. Berthold J., Schenková K. and Rivero F. (2008) Rho GTPases of the RhoBTB subfamily and tumorigenesis. Acta Pharmacol. Sin. 29, 285–295 10.1111/j.1745-7254.2008.00773.x - DOI - PubMed
    1. Ji W. and Rivero F. (2016) Atypical Rho GTPases of the RhoBTB subfamily: roles in vesicle trafficking and tumorigenesis. Cells 5, E28 10.3390/cells5020028 - DOI - PMC - PubMed
    1. Berthold J., Schenková K., Ramos S., Miura Y., Furukawa M., Aspenström P. et al. (2008) Characterization of RhoBTB-dependent Cul3 ubiquitin ligase complexes–evidence for an autoregulatory mechanism. Exp. Cell Res. 314, 3453–3465 10.1016/j.yexcr.2008.09.005 - DOI - PMC - PubMed

Publication types