. 2019 Sep 10;476(17):2463-2486.
doi: 10.1042/BCJ20190405.

Mitofusins modulate the increase in mitochondrial length, bioenergetics and secretory phenotype in therapy-induced senescent melanoma cells

Affiliations

Mitofusins modulate the increase in mitochondrial length, bioenergetics and secretory phenotype in therapy-induced senescent melanoma cells

Jennyfer Martínez et al. Biochem J. .

Abstract

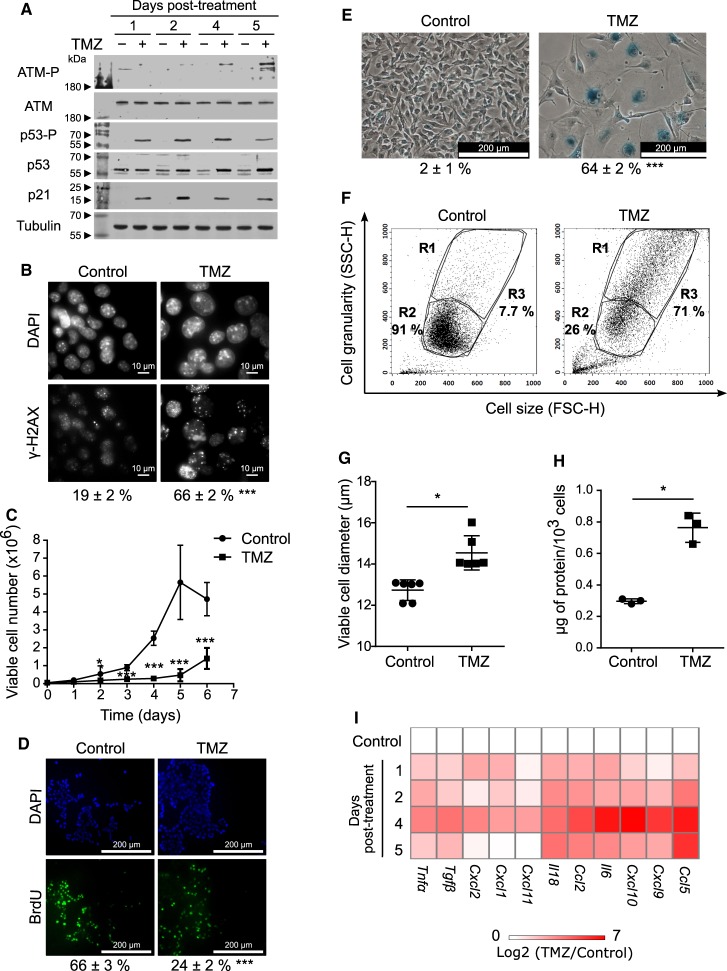
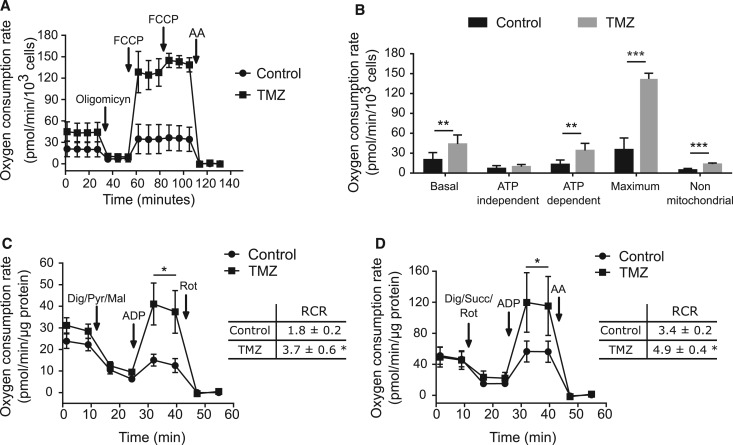
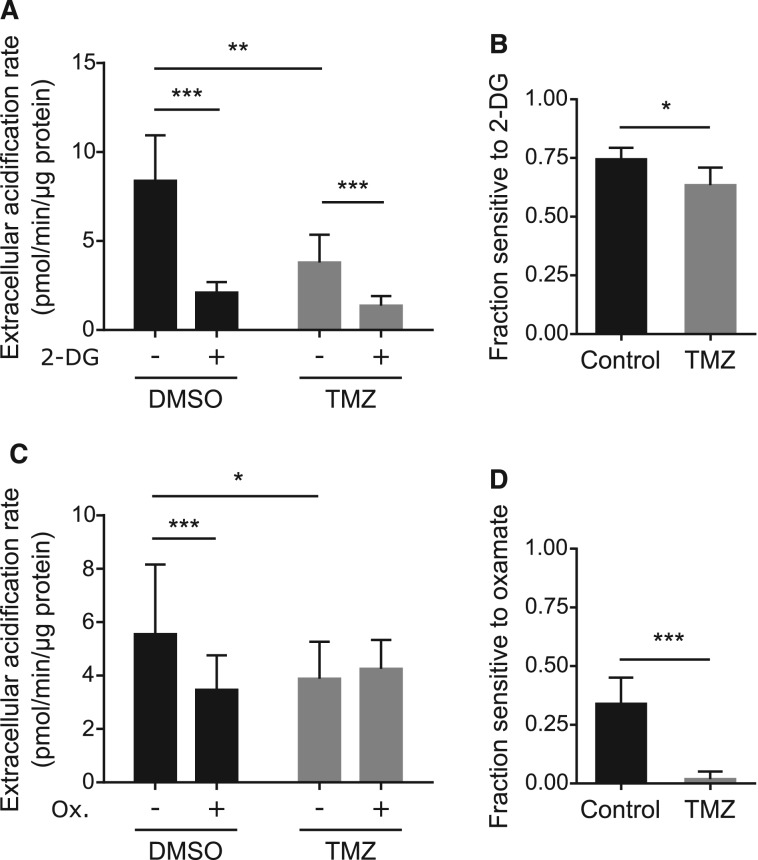
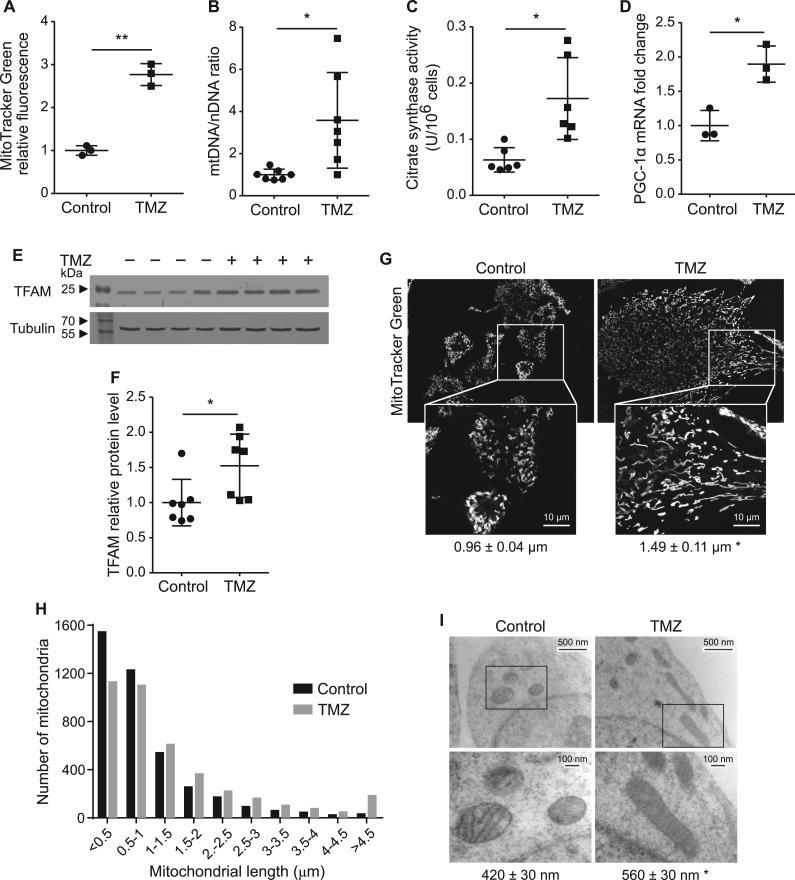
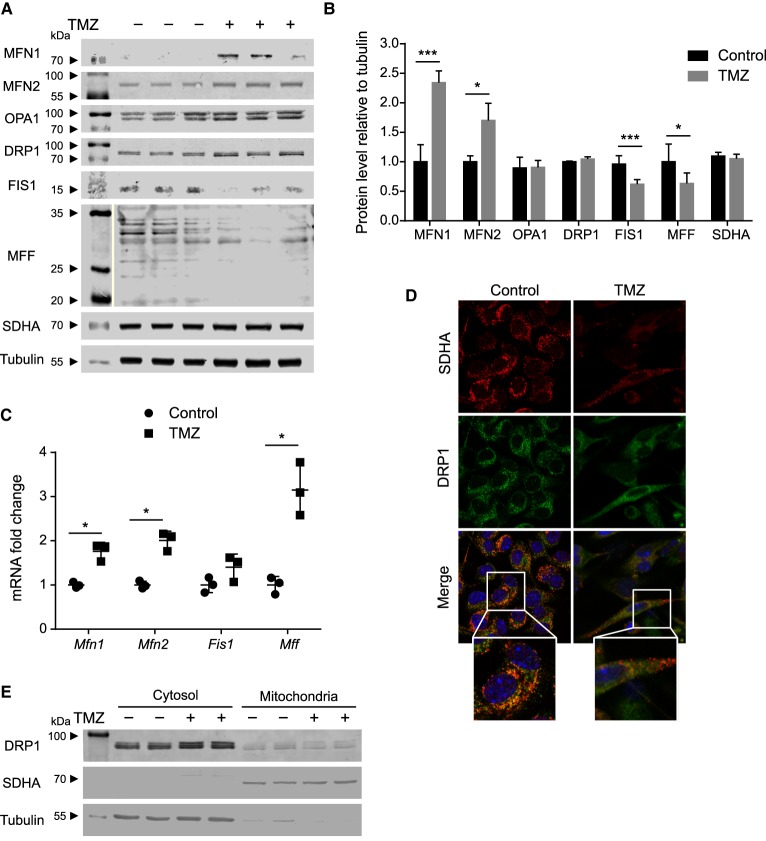
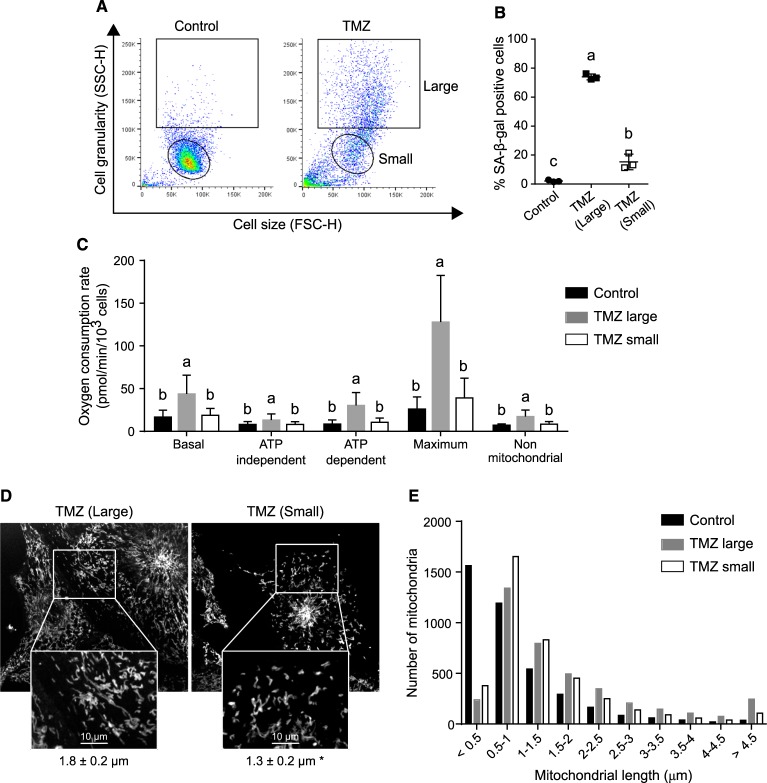
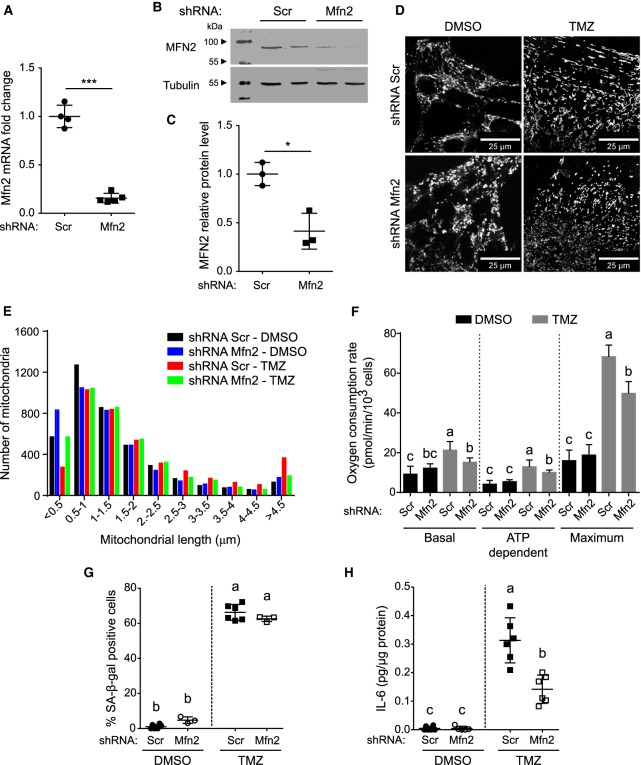
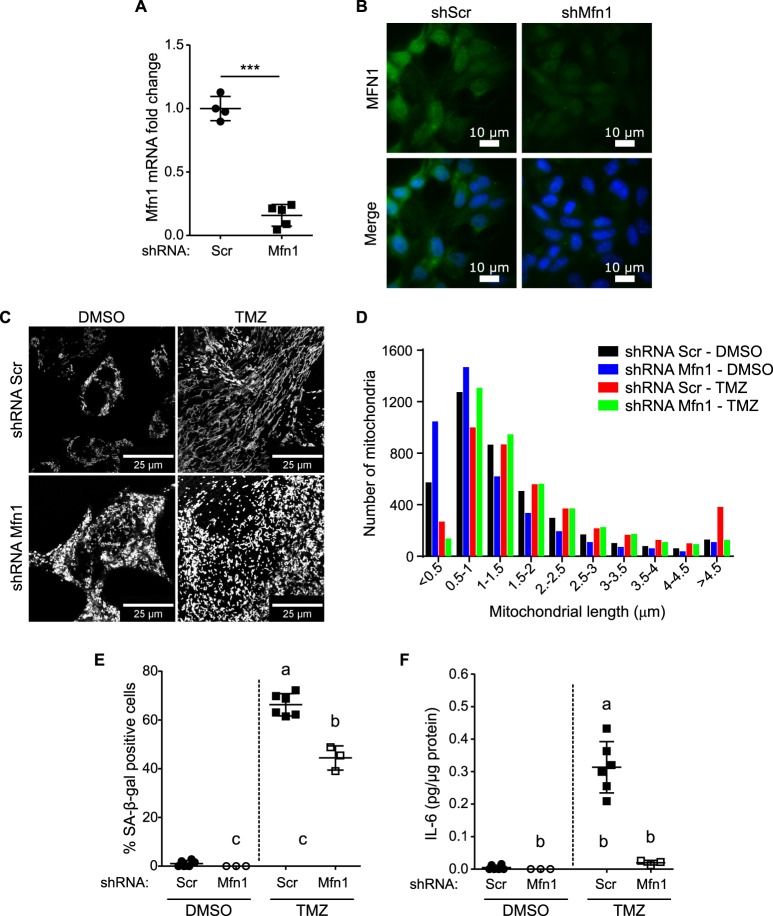
Cellular senescence is an endpoint of chemotherapy, and targeted therapies in melanoma and the senescence-associated secretory phenotype (SASP) can affect tumor growth and microenvironment, influencing treatment outcomes. Metabolic interventions can modulate the SASP, and an enhanced mitochondrial energy metabolism supports resistance to therapy in melanoma cells. Herein, we assessed the mitochondrial function of therapy-induced senescent melanoma cells obtained after exposing the cells to temozolomide (TMZ), a methylating chemotherapeutic agent. Senescence induction in melanoma was accompanied by a substantial increase in mitochondrial basal, ATP-linked, and maximum respiration rates and in coupling efficiency, spare respiratory capacity, and respiratory control ratio. Further examinations revealed an increase in mitochondrial mass and length. Alterations in mitochondrial function and morphology were confirmed in isolated senescent cells, obtained by cell-size sorting. An increase in mitofusin 1 and 2 (MFN1 and 2) expression and levels was observed in senescent cells, pointing to alterations in mitochondrial fusion. Silencing mitofusin expression with short hairpin RNA (shRNA) prevented the increase in mitochondrial length, oxygen consumption rate and secretion of interleukin 6 (IL-6), a component of the SASP, in melanoma senescent cells. Our results represent the first in-depth study of mitochondrial function in therapy-induced senescence in melanoma. They indicate that senescence increases mitochondrial mass, length and energy metabolism; and highlight mitochondria as potential pharmacological targets to modulate senescence and the SASP.

Keywords: bioenergetics; cell senescence; hemotherapy; melanoma; mitochondria; mitofusin.


Conflict of interest statement

The Authors declare that there are no competing interests associated with the manuscript.

Figures

Figure 1.
Figure 1.. TMZ induces senescence in mouse melanoma cells.
B16-F1 cells were exposed twice to TMZ (200 µM) or the vehicle, DMSO (Control) for 5 h with a 24 h interval. Measurements were performed at different times after the second exposure to the drug. (A) Representative western blots performed with antibodies for phosphorylated ATM (Ser1981) (ATM-P), ATM, phosphorylated p53 (Ser15) (p53-P), p53, p21 and tubulin (n = 3 culture dishes per condition). (B) Representative images of γ-H2AX nuclear foci two days after TMZ treatment. The percentage of cells with nuclear foci is shown below the picture (n = 6 coverslips per group). (C) Growth curves were obtained counting live cells by trypan blue exclusion (n = 9 wells per group). (D) Representative images of BrdU incorporation to DNA. The percentage of cells with positive nuclear staining is shown below the picture (n = 6 coverslips per group). (E) Representative images of SA-β-gal activity assay four days after TMZ exposure. The percentage of positive cells is shown below the picture (n = 6 wells per group). (F) Cell size (FSC-H parameter) and granularity (SSC-H parameter) were assessed by flow cytometry 4 days after treatment. A representative image is shown (n = 3 wells per group). (G) Viable cell diameter of trypsin-detached cells was determined from the histograms in Supplementary Figure S1B (n = 6 culture dishes per group). (H) Trypsin-detached cells were counted and protein mass (µg) was determined by the bicinchoninic acid technique (n = 3 culture dishes per group). (I) Real-time RT-PCR was performed for several components of the SASP. Results are expressed relative to the control condition (n = 3 culture dishes per group). Results are the mean ± S.D. T-tests were performed, * P < 0.05, *** P < 0.0001.
Figure 2.
Figure 2.. TMZ-induced senescent cells present increased mitochondrial respiration.
(A) The oxygen consumption rate (OCR) was determined before and following the sequential addition of oligomycin, FCCP and antimycin A (AA) (n = 9–10 wells per group). (B) The graph shows the respiratory parameters obtained from oxygen consumption rate (OCR) measurements in (A). (C and D) Respiration was evaluated in permeabilized cells after the sequential addition of (C) digitonin/pyruvate/malate, ADP, and rotenone; or (D) digitonin/succinate/rotenone, ADP and AA. The tables on the right of each figure show the respiratory control ratio (RCR) for each condition, determined as the ratio between the OCRs after and before the addition of ADP (n = 10–15 wells per group). In all figures, results are the mean ± S.D. T-tests were performed, * P < 0.05, ** P < 0.001, *** P < 0.0001.
Figure 3.
Figure 3.. Reduction in glucose catabolism to lactate in TMZ-induced senescence.
The ECAR was evaluated before and after the addition of (A) 2-deoxyglucose (2-DG) or (C) oxamate. (B and D) The fraction of basal extracellular acidification sensitive to 2-DG (B) or oxamate (D), respectively, was calculated as described in the Experimental section (n = 10 wells per group). Results are the mean ± S.D. T-tests were performed, * P < 0.05, ** P < 0.001, *** P < 0.0001.
Figure 4.
Figure 4.. TMZ-induced senescent cells present increased mitochondrial content and length.
(A) Cells were stained with the mitochondrial fluorescent probe MitoTracker Green FM and mitochondrial mass was determined by flow cytometry. Geometrical mean fluorescence intensity of the cell population, relative to control values is shown (n = 3 culture dishes per group). (B) MtDNA/nDNA ratio was assessed by real-time PCR. Results are expressed relative to the control condition (n = 7 culture dishes per group). (C) Citrate synthase activity was measured and normalized by 106 cells (n = 6 culture dishes per group). (D) Real-time RT-PCR was performed for PGC-1α expression. Results are expressed relative to the control condition (n = 3 culture dishes per group). (E) Representative western blots were performed with antibodies for TFAM and tubulin. (F) TFAM protein levels were quantified, from E, and normalized using tubulin as loading control (n = 7 culture dishes per group). Results are expressed relative to control condition. (G) Representative images of living cells stained with MitoTracker Green FM and analyzed by the confocal microscopy (×630) (n = 6 slides per condition were assessed). Magnified images of the boxed regions are shown below. Average mitochondrial length is shown below the pictures (n = 6 slides per group). (H) Frequency distribution analysis of mitochondrial length from images like those presented in (G). Statistical analysis included contingency tables and a Chi-square test (P < 0.0001). (I) Representative electron transmission microscopy images obtained at ×20 000 (top) and ×50 000 (bottom). The bottom images are the magnified images of the boxed region. Average mitochondrial length is shown below the pictures (n = 3 culture dishes per condition). Results are the mean ± S.D. T-tests were performed, * P < 0.05, ** P < 0.001.
Figure 5.
Figure 5.. Increase in mitochondrial fusion in TMZ-induced senescence.
(A) Representative western blots for mitochondrial fusion and fission proteins MFN1, MFN2, OPA1, DRP1, FIS1, MFF, SDHA and tubulin as loading control (n = 3 culture dishes per group). (B) Protein levels in independent western blots were quantified by densitometry and normalized using tubulin as loading control. Results are expressed relative to control condition (n = 3–10 culture dishes per group). (C) Real-time RT-PCR was performed for Mfn1, Mfn2, Fis1 and Mff. Results are expressed relative to the control condition (n = 3 culture dishes per group). (D) Representative images of colocalization of SDHA (red) and DRP1 (green). DAPI (blue) were used to stain the nuclei. Pearson correlation coefficients were 0.40 ± 0.02 for control, and 0.34 ± 0.02 for TMZ (P < 0.05, n = 4 coverslips per group). Enhanced images of the boxed regions (gray rectangle) are shown in the lower panel. (E) Representative western blot for DRP1, SDHA and tubulin in subcellular fractions enriched in mitochondria or cytosol. Results are the mean ± S.D. T-tests were performed, * P < 0.05, *** P < 0.0001.
Figure 6.
Figure 6.. Isolation of senescent cells by cell sorting and analysis of mitochondrial function and dynamics.
TMZ-treated cells were separated by cell sorting. (A) Representative dot plots show the regions selected to separate two populations of TMZ-treated cells: larger and granular senescent cells (Large) from smaller and less granular non-senescent cells (Small). The gating for selection of small and large cells was set up using the corresponding control and TMZ-treated cultures. (B) Quantification of SA-β-gal activity assay assessed after cell sorting (n = 3 culture dishes per condition). (C) Respiratory parameters were obtained, as described in Figure 2 (n = 18–21 wells per group). (D) Living cells were stained with the MitoTracker Green FM and analyzed by confocal microscopy (×630). Representative images and magnified images of the boxed regions (white rectangle) are shown. Average mitochondrial length is shown below the pictures (n = 3–6 slides per group). (E) Frequency distribution analysis of mitochondrial length from samples in (D). Statistical analysis included contingency tables and a Chi-square test (P < 0.0001). Results are the mean ± S.D. One-way ANOVA and Tukey post hoc tests were performed; groups with different letters or an asterisk are significantly different (P < 0.05).
Figure 7.
Figure 7.. Mitofusin 2 silencing affects mitochondrial size and function and reduces IL-6 secretion in TMZ-induced senescence cells.
Melanoma cells were transduced with lentiviral particles carrying short hairpin (shRNA) targeting Mfn2, or scrambled shRNA (Scr), and selected with puromycin, prior to treatment with DMSO or TMZ. (A) Real-time RT-PCR for Mfn2 (n = 4–5 culture dishes per group). Results were expressed relative to the condition Scr - DMSO. (B) Representative western blots for MFN2 and tubulin. (C) Quantification of protein levels in western blots is shown in (B). MFN2 was normalized using tubulin as loading control and results were expressed relative to control condition (Scr) (n = 3 culture dishes per group). (D) Representative images of living cells stained with MitoTracker Green FM and analyzed by confocal microscopy (×630). (E) Frequency distribution analysis of mitochondrial length from samples like those shown in (D). Statistical analysis included contingency tables and a Chi-square test (P < 0.0001). (F) Respiratory parameters obtained as described in Figure 2 (n = 5–10 wells per group). Main effects of treatment, shRNA and their interaction respectively for: basal OCR (P < 0.0001, P = 0.24, P < 0.05); ATP dependent OCR (P < 0. 0001, P = 0.36, P < 0.05); maximum OCR (P < 0.0001, P < 0.05, P < 0.0001). (G) Quantification of SA-β-gal positive cells (n = 3–6 wells per group). Main effects of treatment (P < 0.0001), shRNA (P = 0.99) and interaction (P < 0.05). (H) IL-6 secretion levels were analyzed by ELISA (n = 5–6 wells per group). Main effects of treatment (P < 0.0001), shRNA (P < 0.001) and interaction (P < 0.001). T-tests were performed in (A) and (C) * P < 0.05, *** P < 0.0001. Statistical significance of main effects of treatment, shRNA and their interaction, were determined by two-way ANOVA, and Tukey post hoc for multiple comparisons in figures FH; groups with different letters are significantly different (P < 0.05). In all graphs results are the mean ± S.D.
Figure 8.
Figure 8.. Mitofusin 1 silencing affects mitochondrial size and reduces IL-6 secretion of TMZ-induced senescence cells.
Melanoma cells were transduced with lentiviral particles carrying short hairpin (shRNA) targeting Mfn1, or scrambled shRNA (Scr), and selected with puromycin, prior to the treatment with either DMSO or TMZ. (A) Real-time RT-PCR for Mfn1 (n = 4–5 culture dishes per group). Results were expressed relative to the condition Scr - DMSO. (B) Representative images of MFN1 staining with an anti-MFN1 antibody (green) and DAPI (blue) to stain the nuclei, obtained by immunocytochemistry and epifluorescence microscopy (×1000). (C) Living cells were stained with MitoTracker Green FM and analyzed by confocal microscopy (×630). (D) Frequency distribution analysis of mitochondrial length from samples in (C). Statistical analysis included contingency tables and a Chi-square test (P < 0.0001). (E) Quantification of SA-β-gal positive cells (n = 3–6 wells per group). Main effects of treatment (P < 0.0001), shRNA (P < 0.0001) and interaction (P < 0.0001). (F) IL-6 secretion was analyzed by ELISA (n = 3–6 wells per group). Main effects of treatment (P < 0.0001), shRNA (P < 0.0001) and interaction (P < 0.0001). T-test was performed in (A) *** P < 0.0001. Statistical significance of main effects of treatment, shRNA and their interaction, were determined by two-way ANOVA, and Tukey post hoc for multiple comparisons (E and F), groups with different letters are significantly different (P < 0.05). Results are the mean ± S.D.

Similar articles

Cited by

References

    1. Campisi J. (2013) Aging, cellular senescence, and cancer. Annu. Rev. Physiol. 75, 685–705 10.1146/annurev-physiol-030212-183653 - DOI - PMC - PubMed
    1. Vredeveld L.C., Possik P.A., Smit M.A., Meissl K., Michaloglou C., Horlings H.M. et al. (2012) Abrogation of BRAFV600E-induced senescence by PI3K pathway activation contributes to melanomagenesis. Genes Dev. 26, 1055–1069 10.1101/gad.187252.112 - DOI - PMC - PubMed
    1. Gray-Schopfer V.C., Cheong S.C., Chong H., Chow J., Moss T., Abdel-Malek Z.A. et al. (2006) Cellular senescence in naevi and immortalisation in melanoma: a role for p16? Br. J. Cancer 95, 496–505 10.1038/sj.bjc.6603283 - DOI - PMC - PubMed
    1. Collado M. and Serrano M. (2010) Senescence in tumours: evidence from mice and humans. Nat. Rev. Cancer 10, 51–57 10.1038/nrc2772 - DOI - PMC - PubMed
    1. Ewald J.A., Desotelle J.A., Wilding G. and Jarrard D.F. (2010) Therapy-induced senescence in cancer. J. Natl Cancer Inst. 102, 1536–1546 10.1093/jnci/djq364 - DOI - PMC - PubMed

Publication types

MeSH terms