. 2019 Sep 3;116(36):17906-17915.
doi: 10.1073/pnas.1906958116. Epub 2019 Aug 20.

Horizontal gene transfer overrides mutation in Escherichia coli colonizing the mammalian gut

Affiliations

Horizontal gene transfer overrides mutation in Escherichia coli colonizing the mammalian gut

Nelson Frazão et al. Proc Natl Acad Sci U S A. .

Abstract

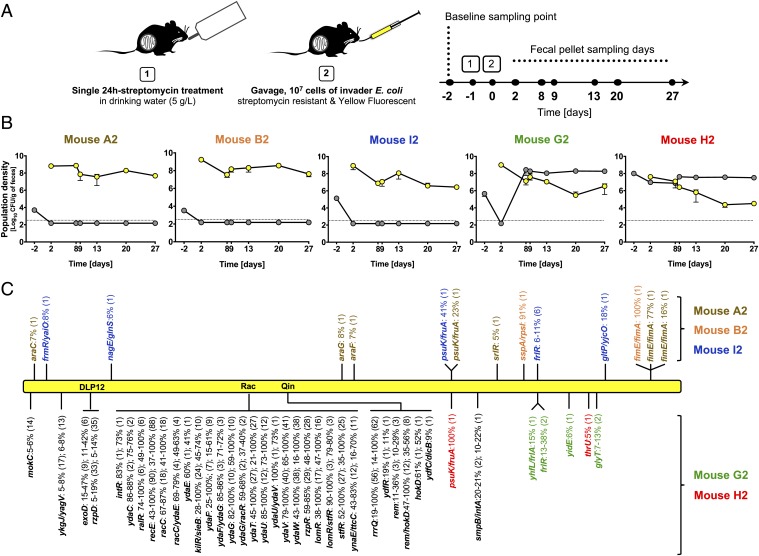
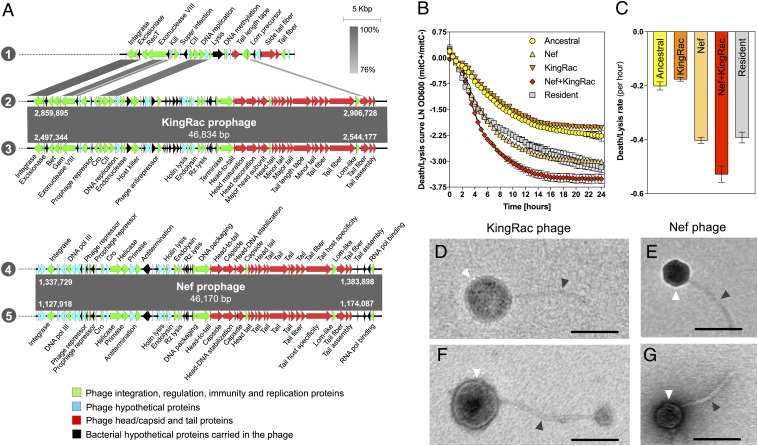
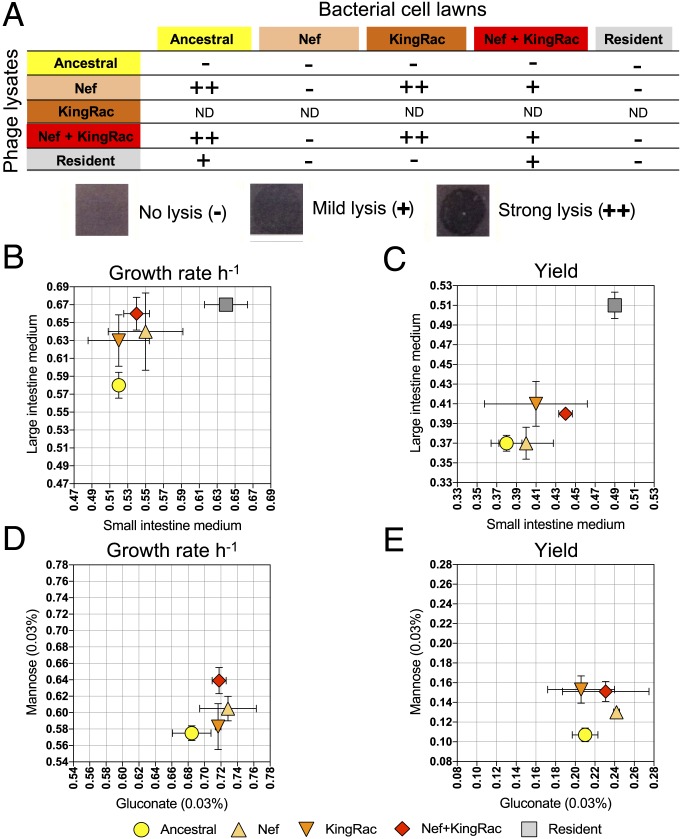
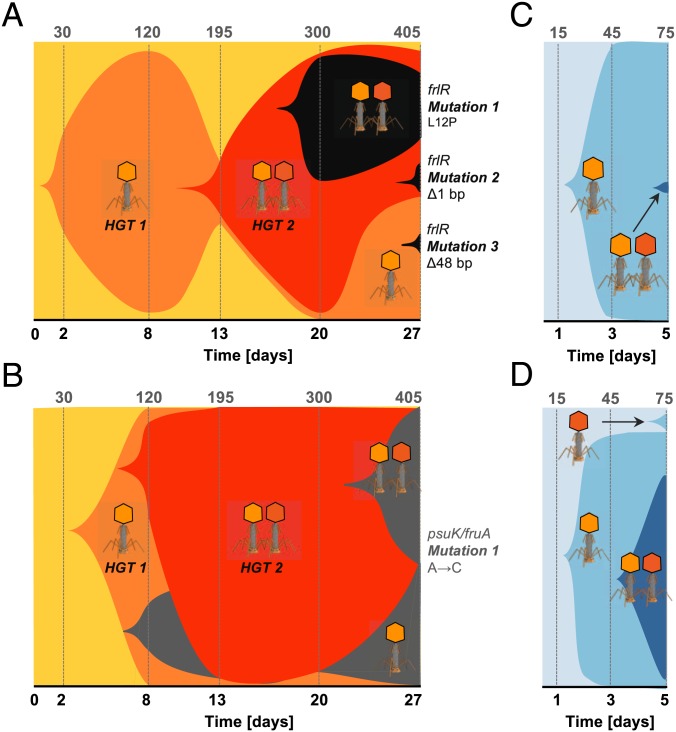
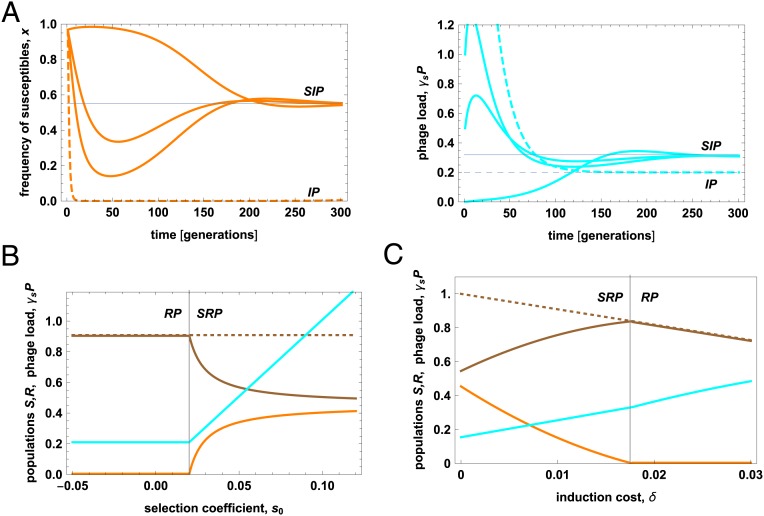
Bacteria evolve by mutation accumulation in laboratory experiments, but tempo and mode of evolution in natural environments are largely unknown. Here, we study the ubiquitous natural process of host colonization by commensal bacteria. We show, by experimental evolution of Escherichia coli in the mouse intestine, that the ecology of the gut controls the pace and mode of evolution of a new invading bacterial strain. If a resident E. coli strain is present in the gut, the invading strain evolves by rapid horizontal gene transfer (HGT), which precedes and outweighs evolution by accumulation of mutations. HGT is driven by 2 bacteriophages carried by the resident strain, which cause an epidemic phage infection of the invader. These dynamics are followed by subsequent evolution by clonal interference of genetically diverse lineages of phage-carrying (lysogenic) bacteria. We show that the genes uptaken by HGT enhance the metabolism of specific gut carbon sources and provide a fitness advantage to lysogenic invader lineages. A minimal dynamical model explains the temporal pattern of phage epidemics and the complex evolutionary outcome of phage-mediated selection. We conclude that phage-driven HGT is a key eco-evolutionary driving force of gut colonization-it accelerates evolution and promotes genetic diversity of commensal bacteria.

Keywords: bacterial evolution; bacteriophage; gut microbiota; horizontal gene transfer; mutation.


Conflict of interest statement

The authors declare no conflict of interest.

Figures

Fig. 1.
Fig. 1.
Replacement vs. coexistence of the invader E. coli with the mouse gut resident. (A) Experimental setup for in vivo evolution. (B) Loads (log10 CFU/g of feces) of invader (yellow circles) and resident (gray circles) E. coli in mice A2, B2, I2, G2, and H2. Error bars represent 2SE, and the dotted line indicates the detection limit (330 CFU/g of feces). (C) Evolutionary pattern, analyzed by whole-genome sequencing, of large pools (>1,000 clones) of the evolved YFP invader E. coli sampled at day 27 from feces of each mouse, when compared with the genome of the ancestral invader clone. The name of each mutated gene or intergenic region (gene/gene) is indicated, along with the frequency at which the mutation was detected (shown are mutations ≥5%). For each locus, the number of distinct alleles is shown in parentheses. Schematic representation of the evolved E. coli genome (yellow bar) is shown. Mutations indicated above the yellow bar were found in the evolved E. coli clones when not coexisting with the resident E. coli: mice A2 (brown), B2 (orange), and I2 (blue). Mutations indicated below the yellow bar were found in the evolved E. coli clones when coexisting with the resident E. coli: mice G2 (green) and H2 (red). These genetic changes occurred mainly within cryptic E. coli prophage (DLP12, Rac, and Qin) sequences, with mutational parallelism shown in black.
Fig. 2.
Fig. 2.
Phage-mediated HGT from resident to invader E. coli. (A) Sequence alignment of prophage DNA sequences from the ancestral invader, resident (mouse G2, day −2), and evolved invader (mouse G2, day 27) clones: 1, Rac defective prophage from ancestral; 2, KingRac prophage from resident; 3, KingRac prophage from evolved; 4, Nef prophage from resident; and 5, Nef prophage from evolved. Two new prophages were found in the genome of the evolved clone: KingRac, a Rac-related prophage, and Nef, both present and 100% identical to the resident E. coli. Arrows correspond to the coding sequences (CDS) found in the prophages. Green indicates phage integration, regulation, immunity, or replication proteins; blue indicates phage hypothetical proteins; and red indicates phage head/capsid and tail proteins, while black arrows correspond to bacterial CDS (hypothetical proteins) present in the prophage DNA sequences. Prophage length and integration positions are indicated by the numbers in white. (B) Mitomycin C-induced bacterial cell death/lysis curves. Ancestral, KingRac, Nef, Nef+KingRac, and resident E. coli clones were grown in LB medium with or without mitomycin C, an antibiotic inducing prophage excision. Ln of the ratio of OD600 values with (mitC+) and without (mitC−) mitomycin C is shown. Error bars represent 2SE. The death/lysis curve of the ancestral clone reflects direct mytomycin C bacterial killing, while for the other clones, death/lysis derives from both direct killing and lysis by prophage induction. (C) Death/lysis rate (per hour) calculated from the slope of the curves shown in B in the initial 4.5 h. Error bars represent 2SD. (DG) Electron micrographs of the KingRac phage particle induced from the evolved KingRac clone (D), the Nef phage particle induced from the evolved Nef clone (E), the KingRac phage particle induced from the resident clone (F), and the Nef phage particle induced from the resident clone (G). White and gray arrows indicate the phage head/capsid and the tail, respectively. The ancestral clone, also induced with mitomycin C, produced no phage particles (SI Appendix, Fig. S8). (Scale bars: 100 nm.)
Fig. 3.
Fig. 3.
Evolution by phage-mediated HGT is adaptive. (A) The ancestral, evolved, and resident clones were tested for phage-mediated lysis. The evolved clones include 3 different genetic backgrounds: Nef, KingRac, and Nef+KingRac prophages without any other mutations. Drops (10 µL) of phage-containing supernatant (phage lysate) were applied to growing bacterial cell lawns of each clone. The phage lysate was obtained from the clones' supernatant after mitomycin C induction (5 µg/mL). The KingRac clone is poorly induced (Fig. 2B), and the number of phage particles is expected to be small. ND, not determined. For the other clones, the exact number of phage particles is unknown, as individual phage plaques could not be scored, preventing comparison of the infection efficiency between different phage lysates. (B and C) The ancestral, evolved (Nef, KingRac, and Nef+KingRac), and resident clones were grown in intestinal medium. The maximum growth rate (±2 SE) was assessed in small and large intestinal medium (n = 3) (B), and the yield (±2 SE) after 24 h of growth in small and large intestinal medium (n = 3) was measured (C). (D and E) The ancestral and evolved (Nef, KingRac, and Nef+KingRac) clones were grown in minimal medium supplemented with mannose or gluconate (0.03%). The maximum growth rate (per hour) was assessed in mannose or gluconate medium (n = 5) (D), and the yield after 24 h of growth in mannose or gluconate medium (n = 5) was measured (E).
Fig. 4.
Fig. 4.
Phage-mediated HGT is followed by complex clonal evolution. (A and B) Evolution experiment: Muller plots of the adaptive phage-mediated HGT and mutation dynamics in the invader E. coli population (A, mouse G2; B, mouse H2). Shaded areas are proportional to the frequency of each clone: ancestral (yellow), Nef lysogen (light orange), Nef+KingRac lysogen (dark orange), and de novo mutations frlR (1 nonsynonymous mutation, 2 deletion mutations) in mouse G2 (black) and psuK/fruA (1 intergenic mutation) in mouse H2 (gray). Phage symbols indicate the HGT events (1 refers to Nef and 2 to KingRac) for each clone. Numbers in the top row give the estimated number of generations. (C and D) Cocolonization experiment: Muller plots of phage-mediated HGT in new recipient E. coli populations in 2 mice (clones are now shaded in blue). In all cases, HGT takes place first, and de novo mutations appear on the background of high-frequency lysogenic clones.
Fig. 5.
Fig. 5.
Phages generate epidemics and promote coexistence of bacterial clones. (A) Phage infection dynamics. The population frequency of susceptible (ancestral) bacteria in the invader population (orange) and the phage load γSP (cyan) are plotted against time. Stable equilibrium values are marked by gray lines (SIP equilibrium, solid; IP equilibrium, dashed; Materials and Methods). Time-dependent infection patterns are shown for different initial phage load: slow infection (γSP0 = 0), epidemic with initial decline of susceptibles at high phage levels and subsequent rebound at lower phage levels (γSP0 = 0.5, 1), and pandemic with rapid loss of susceptibles (γSP0 = 5, dashed). See also SI Appendix, Fig. S11. (B) The stable equilibrium state (brown, density of inducible resident strain; orange, density of susceptible invader strain; dashed brown, total bacterial population density; cyan, phage load) is plotted against the selective difference at low phage density, s0. A threshold value s0* (vertical line) marks the onset of bacterial coexistence in the presence of phages (SRP equilibrium) from a regime of displacement (RP equilibrium); Materials and Methods. (C) The same stable equilibrium is plotted against the selective cost of induction of the resident, δR. Population density and fitness of the inducible strain (brown line) reach a maximum close to the onset of coexistence, δR* (vertical line). Model parameters: γS = 0.005, b = 20 (34), δR = 0.01, κ = 0.5 (in A), background fitness rS = 0.15, 0.125 (in A and C), rI = rR = 0.11, c = 0.1, q = 1, λ = 0.05; definitions and model details are given in Materials and Methods. Population densities are shown in units of the background carrying capacity of the resident, R0 = rR∕c.

References

    1. Lloyd-Price J., Abu-Ali G., Huttenhower C., The healthy human microbiome. Genome Med. 8, 51 (2016). - PMC - PubMed
    1. Jandhyala S. M., et al. , Role of the normal gut microbiota. World J. Gastroenterol. 21, 8787–8803 (2015). - PMC - PubMed
    1. Sousa A., Frazão N., Ramiro R. S., Gordo I., Evolution of commensal bacteria in the intestinal tract of mice. Curr. Opin. Microbiol. 38, 114–121 (2017). - PubMed
    1. Narra H. P., Ochman H., Of what use is sex to bacteria? Curr. Biol. 16, R705–R710 (2006). - PubMed
    1. Soucy S. M., Huang J., Gogarten J. P., Horizontal gene transfer: Building the web of life. Nat. Rev. Genet. 16, 472–482 (2015). - PubMed

Publication types

LinkOut - more resources