. 2019 Aug 20;10(9):631.
doi: 10.1038/s41419-019-1861-1.

The Δ133p53β isoform promotes an immunosuppressive environment leading to aggressive prostate cancer

Affiliations

The Δ133p53β isoform promotes an immunosuppressive environment leading to aggressive prostate cancer

Marina Kazantseva et al. Cell Death Dis. .

Abstract

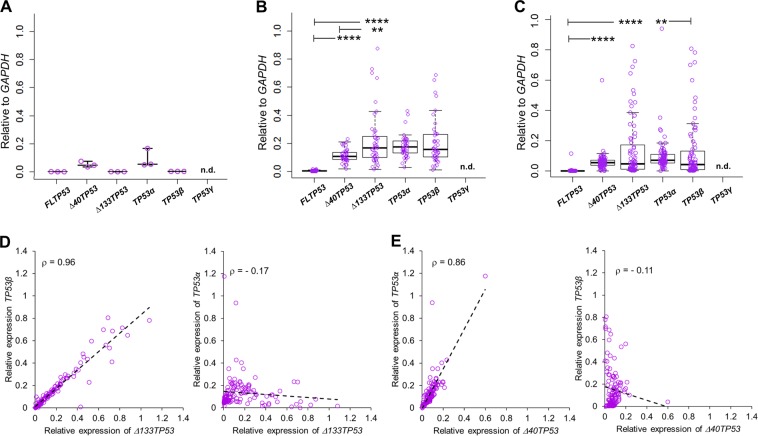
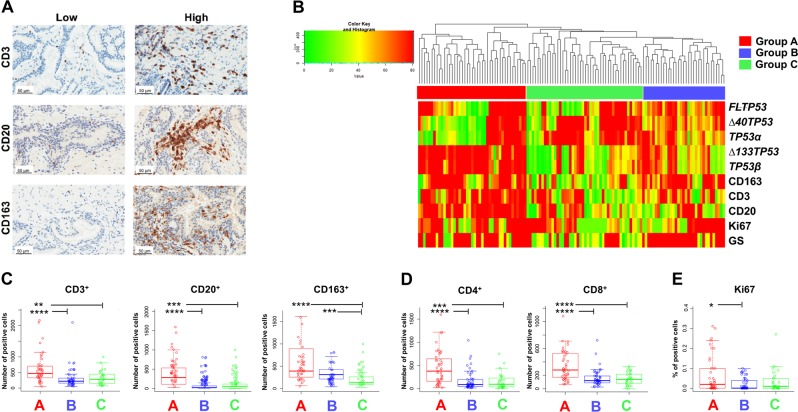
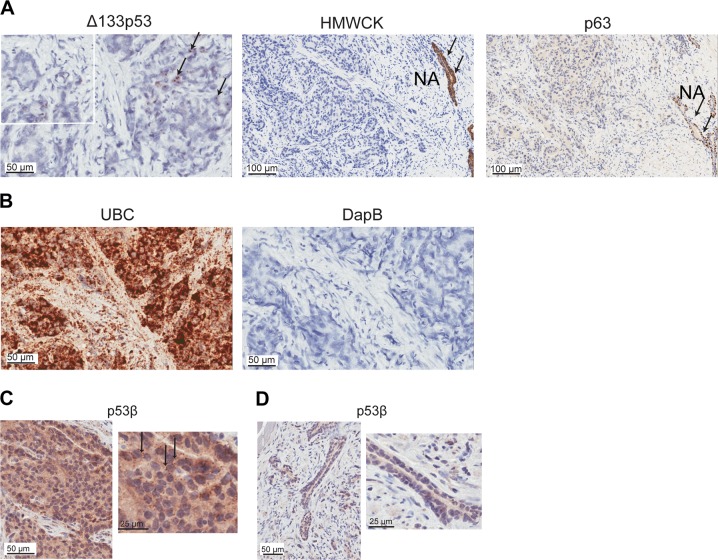
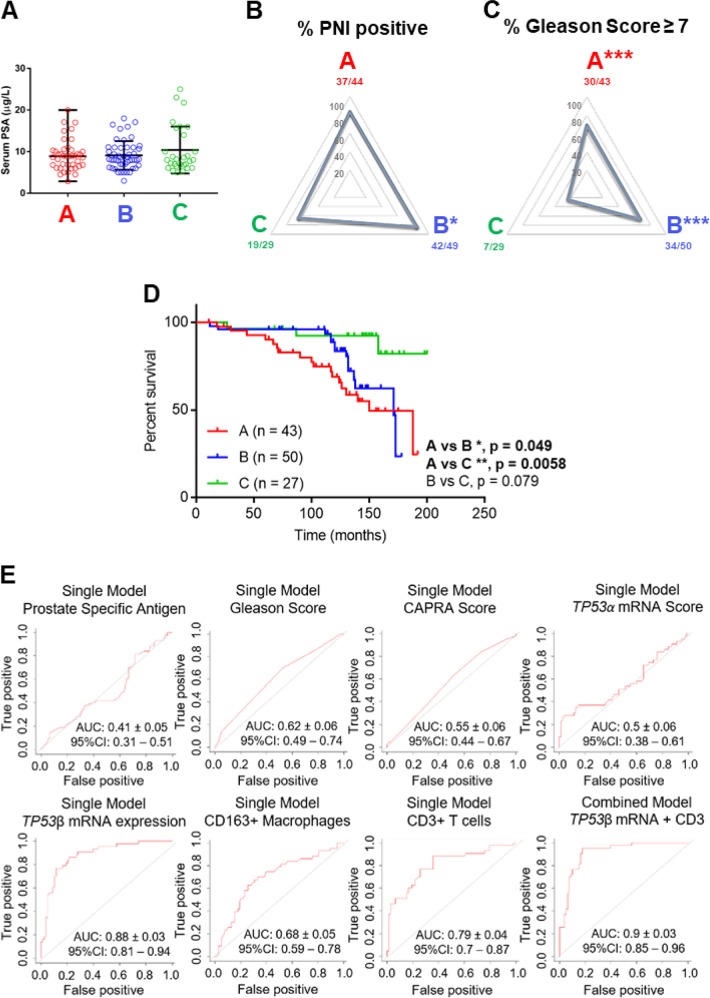
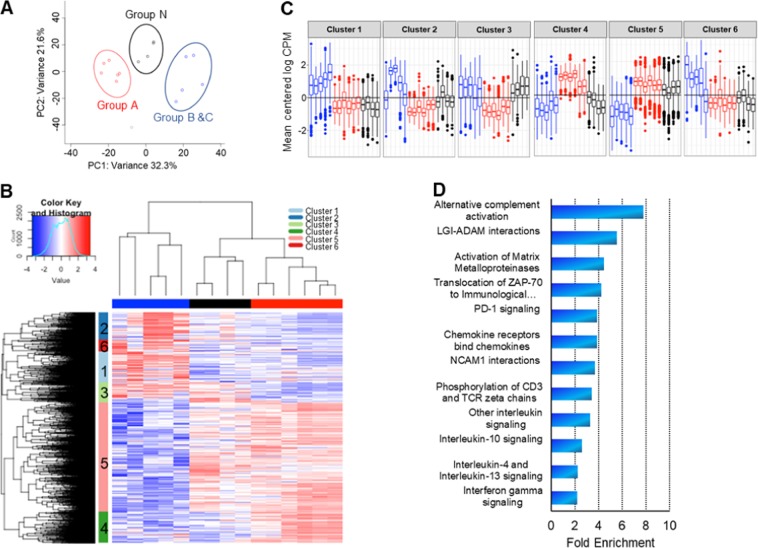
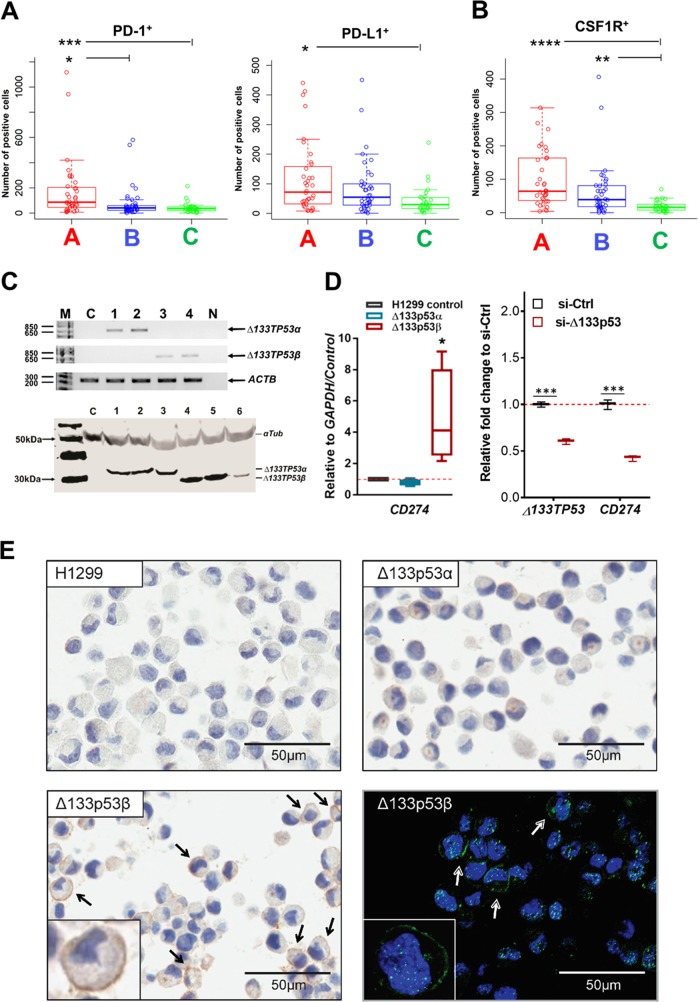
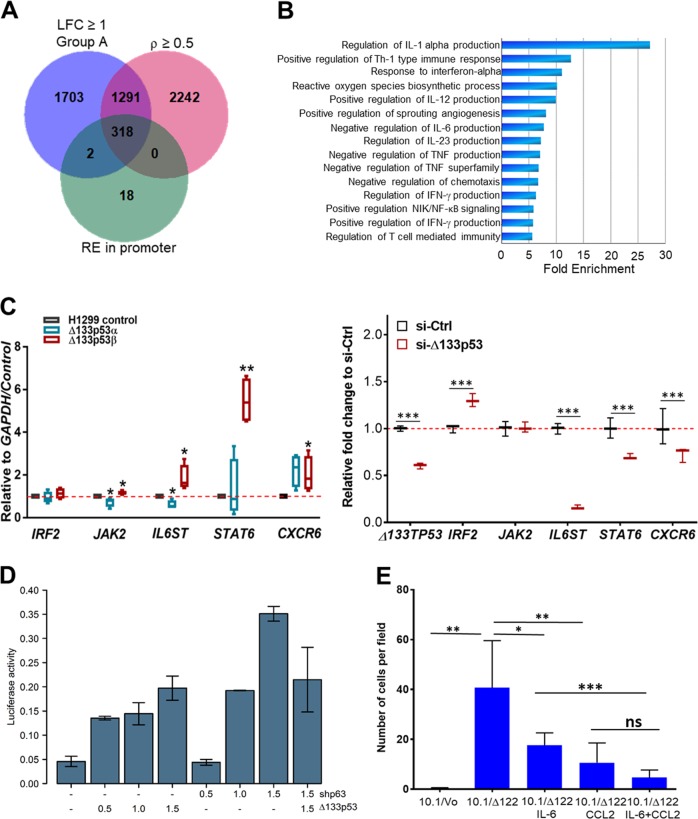
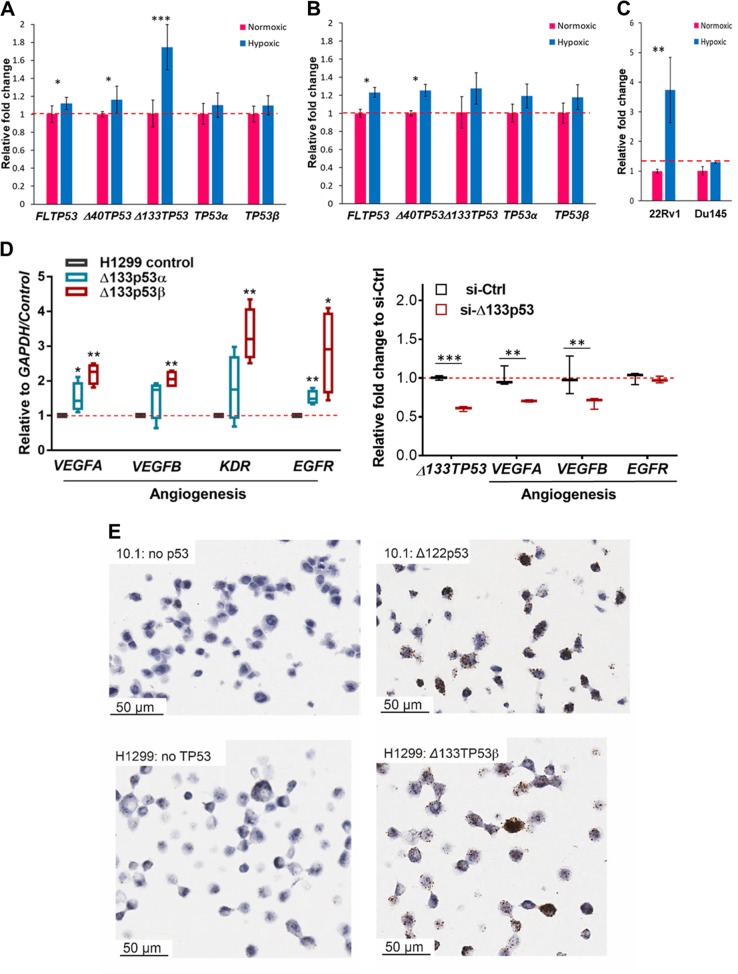
Prostate cancer is the second most common cancer in men, for which there are no reliable biomarkers or targeted therapies. Here we demonstrate that elevated levels of Δ133TP53β isoform characterize prostate cancers with immune cell infiltration, particularly T cells and CD163+ macrophages. These cancers are associated with shorter progression-free survival, Gleason scores ≥ 7, and an immunosuppressive environment defined by a higher proportion of PD-1, PD-L1 and colony-stimulating factor 1 receptor (CSF1R) positive cells. Consistent with this, RNA-seq of tumours showed enrichment for pathways associated with immune signalling and cell migration. We further show a role for hypoxia and wild-type p53 in upregulating Δ133TP53 levels. Finally, AUC analysis showed that Δ133TP53β expression level alone predicted aggressive disease with 88% accuracy. Our data identify Δ133TP53β as a highly accurate prognostic factor for aggressive prostate cancer.


Conflict of interest statement

The authors declare that they have no conflict of interest.

Figures

Fig. 1
Fig. 1. The p53 isoform, Δ133TP53β, is upregulated in prostate cancers.
Box and whisker plots show relative TP53 transcript levels in a. Non-neoplastic prostate tissues (n = 3) and in 2 prostate cancer cohorts: b cohort 1 (n = 43) and c. cohort 2 (n = 79). ac Symbols show individual cancers; the horizontal line in the box represents median values and the outlines represent the 25th–75th percentile, whiskers show the 10–90% CI. Significant differences were determined by Mann–Whitney U test, *p < 0.05, **p < 0.01, ***p < 0.005, . n.d. not detected. Scatter plots show the correlation of relative abundance of d. ∆133TP53 vs TP53β transcripts p < 0.0001 (left panel) and ∆133TP53 vs TP53α transcripts p = 0.24 (right panel). e40TP53 vs TP53α transcripts p < 0.0001 (left panel), and ∆40TP53 vs TP53β transcripts p = 0.21 (right panel), from both prostate cancer cohorts (n = 122). Spearman ρ values are shown
Fig. 2
Fig. 2. Prostate cancers with elevated Δ133TP53β show high immune cell infiltration and increased proliferation.
a Representative examples of prostate cancer sections with low- or high number of cells staining for CD3, CD20 and CD163 using immunohistochemistry. Magnification, ×200. b Unsupervised rank hierarchical clustering of 122 prostate cancers clustered by ranked mRNA expression of FLTP53, Δ40TP53, TP53α, Δ133TP53, TP53β, immune marker cell count CD163, CD3, CD20, proliferation marker Ki67 and the Gleason score (GS), identified three cancer subgroups designated Groups A (red), B (blue) and C (green). Box and whisker plots show c. the number of CD3+, CD20+ and CD163+ immune cells, d the number of CD4+ and CD8+ T cells in the three prostate groups and e the percentage of Ki67+ malignant cells as a measure of proliferation. Symbols show individual samples, box (median ± 25th–75th percentile), and whiskers show the 10–90% CI. *p < 0.05, **p < 0.01, ***p < 0.001, ****p < 0.0001 as determined by Kruskal–Wallis and Dunn’s post hoc test or by unpaired one-tailed t-test
Fig. 3
Fig. 3. Δ133TP53β is expressed in cancer cells.
a In situ hybridization using RNAscope detected Δ133TP53 (black arrows) in FFPE prostate cancer tissues (left panel). Immunohistochemical staining for high molecular weight cytokeratin (HMWCK) and p63 (middle and right panels, respectively) to identify loss of HMWCK and p63 in prostate cancer. NA normal associated tissue (black arrows). b Left panel, probes to ubiquitin C (UBC) as a positive control for RNA quality and right panel, probes to the bacterial gene DapB as a negative control. Nuclei were counterstained with hematoxylin. c Immunohistochemistry using the KJC8 antibody to detect p53β (black arrows) in FFPE prostate cancer tissues. d Absence of p53β staining in normal associated prostate epithelium. Nuclei were counterstained with hematoxylin
Fig. 4
Fig. 4. Elevated Δ133TP53β predicts prostate cancer patients at risk for developing aggressive cancer.
Groups A, B and C prostate cancers were evaluated based on clinico-pathological criteria. a Total serum prostate-specific antigen (PSA) concentrations. Symbols show individual samples; horizontal lines represent median values and vertical lines represent the range. b Radar plots showing the frequency of cancers with perineural invasion (PNI). c Radar plots showing the frequency of cancers with Gleason Scores ≥7. Statistical significance was determined by chi-square test compared to Group C cancers. d Kaplan–Meier plots of progression-free survival of each subgroup of prostate cancers. Statistical significance was evaluated using log-rank test. e Receiver-operating characteristic (ROC) curve illustrating the 10-fold cross-validated area under the curve (AUC) ± SEM for predicting the probability of high-risk patients using either univariate or multivariate analyses. Top panel (left to right) prostate-specific antigen (PSA), Gleason Score, CAPRA score and TP53α mRNA expression. Bottom panel (left to right) TP53β mRNA expression, CD3+ T cells, CD163+ macrophages and the combined model of TP53β mRNA expression with CD3 immune cell content
Fig. 5
Fig. 5. Prostate cancers with elevated Δ133TP53β expression show immune and invasive gene signatures.
a Principal component analyses of 1000 genes with maximum variance determined by RNA-seq of 12 prostate cancers and 4 normal associated tissues. Red—Group A cancers, Blue—Group B and C cancers, and Black—Group N (normal associated tissue). b Unsupervised clustering of differentially expressed genes (log fold change ≥1.0 and ≤–1.0 and FDR < 0.05) between Groups N, A and B/C. The vertical bar shows the clusters of genes either up or downregulated across the different groups. Columns—Sample, Row—gene. c Shows the mean centred log CPM (log2-counts per million) of genes in each cluster identified by unsupervised hierarchical clustering. Group A – Red, Group B/C—Blue and Group N—Black. d Shows fold enrichment of immune and invasive pathways in clusters 4 and 5 using Pantherdb
Fig. 6
Fig. 6. Prostate cancers with elevated Δ133p53β have an immunosuppressive phenotype.
a Evaluation of an immunosuppressive phenotype by immunohistochemistry shows the number of PD-1 positive (left panel), PD-L1 positive (right panel), and b CSF1R positive cells in the three prostate cancer groups. Symbols show individual samples, box (median ± 25th–75th percentile), and whiskers show the 10–90% CI. *p < 0.05, **p < 0.01, ***p < 0.001 and ****p < 0.0001 as determined by Kruskal–Wallis and Dunn’s post hoc test. c Top panel: representative nested PCR analysis to validate the expression of ∆133TP53α (lanes 1 and 2), and ∆133TP53β (lanes 3 and 4) isoforms in stably transfected p53-null H1299 cells (C control), N non-template control, M molecular weight marker and ACTB as a reference gene. Bottom panel: western blot analysis to validate the expression of Δ133p53 isoforms in clonal cells stably transfected with Δ133p53α (lanes: 1–3) and Δ133p53β (lanes: 4–6); the absence of p53 isoforms in p53-null H1299 control cells is also shown (lane: C) and αTub (alpha tubulin) was used as a loading control. d Left panel: CD274/PD-L1 expression in four clonal lines expressing either Δ133p53α or Δ133p53β isoforms relative to control p53-null H1299 cells. Right panel: CD274/PD-L1 expression in 22Rv1 cells 48 h after knockdown of Δ133p53. Box (median ± 25th–75th percentile), and whiskers show the 10–90% CI. *p < 0.05, **p < 0.01, ***p < 0.005 as determined by paired one-tailed t-test. e Immunohistochemistry and immunofluorescence staining to detect PD-L1 expression in control H1299, Δ133p53α or Δ133p53β expressing cells
Fig. 7
Fig. 7. ∆133p53 isoforms regulate genes involved in immune cell activity and recruitment.
a Venn diagram showing genes differentially regulated in Group A prostate cancers, containing p53/p63/p73 response elements in their promoters and are associated with Δ133TP53β mRNA expression (Spearman's correlation coefficient cutoff of ρ > 0.5). b Bar graph depicting a selected list of pathways (PantherdB) with >5 fold enrichment and FDR < 0.05. c Expression of selected genes in left panel: four clonal lines expressing Δ133p53α or Δ133p53β isoforms compared to control p53-null H1299 cells, right panel: 22Rv1 cells 48 h after knockdown of Δ133p53. Box (median ± 25th–75th percentile), and whiskers show the 10–90% CI. *p < 0.05, **p < 0.01 and ***p < 0.001, as determined by paired one-tailed t-test. d Transcriptional activation of the IL-6 promoter by Δ133p53 or by inhibiting TP63 (shp63). Cells were transiently transfected with 1.0 µg of IL-6 luciferase reporter plasmid and varying amounts of either Δ133p53 or shp63. Luciferase activity was determined and is normalized to cell number. Bars represent the mean and error bars are ± SD; n = 4 biological replicates. e 10.1/vector and 10.1/Δ122 cells treated with blocking antibody against either IL-6, CCL2 or both IL-6 (2.0 μg) and CCL2 (3.0 μg). Cells were allowed to migrate for 4 h then membranes were fixed, stained, imaged and quantified. Three technical replicate counts of cells per field were combined and are shown as mean ± SEM. Significance was determined as *p < 0.05, **p < 0.01, ***p < 0.005 using unpaired t-tests. ns not significant
Fig. 8
Fig. 8. Hypoxia induces expression of the Δ133TP53 isoform in prostate cancer cells with wild-type p53.
Bar plots show relative TP53 variant expression in a 22Rv1 and b DU145 cells and in c. VEGFA expression in prostate cancer cell lines cultured under hypoxic conditions (1% O2) for 24 h (blue boxes) compared to those cultured under normoxic conditions (red boxes). *p < 0.05 and ***p < 0.001 as determined by paired one-tailed t-test. d Expression of selected genes involved in angiogenesis in: left panel: four clonal lines expressing either Δ133p53α or Δ133p53β isoforms compared to control p53-null H1299 cells, right panel: 22Rv1 cells 48 h after knockdown of Δ133p53. Box (median ± 25th–75th percentile), and whiskers show the 10–90% CI. *p < 0.05, **p < 0.01 and ***p < 0.001, as determined by paired one-tailed t-test. e In situ hybridization using RNAscope to detect VEGFA mRNA. Top panel: the mouse p53-null fibroblast cell line 10.1 transduced with a retrovirus expressing Δ122p53 or the control vector. Bottom panel: control H1299 and Δ133p53β expressing cells

References

    1. Jemal A, et al. Global cancer statistics. CA Cancer J. Clin. 2011;61:69–90. doi: 10.3322/caac.20107. - DOI - PubMed
    1. Gathirua-Mwangi WG, Zhang J. Dietary factors and risk for advanced prostate cancer. Eur. J. Cancer Prev. 2014;23:96–109. doi: 10.1097/CEJ.0b013e3283647394. - DOI - PMC - PubMed
    1. Stark T, Livas L, Kyprianou N. Inflammation in prostate cancer progression and therapeutic targeting. Transl. Androl. Urol. 2015;4:455–463. - PMC - PubMed
    1. Boyd LK, Mao X, Lu YJ. The complexity of prostate cancer: genomic alterations and heterogeneity. Nat. Rev. Urol. 2012;9:652–664. doi: 10.1038/nrurol.2012.185. - DOI - PubMed
    1. Ecke TH, et al. TP53 gene mutations in prostate cancer progression. Anticancer Res. 2010;30:1579–1586. - PubMed

Publication types