. 2019 Aug 20;10(1):3747.
doi: 10.1038/s41467-019-11559-1.

Mapping histone modifications in low cell number and single cells using antibody-guided chromatin tagmentation (ACT-seq)

Affiliations

Mapping histone modifications in low cell number and single cells using antibody-guided chromatin tagmentation (ACT-seq)

Benjamin Carter et al. Nat Commun. .

Erratum in

Abstract

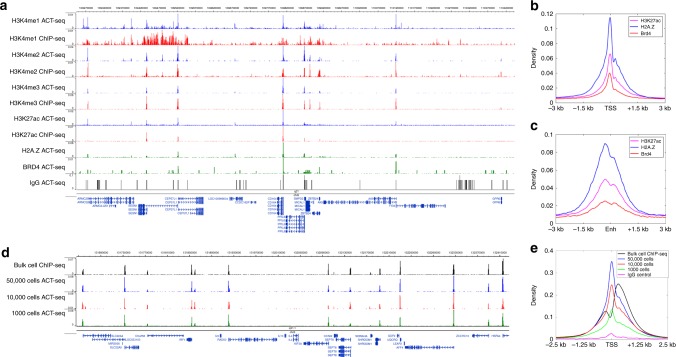
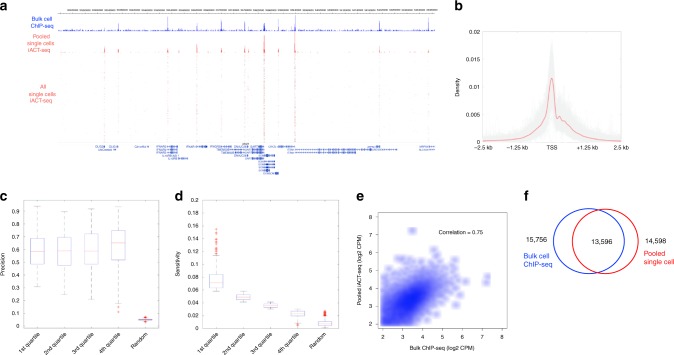
Modern next-generation sequencing-based methods have empowered researchers to assay the epigenetic states of individual cells. Existing techniques for profiling epigenetic marks in single cells often require the use and optimization of time-intensive procedures such as drop fluidics, chromatin fragmentation, and end repair. Here we describe ACT-seq, a streamlined method for mapping genome-wide distributions of histone tail modifications, histone variants, and chromatin-binding proteins in a small number of or single cells. ACT-seq utilizes a fusion of Tn5 transposase to Protein A that is targeted to chromatin by a specific antibody, allowing chromatin fragmentation and sequence tag insertion specifically at genomic sites presenting the relevant antigen. The Tn5 transposase enables the use of an index multiplexing strategy (iACT-seq), which enables construction of thousands of single-cell libraries in one day by a single researcher without the need for drop-based fluidics or visual sorting. We conclude that ACT-seq present an attractive alternative to existing techniques for mapping epigenetic marks in single cells.


Conflict of interest statement

The authors declare no competing interests.

Figures

Fig. 1
Fig. 1
ACT-seq robustly maps epigenetic marks in bulk-cell samples. a Genome browser image depicting enrichment of the indicated epigenetic factors in HEK293T cells at a representative genomic region. Data were obtained using ACT-seq (blue, green) or ChIP-seq (red). The ChIP-seq samples were obtained from published ENCODE data sets. A mock IgG sample (aggregated from all ACT-seq IgG replicates) is included as a comparative control for enrichment. b Metagene profile of average H3K27ac, H2A.Z, and Brd4 enrichment at the transcription start site (TSS) region of annotated genes from the hg19 genome. c Metagene profile of average H3K27ac, H2A.Z, and Brd4 enrichment at enhancer (Enh) regions. Enhancers were identified as regions enriched for H3K27ac that did not overlap with an annotated TSS. d Genome browser image depicting enrichment of H3K4me3 in HEK293T samples of the indicated cell number at a representative genomic region. A published ChIP-seq sample from ENCODE is provided for comparison. e Metagene profile of average H3K4me3 enrichment at the TSS region of annotated genes from the hg19 genome. Samples were obtained using the indicated number of cells. A published ChIP-seq sample from ENCODE is provided for comparison
Fig. 2
Fig. 2
ACT-seq reproducibly maps epigenetic marks in single cells. a Genome browser image of H3K4me3 peaks from bulk-cell ChIP-seq (blue) and pooled iACT-seq (red). The mapped reads from all 1246 individual cells are plotted below the aggregate peaks. Each row represents a single cell. b Metagene profile of H3K4me3 enrichment at the TSS region of genes from the hg18 genome for all single cells. The red line indicates average enrichment for all single cells from the iACT-seq data set. c, d Precision and sensitivity plots for the H3K4me3 scACT-seq data set. These values were calculated in the same manner as was done previously. Data are divided into quartiles with the central marks indicating the median values. The bottom and top edges of the boxes indicate the 25th and 75th percentiles, respectively. The whiskers indicate the boundaries of the data. e Scatter plots depicting the correlation in H3K4me3 peak enrichment in counts per million (CPM) between ENCODE bulk-cell ChIP-seq data (x-axis) and pooled scACT-seq data (y-axes). Peaks identified as enriched using both the ChIP-seq and scACT-seq methods were included. f Venn diagram indicating the numbers of significantly enriched H3K4me3 peaks with at least 1 bp overlap between a bulk-cell ENCODE ChIP-seq data set (blue) and pooled scACT-seq data (red)

References

    1. Lo, P.-K. & Zhou, Q. Emerging techniques in single-cell epigenomics and their applications to cancer research. J. Clin. Genom.1, 10.4172/JCG.1000103 (2018). - PMC - PubMed
    1. Picelli S. Single-cell RNA-sequencing: the future of genome biology is now. RNA Biol. 2016;14:637–650. doi: 10.1080/15476286.2016.1201618. - DOI - PMC - PubMed
    1. Clark SJ, Lee HJ, Smallwood SA, Kelsey G, Reik W. Single-cell epigenomics: powerful new methods for understanding gene regulation and cell identity. Genome Biol. 2016;17:72–72. doi: 10.1186/s13059-016-0944-x. - DOI - PMC - PubMed
    1. Lawrence M, Daujat S, Schneider R. Lateral thinking: how histone modifications regulate gene expression. Trends Genet.: TIG. 2016;32:42–56. doi: 10.1016/j.tig.2015.10.007. - DOI - PubMed
    1. Lai B, et al. Trac-looping measures genome structure and chromatin accessibility. Nat. Methods. 2018;15:741–747. doi: 10.1038/s41592-018-0107-y. - DOI - PMC - PubMed

Publication types

MeSH terms