. 2019 Aug 20;10(1):3407.
doi: 10.1038/s41467-019-11276-9.

Integrative and comparative genomic analyses identify clinically relevant pulmonary carcinoid groups and unveil the supra-carcinoids

Affiliations

Integrative and comparative genomic analyses identify clinically relevant pulmonary carcinoid groups and unveil the supra-carcinoids

N Alcala et al. Nat Commun. .

Abstract

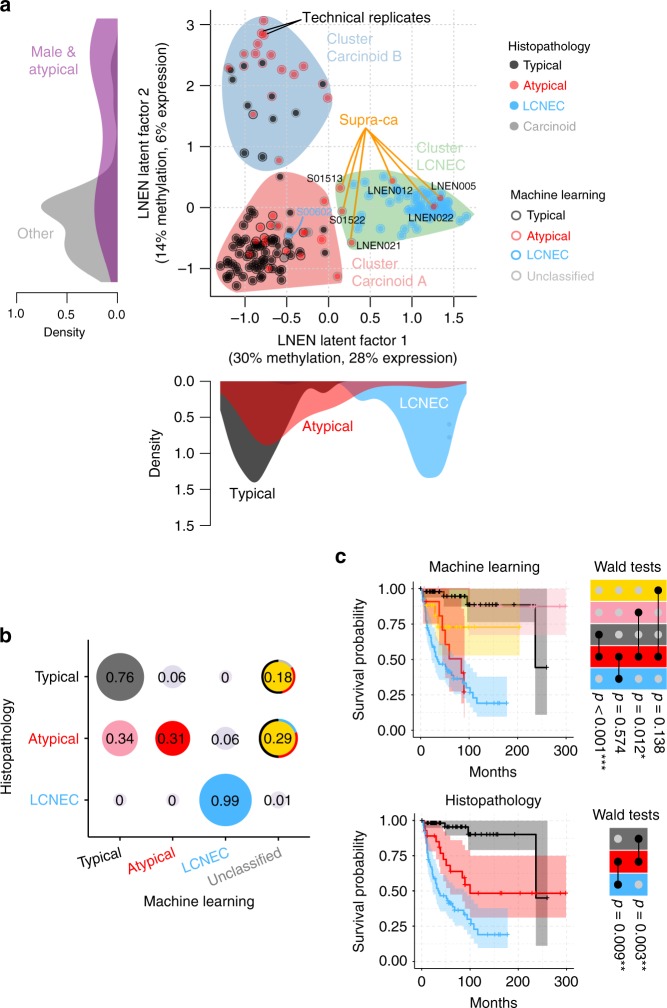
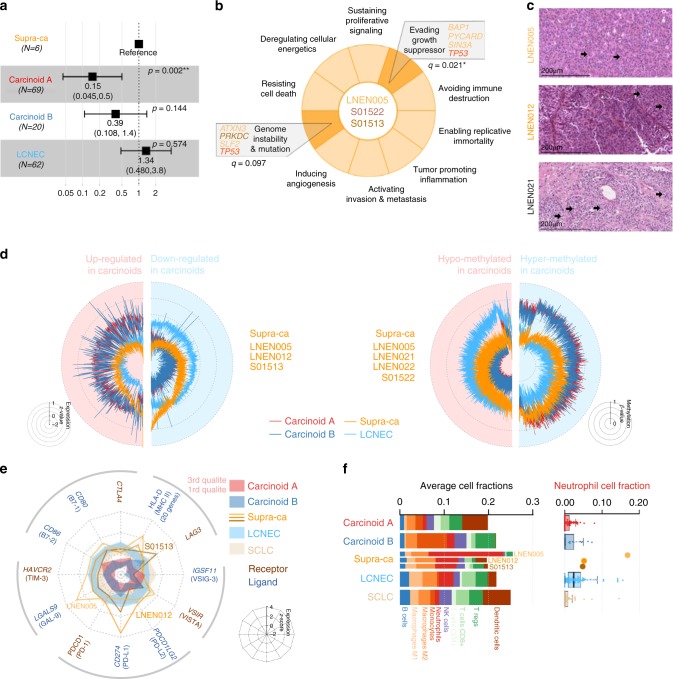
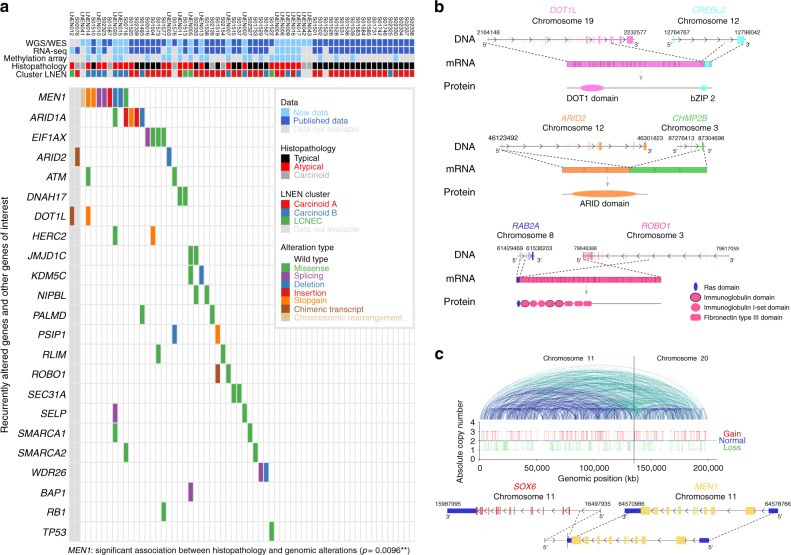
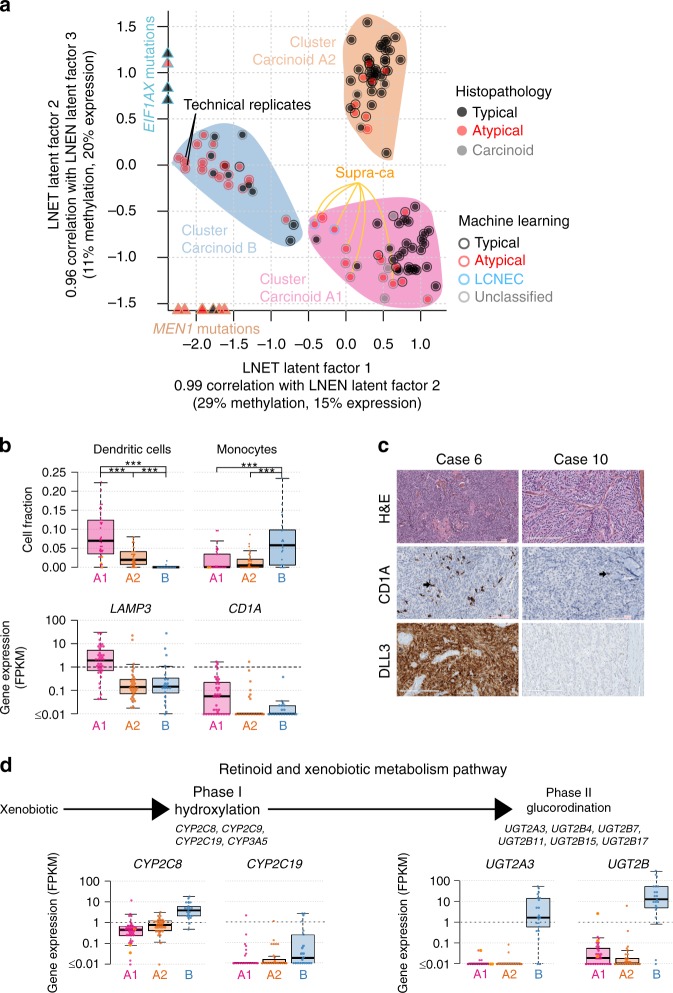
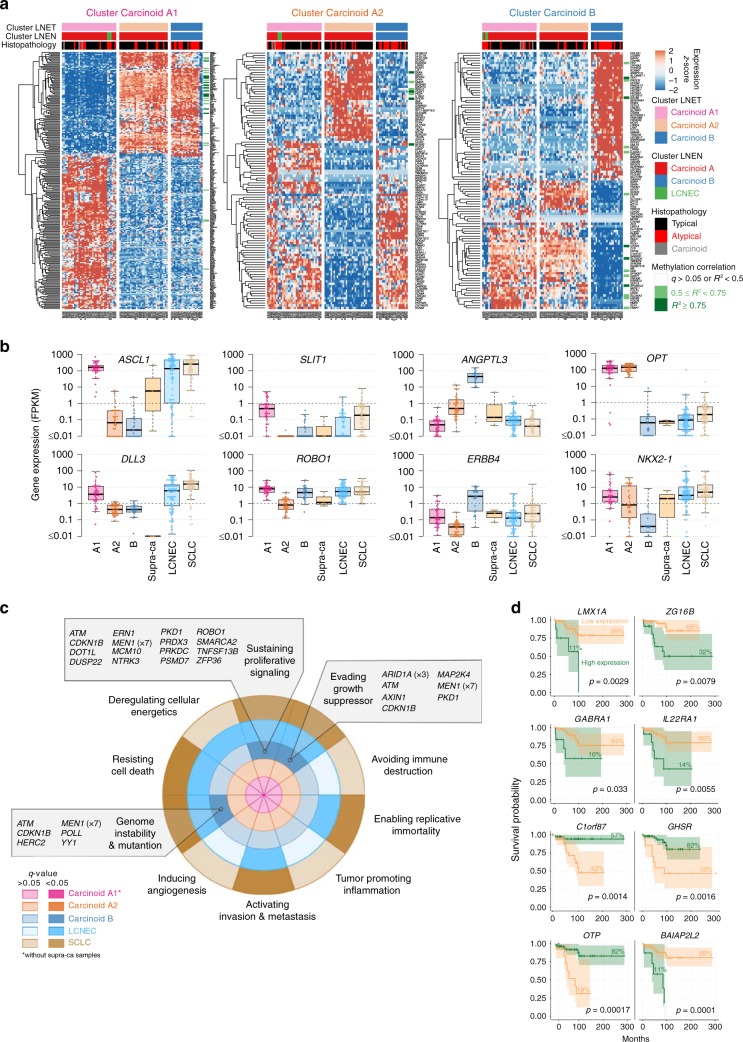
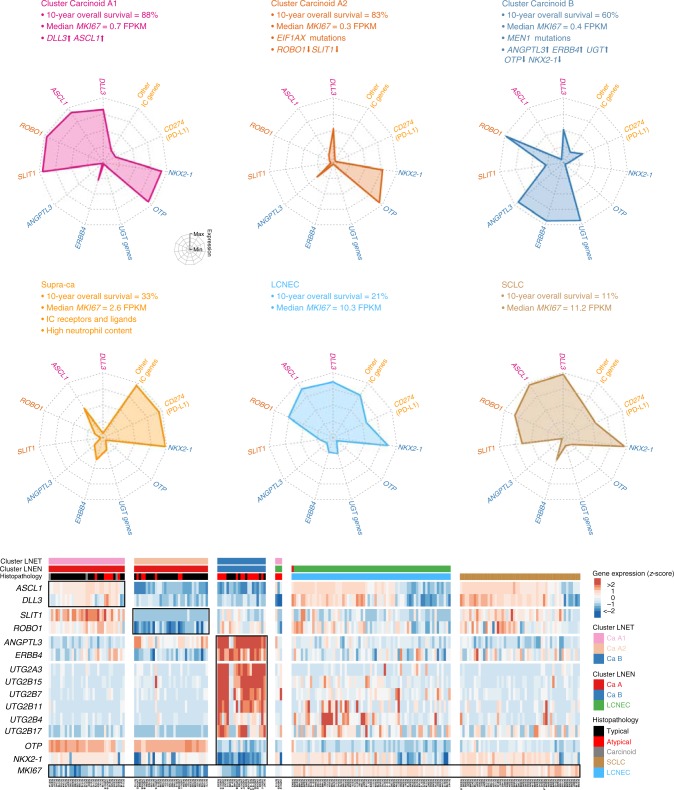
The worldwide incidence of pulmonary carcinoids is increasing, but little is known about their molecular characteristics. Through machine learning and multi-omics factor analysis, we compare and contrast the genomic profiles of 116 pulmonary carcinoids (including 35 atypical), 75 large-cell neuroendocrine carcinomas (LCNEC), and 66 small-cell lung cancers. Here we report that the integrative analyses on 257 lung neuroendocrine neoplasms stratify atypical carcinoids into two prognostic groups with a 10-year overall survival of 88% and 27%, respectively. We identify therapeutically relevant molecular groups of pulmonary carcinoids, suggesting DLL3 and the immune system as candidate therapeutic targets; we confirm the value of OTP expression levels for the prognosis and diagnosis of these diseases, and we unveil the group of supra-carcinoids. This group comprises samples with carcinoid-like morphology yet the molecular and clinical features of the deadly LCNEC, further supporting the previously proposed molecular link between the low- and high-grade lung neuroendocrine neoplasms.


Conflict of interest statement

The authors declare no competing interests. Where authors are identified as personnel of the International Agency for Research on Cancer/World Health Organisation, the authors alone are responsible for the views expressed in this article and they do not necessarily represent the decisions, policy or views of the International Agency for Research on Cancer/World Health Organisation.

Figures

Fig. 1
Fig. 1
Multi-omics (un)supervised analyses of lung neuroendocrine neoplasms. a Multi-omics factor analysis (MOFA) of transcriptomes and methylomes of LNEN samples (typical carcinoids, atypical carcinoids, and LCNEC). Point colours correspond to the histopathological types; coloured circles correspond to predictions of histopathological types by a machine learning (ML) algorithm (random forest classifier) outlined in b; filled coloured shapes represent the three molecular clusters identified by consensus clustering. The density of clinical variables that are significantly associated with a latent factor (ANOVA q-value < 0.05) are represented by kernel density plots next to each axis: histopathological type for latent factor 1, sex and histopathological type for latent factor 2. b Confusion matrix associated with the ML predictions represented on a. The different colours highlight the prediction groups considered in the survival analysis and the colours for machine learning are consistent between panel b and upper panel c. Black represents typical carcinoids predicted as typical, pink represents atypical carcinoids predicted as typical, red represents atypical carcinoids predicted as atypical, and blue represents LCNEC samples predicted as LCNEC. For the unclassified category, the most likely classes inferred from the ML algorithm are represented by coloured arcs (black for typical, red for atypical, blue for LCNEC, and light grey for discordant methylation-based and expression-based predictions). c Kaplan–Meier curves of overall survival of the different ML predictions groups (upper panel) and histopathological types (lower panel). Upper panel: colours of predicted groups match panel b. Lower panel: black-typical, red-atypical, blue-LCNEC. Next to each Kaplan–Meier plot, matrix layouts represent pairwise Wald tests between the reference group and the other groups, and the associated p-values; 0.01 ≤ p < 0.05, 0.001 ≤ p < 0.01, and p < 0.001 are annotated by one, two, and three stars, respectively. Data necessary to reproduce the figure are provided in Supplementary Data 1
Fig. 2
Fig. 2
Molecular characterisation of supra-carcinoids. a Forest plot of hazard ratios for overall survival of the supra-carcinoids, compared to Carcinoid A and B, and LCNEC. The number of samples (N) in each group is given in brackets. The black box represent estimated hazard ratios and whiskers represent the associated 95% confidence intervals. Wald test p-values are shown on the right. b Enrichment of hallmarks of cancer for somatic mutations in supra-carcinoids. Dark colours highlight significantly enriched hallmarks at the 10% false discovery rate threshold; corresponding mutated genes are listed in the boxes, and enrichment q-values are reported below. c Hematoxylin and Eosin (H&E) stains of three supra-carcinoids. In all cases, an organoid architecture with tumour cells arranged in lobules or nests, forming perivascular palisades and rosettes is observed; original magnification x200. Arrows indicate mitoses. d Radar charts of expression and methylation levels. Each radius corresponds to a feature (gene or CpG site), with low values close to the centre and high values close to the edge. Coloured lines represent the mean of each group. Left panel: expression z-scores of genes differentially expressed between clusters Carcinoid A and LCNEC or between Carcinoid B and LCNEC. Right panel: methylation β-values of differentially methylated positions between Carcinoid A and LCNEC clusters or between Carcinoid B and LCNEC clusters. e Radar chart of the expression z-scores of immune checkpoint genes (ligands and receptors) of each group. f Left panel: average proportion of immune cells in the tumour sample for each group, as estimated from transcriptomic data using software quanTIseq. Right panel: boxplot and beeswarm plot (coloured points) of the estimated proportion of neutrophils, where centre line represents the median and box bounds represent the inter-quartile range (IQR). The whiskers span a 1.5-fold IQR or the highest and lowest observation values if they extend no further than the 1.5-fold IQR. Data necessary to reproduce the figure are provided in Supplementary Data 1, 4, 5, 12, 17, and in the European Genome-phenome Archive
Fig. 3
Fig. 3
Mutational patterns of pulmonary carcinoids. a Recurrent and cancer-relevant altered genes found in pulmonary carcinoids by WGS and WES. Fisher’s exact test p-value for the association between MEN1 and the atypical carcinoid histopathological subtype is given in brackets; 0.01 ≤ p < 0.05, 0.001 ≤ p < 0.01, and p < 0.001 are annotated by one, two, and three stars, respectively. b Chimeric transcripts affecting the protein product of DOT1L (upper panel), ARID2 (middle panel), and ROBO1 (lower panel). For each chimeric transcript the DNA row represents genes with their genomic coordinates, the mRNA row represents the chimeric transcript, and the protein row represents the predicted fusion protein. c Chromotripsis case LNEN041, including an inter-chromosomic rearrangement between genes MEN1 and SOX6. Upper panel: copy number as a function of the genomic coordinates on chromosomes 11 and 20; a solid line separates chromosomes 11 and 20. Blue and green lines depict intra- and inter-chromosomic rearrangements, respectively. Lower panel: MEN1 chromosomic rearrangement observed in this chromotripsis case. Data necessary to reproduce the figure are provided in Supplementary Data 4, 7, and 8
Fig. 4
Fig. 4
Multi-omics unsupervised analysis of lung neuroendocrine tumours. a Multi-omics factor analysis (MOFA) of transcriptomes and methylomes restricted to LNET samples (pulmonary carcinoids). Design follows that of Fig. 1a; filled coloured shapes represent the three molecular clusters (Carcinoid A1, A2, and B) identified by consensus clustering. The position of samples harbouring mutations significantly associated with a latent factor (ANOVA q-value < 0.05) are highlighted by coloured triangles on the axes. b Upper panel: boxplots of the proportion of dendritic cells in the different molecular clusters (Carcinoid A1, A2, and B) and the supra-carcinoids, estimated from transcriptomic data using quanTIseq (Methods). The permutation test q-value range is given above each comparison: q-value < 0.001 is annotated by three stars. Lower panel: boxplots of the expression levels of LAMP3 (CDLAMP) and CD1A. c DLL3 and CD1A immunohistochemistry of two typical carcinoids: case 6 (DLL3+ and CD1A+), and case 10 (DLL3- and CD1A-). Upper panels: Hematoxylin & Eosin Saffron (H&E) stain. Middle panels: staining with CD1 rabbit monoclonal antibody (cl EP3622; VENTANA), where arrows show positive stainings. Lower panels: Staining with DLL3 assay (SP347; VENTANA). d Expression levels of genes from the retinoid and xenobiotic metabolism pathway—the most significantly associated with MOFA latent factor 1—in the different molecular clusters. Upper panel: schematic representation of the phases of the pathway. Lower panel: boxplot of expression levels of CYP2C8 and CYP2C19 (both from the CYP2C gene cluster on chromosome 10), UGT2A3, and the total expression of UGT2B genes (from the UGT2 gene cluster on chromosome 4), expressed in fragments per kilobase million (FPKM) units. In all panels, boxplot centre line represents the median and box bounds represent the inter-quartile range (IQR). The whiskers span a 1.5-fold IQR or the highest and lowest observation values if they extend no further than the 1.5-fold IQR. Data necessary to reproduce the figure are provided in Supplementary Data 1, 4, 9, and in the European Genome-phenome Archive
Fig. 5
Fig. 5
Molecular groups of pulmonary carcinoids. a Heatmaps of the expression of core differentially expressed genes of each molecular cluster, i.e., genes that are differentially expressed in all pairwise comparisons between a focal cluster and the other clusters. Green bars at the right of each heatmap indicate a significant negative correlation with the methylation level of at least one CpG site from the gene promoter region. The colour scale depends on the range of q-value (q) and squared correlation estimate () of the correlation test. b Boxplots of the expression levels of selected cancer-relevant core genes, in fragment per kilobase million (FPKM) units, where centre line represents the median and box bounds represent the inter-quartile range (IQR). The whiskers span a 1.5-fold IQR or the highest and lowest observation values if they extend no further than the 1.5-fold IQR. c Characteristic hallmarks of cancer in each molecular cluster (Carcinoid A1 without the supra-carcinoids, A2, and B), LCNEC, and SCLC. Coloured concentric circles correspond to the molecular clusters. For each cluster, dark colours highlight significantly enriched hallmarks (Fisher’s exact test q-value < 0.05). The mutated genes contributing to a given hallmark are listed in the boxes. Recurrently mutated genes are indicated in brackets by the number of samples harbouring a mutation. d Survival analysis of pulmonary carcinoids based on the expression level of eight core genes of cluster Carcinoid B. The genes were selected using a regularised GLM on expression data. For each gene, coloured lines correspond to the Kaplan–Meier curve of overall survival for individuals with a high (green) and low (orange) expression level of this gene. Cutoffs for the two groups were determined using maximally selected rank statistics (Methods). The percentage of samples in each group is represented above each Kaplan–Meier curve and the logrank test p-value is given in bottom right for each gene. Data necessary to reproduce the figure are provided in Supplementary Data 5, 10, and in the European Genome-phenome Archive
Fig. 6
Fig. 6
Main molecular and clinical characteristics of lung neuroendocrine neoplasms. Upper panel: Radar charts of the expression level (z-score) of the characteristic genes [DLL3, ASCL1, ROBO1, SLIT1, ANGPTL3, ERBB4, UGT genes family, OTP, NKX2-1, PD-L1 (CD274), and other immune checkpoint genes] of each LNET molecular cluster (Carcinoid A1, Carcinoid A2, and B clusters), supra-ca, LCNEC, and SCLC. The coloured text lists relevant characteristics—additional molecular, histopathological, and clinical data—of each group. Lower panel: heatmap of the expression level (z-score) of the characteristic genes of each group from the left panel, expressed in z-scores. Data necessary to reproduce the figure are provided in the European Genome-phenome Archive

References

    1. Travis WD, et al. The 2015 World Health Organization Classification of lung tumors: impact of genetic, clinical and radiologic advances since the 2004 classification. J. Thorac. Oncol. 2015;10:1243–1260. doi: 10.1097/JTO.0000000000000630. - DOI - PubMed
    1. Rindi Guido, Klimstra David S., Abedi-Ardekani Behnoush, Asa Sylvia L., Bosman Frederik T., Brambilla Elisabeth, Busam Klaus J., de Krijger Ronald R., Dietel Manfred, El-Naggar Adel K., Fernandez-Cuesta Lynnette, Klöppel Günter, McCluggage W. Glenn, Moch Holger, Ohgaki Hiroko, Rakha Emad A., Reed Nicholas S., Rous Brian A., Sasano Hironobu, Scarpa Aldo, Scoazec Jean-Yves, Travis William D., Tallini Giovanni, Trouillas Jacqueline, van Krieken J. Han, Cree Ian A. A common classification framework for neuroendocrine neoplasms: an International Agency for Research on Cancer (IARC) and World Health Organization (WHO) expert consensus proposal. Modern Pathology. 2018;31(12):1770–1786. doi: 10.1038/s41379-018-0110-y. - DOI - PMC - PubMed
    1. Caplin ME, et al. Pulmonary neuroendocrine (carcinoid) tumors: European Neuroendocrine Tumor Society expert consensus and recommendations for best practice for typical and atypical pulmonary carcinoids. Ann. Oncol. 2015;26:1604–1620. doi: 10.1093/annonc/mdv041. - DOI - PubMed
    1. Swarts DR, et al. Interobserver variability for the WHO classification of pulmonary carcinoids. Am. J. Surg. Pathol. 2014;38:1429–1436. doi: 10.1097/PAS.0000000000000300. - DOI - PubMed
    1. Thunnissen E, et al. The Use of immunohistochemistry improves the diagnosis of small cell lung cancer and its differential diagnosis. An international reproducibility study in a demanding set of cases. J. Thorac. Oncol. 2017;12:334–346. doi: 10.1016/j.jtho.2016.12.004. - DOI - PubMed

Publication types

MeSH terms