. 2019 Aug 20;9(1):12134.
doi: 10.1038/s41598-019-48643-x.

Diet, digestion and energy intake in captive common marmosets (Callithrix jacchus): research and management implications

Affiliations

Diet, digestion and energy intake in captive common marmosets (Callithrix jacchus): research and management implications

Michael L Power et al. Sci Rep. .

Abstract

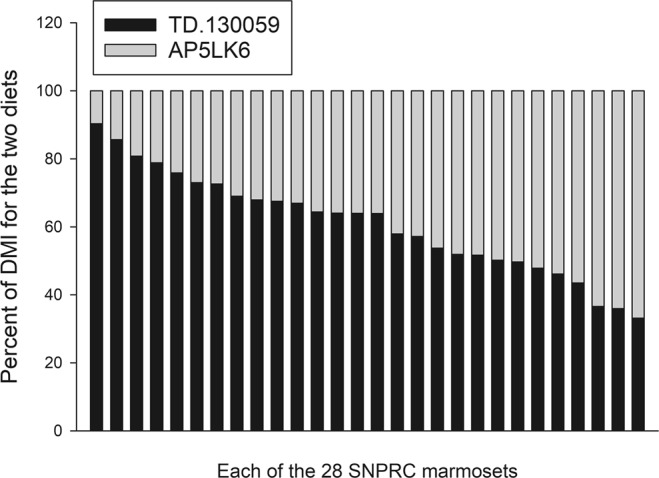
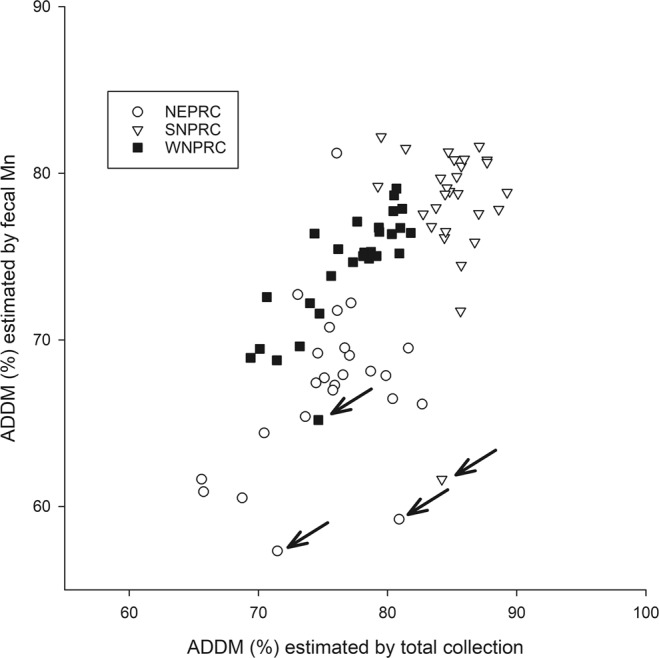
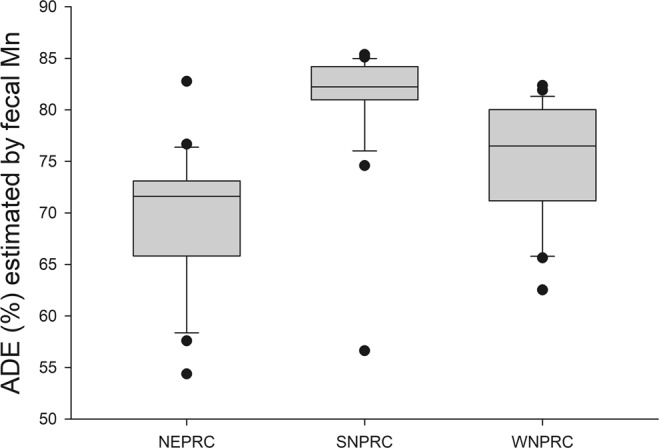
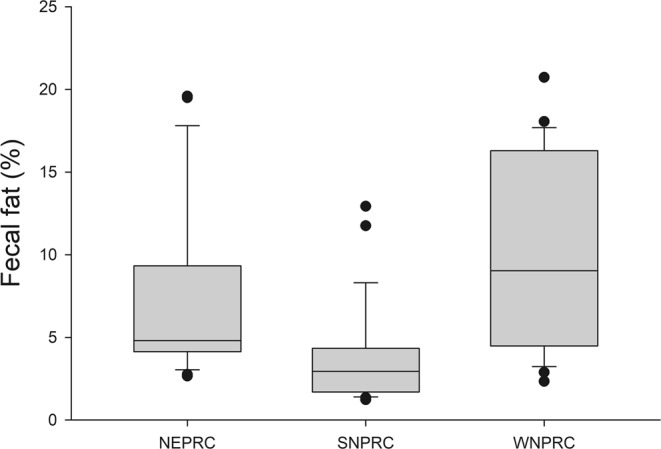
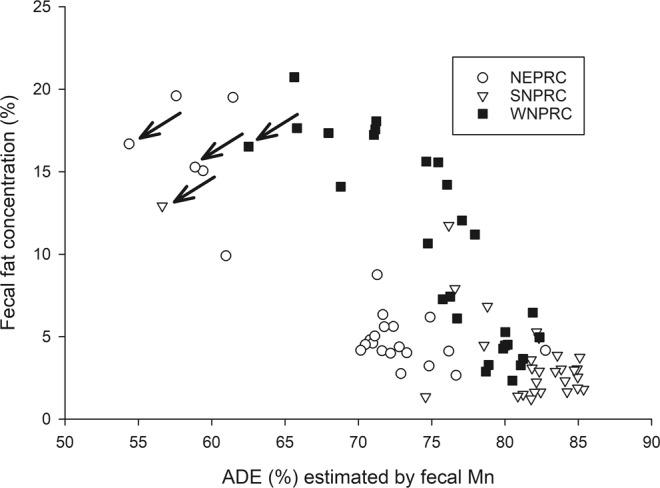
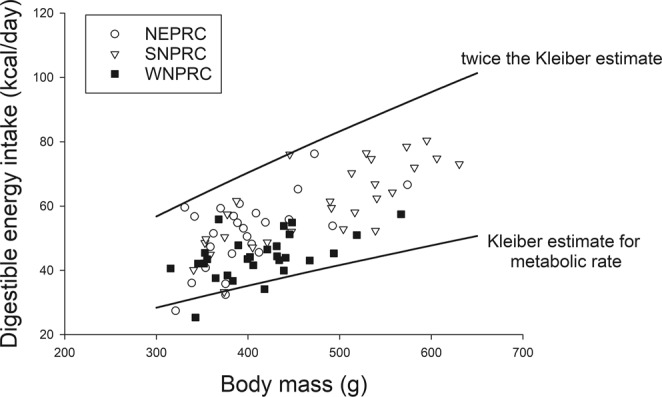
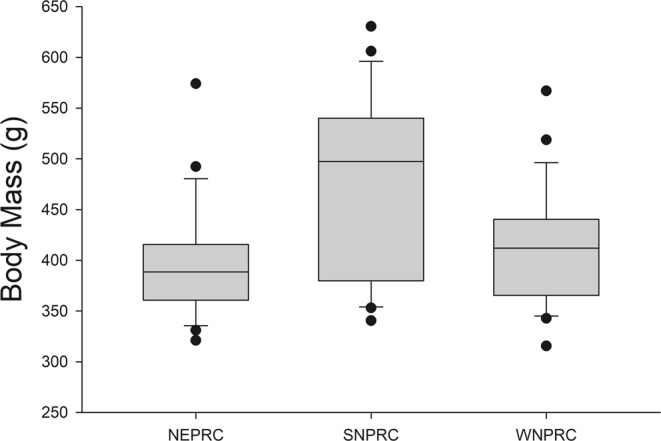
Common marmosets (Callithrix jacchus) are susceptible to intestinal inflammation which leads to chronic diarrhea, weight loss, and vitamin D deficiency. We examined food intake and digestion in three mixed-sex groups of adult marmosets maintained on three commercial base diets. Animals underwent two consecutive 4-day digestion trials. Body mass stayed constant. Feces and diet were assayed for Mn, fat, and gross energy (GE). Apparent digestibility of dry matter (ADDM) was calculated by the total collection method and from dietary and fecal Mn; the methods produced correlated results (r = 0.658, p < 0.001). Apparent digestibility of energy (ADE) was calculated from ADDM and the GE of feces and diet; apparent digestibility of fat (ADfat) was calculated from ADDM and fecal fat. ADDM and ADE varied by diet (p < 0.001). We found poor digesters on all three diets. The concentration of fecal fat was inversely related to ADE (r = -0.729, p < 0.001). High fecal fat (>10%) was associated with ADfat of zero, consistent with lipid malabsorption. Mean digestible energy intake (DEI) was equal to 1.5 the estimated metabolic rate, but varied widely between individuals. The diet with the fewest animals with high fecal fat had the highest mean DEI and most animals above 450 g, suggesting it may be obesogenic.


Conflict of interest statement

The authors declare no competing interests.

Figures

Figure 1
Figure 1
The percent of dry matter intake (DMI) from the purified diet (Envigo TD.130059) and Purina LabDiet AP5LK6 diet by individual SNPRC animals. SNPRC animals always had a choice between the two diets. Each column represents the mean proportional intake of the diets by one of the 28 SNPRC marmosets.
Figure 2
Figure 2
The relationship between apparent dry matter digestibility (ADDM) estimated by the total collection method and by fecal Mn concentration (r = 0.658, p < 0.001). Two animals on the NEPRC diet, one on the SNPRC diet, and one on the WNPRC diet had estimates of ADDM by fecal Mn that were more divergent from their estimate by total collection than the other values (arrows).
Figure 3
Figure 3
Box plots of the apparent digestibility of energy (ADE) by diet. The line within represents the median, the box comprises the 25th percentile to the 75th percentile. The whiskers (error bars) go from the 10th percentile to the 90th percentile. Points outside the whiskers indicate the outliers.
Figure 4
Figure 4
Box plots of the percentage of fecal fat by diet. The line within represents the median, the box comprises the 25th percentile to the 75th percentile. The whiskers (error bars) go from the 10th percentile to the 90th percentile. Points outside the whiskers indicate the outliers.
Figure 5
Figure 5
The relationship between apparent digestibility of energy (ADE) and fecal fat concentration for all animals. The four animals that had anomalously high apparent digestibility of dry matter (ADDM) by the total collection method compared to their estimate of ADDM by fecal Mn all had high fecal fat (arrows).
Figure 6
Figure 6
The relationship between digestible energy intake and body mass for all animals. The Kleiber estimate for daily metabolic rate (MR) is: MR = 70 * (body mass in kg)0.75. The two trend lines give the Kleiber MR estimate and the value for twice the Kleiber MR estimate.
Figure 7
Figure 7
Box plots of body mass by diet. The line within represents the median, the box comprises the 25th percentile to the 75th percentile. The whiskers (error bars) go from the 10th percentile to the 90th percentile. Points outside the whiskers indicate the outliers.

References

    1. Mansfield K. Marmoset models commonly used in biomedical research. J Am Assoc Lab Anim Sci. 2003;53(4):383–392. - PubMed
    1. Tardif SD, Mansfield KG, Ratnam R, Ross CN, Ziegler TE. The marmoset as a model of aging and age-related diseases. ILAR J. 2011;52(1):54–65. doi: 10.1093/ilar.52.1.54. - DOI - PMC - PubMed
    1. Power, M. L. & Koutsos, L. Marmoset nutrition and dietary husbandry in The Common Marmoset in Captivity and Biomedical Research 63–76 (Academic Press, 2019).
    1. Rensing S, Oerke AK. Husbandry and management of New World Species: marmosets and tamarins. The Laboratory Primate. 2005;145:162.
    1. Power ML, Ross CN, Schulkin J, Tardif SD. The development of obesity begins at an early age in captive common marmosets (Callithrix jacchus) Am J Primatol. 2012;74:261–269. doi: 10.1002/ajp.21995. - DOI - PMC - PubMed

Publication types