

Challenging Myths About China's One-Child Policy
- PMID: 31431804
- PMCID: PMC6701844
- DOI: 10.1086/681664
Challenging Myths About China's One-Child Policy
Abstract
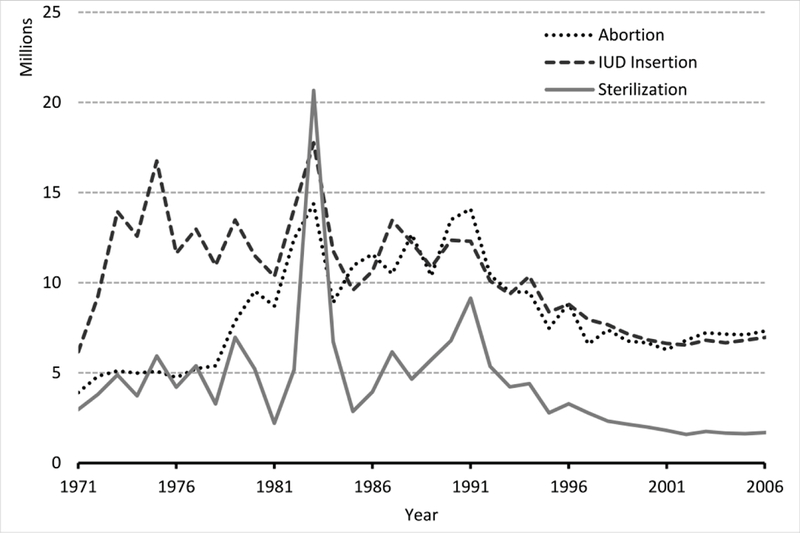
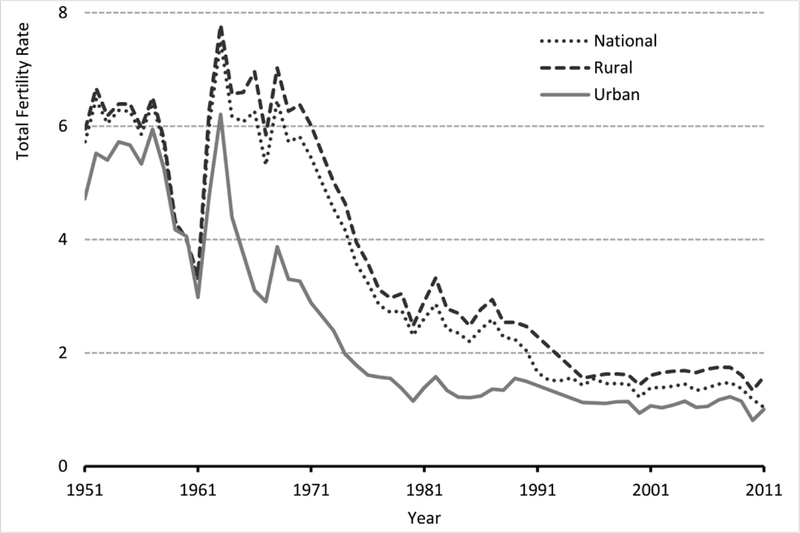
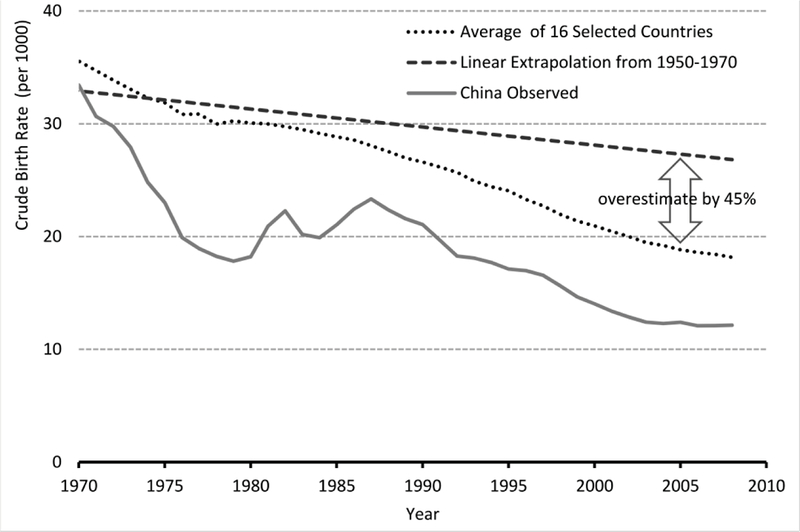
China's controversial one-child policy continues to generate controversy and misinformation. This essay challenges several common myths: that Mao Zedong consistently opposed efforts to limit China's population growth; that as a result China's population continued to grow rapidly until after his death, necessitating the switch to mandatory and coercive birth limits; that the launching of the one-child policy in 1980 led to a dramatic decline in China's fertility rate; and that due to the one-child policy, China and the world benefited from 400 million births that were thereby prevented. Evidence is presented contradicting each of these claims: that Mao Zedong at times forcefully advocated strict limits on births and presided over a major switch from voluntary to coercive birth planning after 1970 (not 1980); that as much as 3/4 of the decline in fertility in China since 1970 occurred prior to the launching of the one-child policy; that fertility levels fluctuated and even rose in some years after the one-child policy was launched; and that most of the further decline in Chinese fertility since 1980 can be attributed to economic development, not to coercive enforcement of birth limits.
Figures
Similar articles
-
The Astonishing Population Averted by China's Birth Restrictions: Estimates, Nightmares, and Reprogrammed Ambitions.Demography. 2017 Aug;54(4):1375-1400. doi: 10.1007/s13524-017-0595-x. Demography. 2017. PMID: 28762036
-
An investigation of women's attitudes towards fertility and China's family planning policy.J Biosoc Sci. 2010 May;42(3):359-75. doi: 10.1017/S0021932009990551. Epub 2009 Dec 18. J Biosoc Sci. 2010. PMID: 20018132
-
The claim that China's fertility restrictions contributed to the use of prenatal sex selection: A sceptical reappraisal.Popul Stud (Camb). 2015;69(3):263-79. doi: 10.1080/00324728.2015.1103565. Popul Stud (Camb). 2015. PMID: 26585182
-
FAR BELOW REPLACEMENT FERTILITY IN URBAN CHINA.J Biosoc Sci. 2017 Nov;49(S1):S4-S19. doi: 10.1017/S0021932017000347. J Biosoc Sci. 2017. PMID: 29160190
-
Review and challenges of policies of environmental protection and sustainable development in China.J Environ Manage. 2008 Sep;88(4):1249-61. doi: 10.1016/j.jenvman.2007.06.019. Epub 2007 Sep 4. J Environ Manage. 2008. PMID: 17767999 Review.
Cited by
-
Chinese culture became more individualistic: Evidence from family structure, 1953-2017.F1000Res. 2023 May 25;12:10. doi: 10.12688/f1000research.128448.3. eCollection 2023. F1000Res. 2023. PMID: 37476505 Free PMC article.
-
Positive psychology as a strategy for promoting sustainable population policies.Heliyon. 2020 Apr 7;6(4):e03696. doi: 10.1016/j.heliyon.2020.e03696. eCollection 2020 Apr. Heliyon. 2020. PMID: 32280798 Free PMC article.
-
The effect of China's many-child policy on the number of births and the prevalence of serious teratogenic and disabling defects in Hunan Province.BMC Public Health. 2023 Nov 11;23(1):2226. doi: 10.1186/s12889-023-16583-x. BMC Public Health. 2023. PMID: 37951872 Free PMC article.
-
Formal comment on "Assessing the impact of the 'one-child policy' in China: A synthetic control approach".PLoS One. 2019 Nov 6;14(11):e0222705. doi: 10.1371/journal.pone.0222705. eCollection 2019. PLoS One. 2019. PMID: 31693668 Free PMC article.
-
A decomposition study on the factors influencing China's total fertility rate changes between 1990 and 2020.Sci Rep. 2024 Nov 15;14(1):28176. doi: 10.1038/s41598-024-79999-4. Sci Rep. 2024. PMID: 39548321 Free PMC article.
Grants and funding
LinkOut - more resources
Full Text Sources
Other Literature Sources