. 2019 Jan 17:1:100004.
doi: 10.1016/j.fochx.2019.100004. eCollection 2019 Mar 30.

Quantitative and kinetic analyses of peanut allergens as affected by food processing

Affiliations

Quantitative and kinetic analyses of peanut allergens as affected by food processing

Shi Meng et al. Food Chem X. .

Abstract

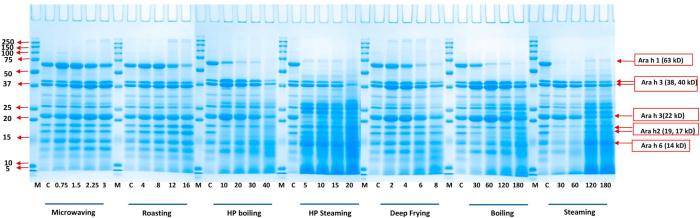
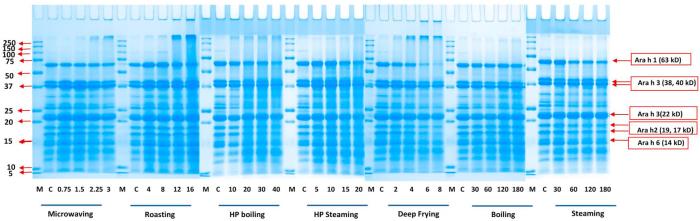
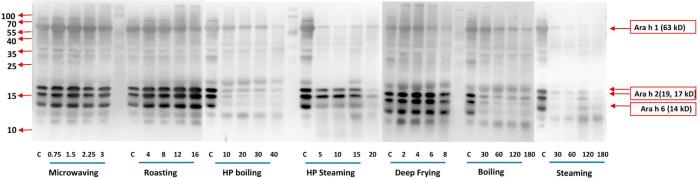
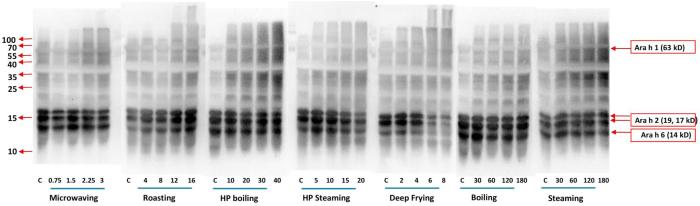
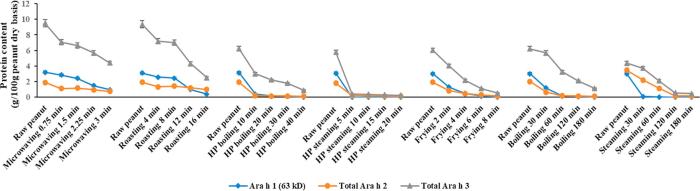
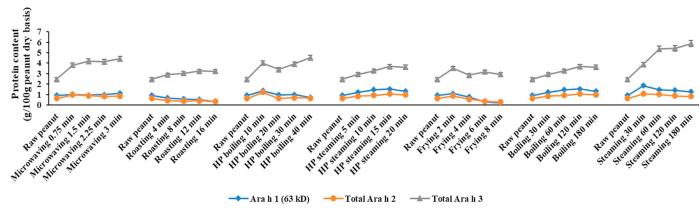
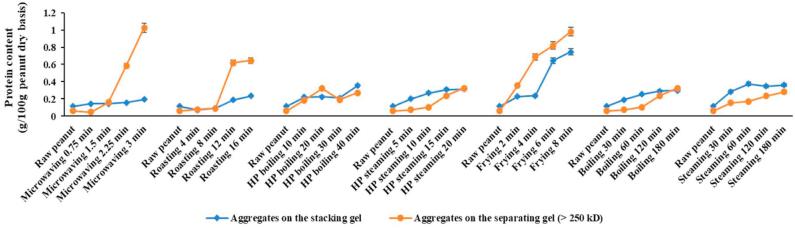
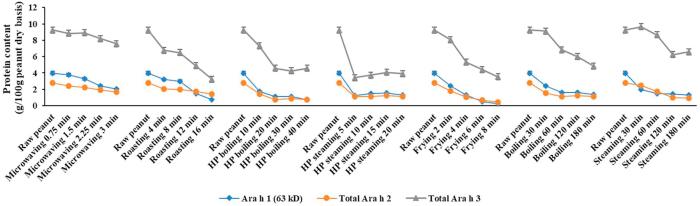
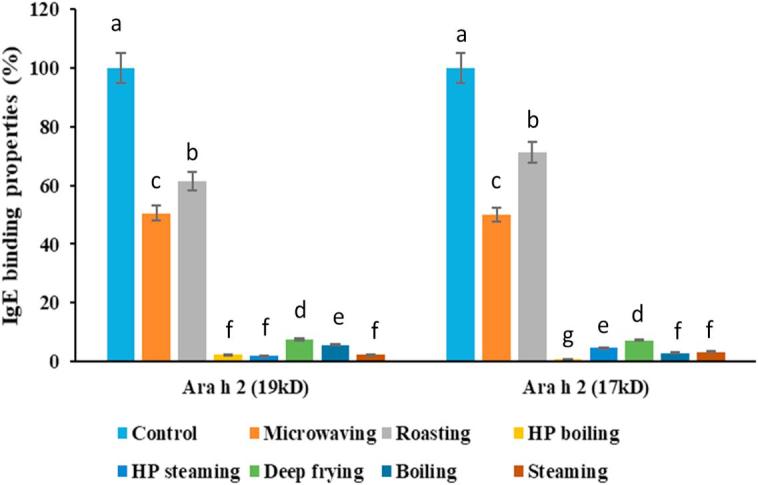
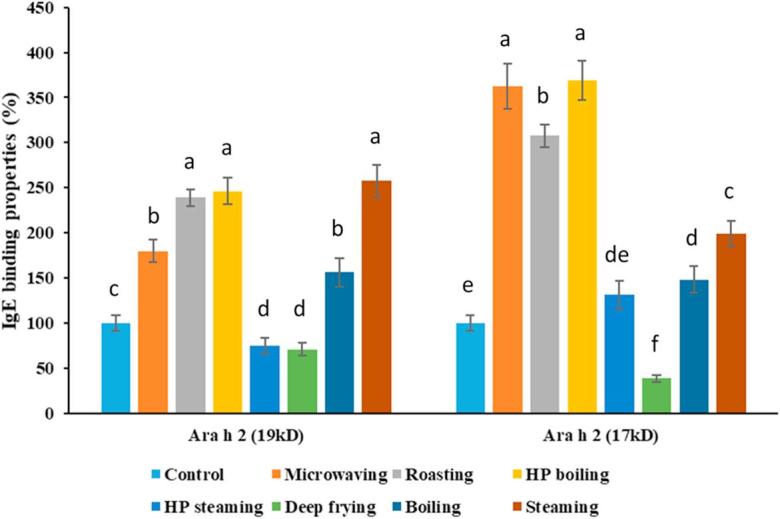
Peanuts contain four major allergens with differences in allergenic potency. Thermal processing can influence the allergenic properties of peanuts. Until now, a kinetic model has not been reported to assess the changes of soluble allergen (extracted from processed peanuts) content as affected by various thermal processing methods. Our objective is to characterize the reaction kinetics of the thermal processing methods, including wet processing (boiling with/without high-pressure, steaming with/without high-pressure), deep-frying and dry processing (microwaving and roasting) using five time intervals. The relationships between processing time and extractable major allergen content could be explained by a simple linear regression kinetic model (except high-pressure steaming). Among all the methods with optimal processing point, frying for 6 min had a relatively lower IgE binding (linear epitopes) ratio, possibly due to the processing conditions, which caused break down, cross-linking and aggregation of Ara h 2, and a relatively lower solubility.

Keywords: IgE-binding properties; Kinetic analysis; Peanut allergen; Protein denaturation; Proximate analysis; SDS-sample-buffer-soluble protein; Thermal processing; Water-soluble protein.


Figures

Fig. 1-A
Fig. 1-A
SDS-PAGE analysis of various thermal processing effects on water-soluble peanut protein. Seven processing methods were conducted at 5 time intervals, respectively. The processing methods and time (min) are shown below corresponding gel, respectively. M represents the molecular mass marker (molecular masses are shown beside the markers). Major allergen of Ara h 1 (63 kD), Ara h 2 (17, 19 kD), Ara h 3 (22, 38, 40 kD) and Ara h 6 (14 kD) are indicated on the right.
Fig. 1-B
Fig. 1-B
SDS-PAGE analysis of various thermal processing effects on SDS-sample-buffer-soluble peanut protein. Seven processing methods were conducted at 5 time intervals, respectively. The processing methods and time (min) are shown below corresponding gel, respectively. M represents the molecular mass marker (molecular masses are shown beside the markers). Major allergen of Ara h 1 (63 kD), Ara h 2 (17, 19 kD), Ara h 3 (22, 38, 40 kD) and Ara h 6 (14 kD) are indicated on the right.
Fig. 2-A
Fig. 2-A
Western-blot analysis of the various thermal processing effects on water-soluble peanut protein. Seven processing methods were conducted at 5 time intervals, respectively. The processing methods and time (min) were labeled below the corresponded membranes, respectively. Molecular masses are shown on the left. Major allergen of Ara h 1 (63 kD), Ara h 2 (17, 19 kD), and Ara h 6 (14 kD) are indicated on the right. Pooled human plasma containing IgE antibody against peanut allergens were used for analysis.
Fig. 2-B
Fig. 2-B
Western-blot analysis of the various thermal processing effects on SDS-sample-buffer-soluble peanut protein. Seven processing methods were conducted at 5 time intervals, respectively. The processing methods and time (min) were labeled below the corresponded membranes, respectively. Molecular masses are shown on the left. Major allergen of Ara h 1 (63 kD), Ara h 2 (17, 19 kD), and Ara h 6 (14 kD) are indicated on the right. Pooled human plasma containing IgE antibody against peanut allergens were used for analysis.
Fig. 3-A
Fig. 3-A
Processing effect on water-soluble allergen content (g/100 g peanut dry basis) based on SDS-PAGE. Quantification analysis of allergen content were based on the band intensities and protein content.
Fig. 3-B
Fig. 3-B
Processing effect on SDS-sample-buffer-soluble allergen content (g/100 g peanut dry basis) based on SDS-PAGE. Quantification analysis of allergen content were based on the band intensities and protein content.
Fig. 3-C
Fig. 3-C
Processing effect on water-insoluble (but SDS-sample-buffer-soluble) aggregate content (g/100 g peanut dry basis) based on SDS-PAGE. Quantification analysis of aggregate content were based on the band intensities and protein content.
Fig. 3-D
Fig. 3-D
Processing effect on peanut total extractable allergen content (g/100 g peanut dry basis) based on SDS-PAGE. Total extractable allergen content was the sum of water-soluble and SDS-sample-buffer-soluble allergen content.
Fig. 4-A
Fig. 4-A
Processing effect on water-soluble allergens (Ara h 2) IgE binding properties. Control represents raw peanuts, all the processing methods’ time were selected with the optimal processing point (Table 1) in this study, respectively. Microwaving: 3 min; Roasting: 12 min; High-pressure boiling: 40 min; High-pressure steaming: 20 min; Deep frying: 6 min; Boiling: 90 min; Steaming: 90 min. The control (raw) peanuts’ total IgE binding properties for each of the Ara h 2 isoforms were set as 100 percent.
Fig. 4-B
Fig. 4-B
Processing effect on SDS-sample-buffer-soluble allergens (Ara h 2) IgE binding properties. Control represents raw peanuts, all the processing methods’ time were selected with the optimal processing point (Table 1) in this study, respectively. Microwaving: 3 min; Roasting: 12 min; High-pressure boiling: 40 min; High-pressure steaming: 20 min; Deep frying: 6 min; Boiling: 90 min; Steaming: 90 min. The control (raw) peanuts’ total IgE binding properties for each of the Ara h 2 isoforms were set as 100 percent.

Similar articles

Cited by

References

    1. AOAC International . 19th ed. Association of Official Analytical Chemists; Gaitherburg, MD: 2012. Official methods of analysis of AOAC international.
    1. Beyer K., Morrowa E., Li X.M., Bardina L., Bannon G.A., Burks A.W., Sampson H.A. Effects of cooking methods on peanut allergenicity. Journal of Allergy and Clinical Immunology. 2001;107:1077–1081. - PubMed
    1. Bradford M.M. A rapid and sensitive method for the quantitation of microgram quantities of protein utilizing the principle of protein-dye binding. Analytical Biochemistry. 1976;72:248–254. - PubMed
    1. Bu G., Luo Y., Chen F., Liu K., Zhu T. Milk processing as a tool to reduce cow’s milk allergenicity: A mini-review. Dairy Science & Technology. 2013;93:211–223. - PMC - PubMed
    1. Bu G., Luo Y., Zheng Z., Zheng H. Effect of heat treatment on the antigenicity of bovine α-lactalbumin and β-lactoglobulin in whey protein isolate. Food and Agricultural Immunology. 2009;20:195–206.

LinkOut - more resources