

Physico-elemental analysis of roasted organic coffee beans from Ethiopia, Colombia, Honduras, and Mexico using X-ray micro-computed tomography and external beam particle induced X-ray emission
- PMID: 31432016
- PMCID: PMC6694858
- DOI: 10.1016/j.fochx.2019.100032
Physico-elemental analysis of roasted organic coffee beans from Ethiopia, Colombia, Honduras, and Mexico using X-ray micro-computed tomography and external beam particle induced X-ray emission
Abstract
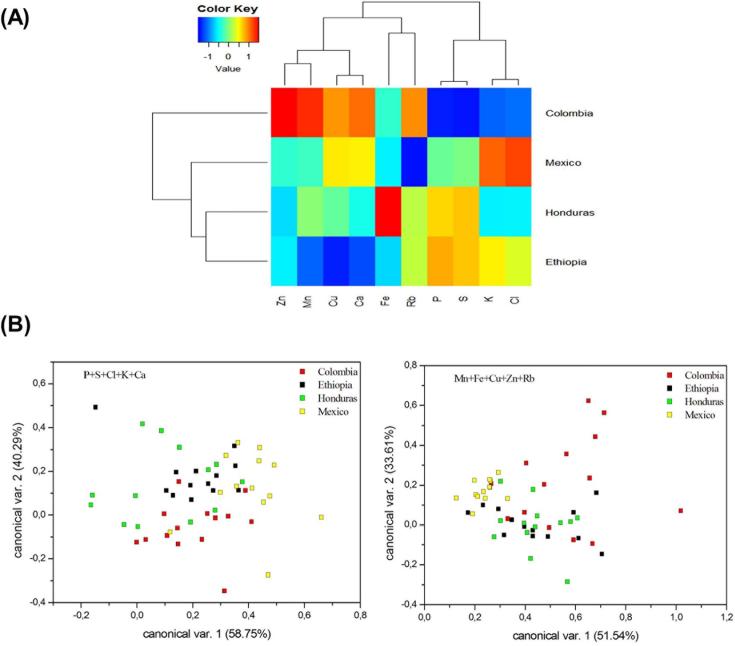
The physico-elemental profiles of commercially attained and roasted organic coffee beans from Ethiopia, Colombia, Honduras, and Mexico were compared using light microscopy, X-ray micro-computed tomography, and external beam particle induced X-ray emission. External beam PIXE analysis detected P, S, Cl, K, Ca, Ti, Mn, Fe, Cu, Zn, Br, Rb, and Sr in samples. Linear discriminant analysis showed that there was no strong association between elemental data and production region, whilst a heatmap combined with hierarchical clustering showed that soil-plant physico-chemical properties may influence regional elemental signatures. Physical trait data showed that Mexican coffee beans weighed significantly more than beans from other regions, whilst Honduras beans had the highest width. X-ray micro-computed tomography qualitative data showed heterogeneous microstructural features within and between beans representing different regions. In conclusion, such multi-dimensional analysis may present a promising tool in assessing the nutritional content and qualitative characteristics of food products such as coffee.
Keywords: Colombia; Ethiopia; External beam PIXE; Honduras; LDA, linear discriminant analysis; Mexico; Organic; PIXE, particle induced X-ray emission; Roasted coffee bean; X-ray micro-computed tomography; micro-CT, X-ray micro-computed tomography.
Conflict of interest statement
The authors declare that they have no known competing financial interests or personal relationships that could have appeared to influence the work reported in this paper.
Figures


References
-
- Cloete, K. J., Šmit, Ž., Minnis-Ndimba, R., Vavpetič, P., & Pelicon, P. (2018). External beam particle induced X-ray emission elemental and physical trait data of organically produced roasted coffee beans from Ethiopia, Colombia, Honduras, and Mexico. Mendeley Data, v1. 10.17632/rs4xcjf69y.1. - DOI - PMC - PubMed
-
- Anderson K.A., Smith B.W. Chemical profiling to differentiate geographic growing origins of coffee. Journal of Agricultural and Food Chemistry. 2002;50:2068–2075. - PubMed
-
- Barbosa R.M., Batista B.L., Varrique R.M., Coelho V.A., Campiglia A.D., Barbosa F., Jr. The use of advanced chemometric techniques and trace element levels for controlling the authenticity of organic coffee. Food Research International. 2014;61:246–251.
-
- Barel M., Jacquet M. Coffee quality: Its causes, appreciation and improvement. Plantations, Recherche, Développement. 1994;4:5–13.
-
- Bart-Plange A., Baryeh E.A. The physical properties of category B cocoa beans. Journal of Food Engineering. 2003;60:219–227.
LinkOut - more resources
Full Text Sources
Research Materials
