. 2019 Oct;16(4):1183-1197.
doi: 10.1007/s13311-019-00774-9.

Computer-Assisted Planning for Stereoelectroencephalography (SEEG)

Affiliations

Computer-Assisted Planning for Stereoelectroencephalography (SEEG)

Vejay N Vakharia et al. Neurotherapeutics. 2019 Oct.

Abstract

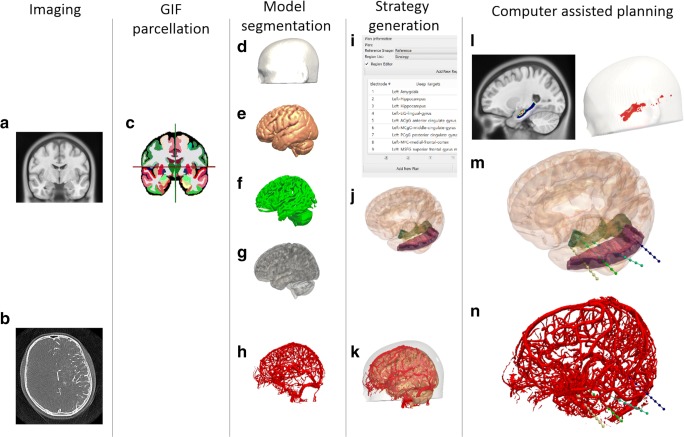
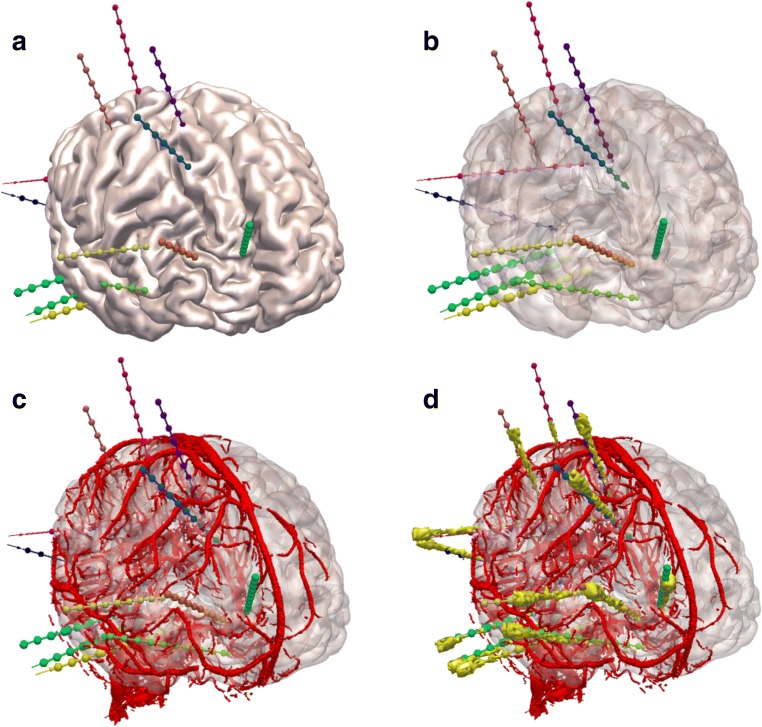
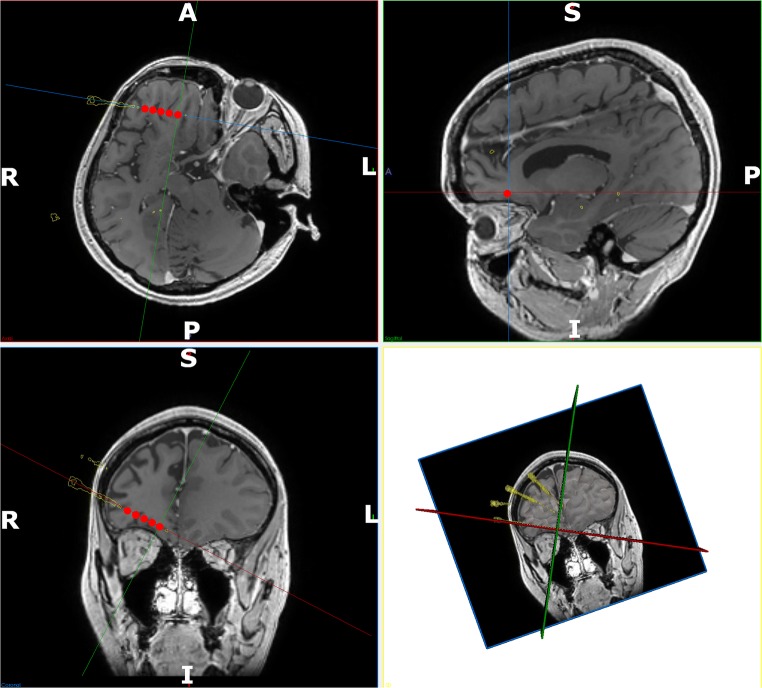
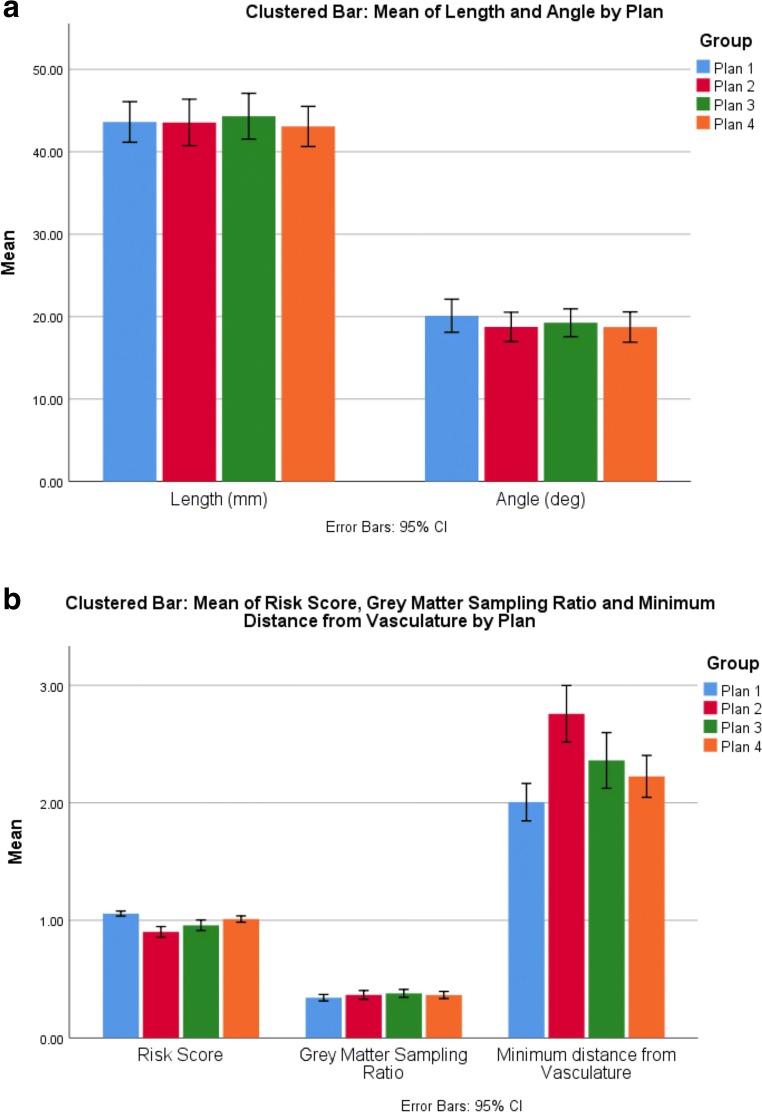
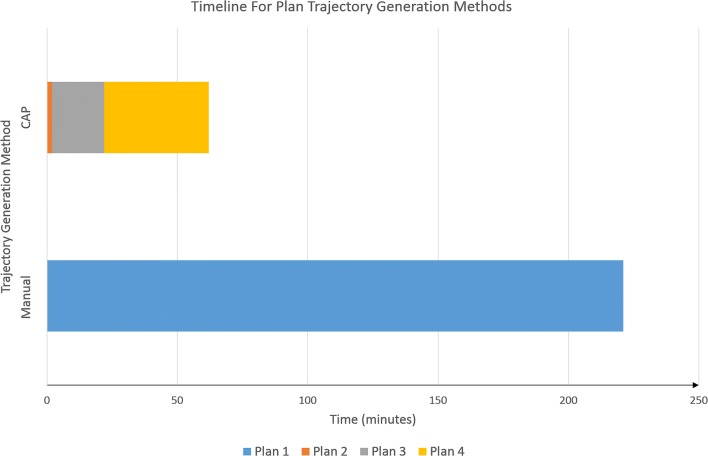
Stereoelectroencephalography (SEEG) is a diagnostic procedure in which multiple electrodes are stereotactically implanted within predefined areas of the brain to identify the seizure onset zone, which needs to be removed to achieve remission of focal epilepsy. Computer-assisted planning (CAP) has been shown to improve trajectory safety metrics and generate clinically feasible trajectories in a fraction of the time needed for manual planning. We report a prospective validation study of the use of EpiNav (UCL, London, UK) as a clinical decision support software for SEEG. Thirteen consecutive patients (125 electrodes) undergoing SEEG were prospectively recruited. EpiNav was used to generate 3D models of critical structures (including vasculature) and other important regions of interest. Manual planning utilizing the same 3D models was performed in advance of CAP. CAP was subsequently employed to automatically generate a plan for each patient. The treating neurosurgeon was able to modify CAP generated plans based on their preference. The plan with the lowest risk score metric was stereotactically implanted. In all cases (13/13), the final CAP generated plan returned a lower mean risk score and was stereotactically implanted. No complication or adverse event occurred. CAP trajectories were generated in 30% of the time with significantly lower risk scores compared to manually generated. EpiNav has successfully been integrated as a clinical decision support software (CDSS) into the clinical pathway for SEEG implantations at our institution. To our knowledge, this is the first prospective study of a complex CDSS in stereotactic neurosurgery and provides the highest level of evidence to date.

Keywords: Clinical decision support software; Computer-assisted planning; EpiNav; Epilepsy; SEEG.


Conflict of interest statement

The authors declare that they have no conflict of interest.

Figures

Fig. 1
Fig. 1
CAP image processing pipeline: imaging modalities required for CAP include a reference image (A), preferably a gadolinium-enhanced T1 image, and a vascular imaging modality (B). A whole brain parcellation (C) is generated from the T1 image. A model of the scalp (D) is generated from the reference image while models of the cortex (E), sulci (F), and gray matter (G) are automatically extracted. Vascular models (H) are derived from the vascular imaging following filter application and mesh cleaning. The implantation schema entry and target points are then selected from the whole brain parcellation (I) and brain ROIs are automatically segmented (J). In this case, amygdala, hippocampus, and lingual gyrus target regions are shown with the middle temporal gyrus as the entry region. A composite image of the scalp, brain, and vasculature is shown (K). Trajectories that exceed length, angle, and critical structure restrictions are removed from consideration. Risk maps for the target structure (only hippocampus shown) and corresponding entry zones are generated (L). CAP trajectories with shortest intracerebral length, orthogonal drilling angles, maximal gray matter sampling, and lowest trajectory risk score are provided (M). Generated trajectories also shown with vascular model (N). ROI = region of interest. Note: for clarity only temporal electrodes are shown
Fig. 2
Fig. 2
EpiNav generated electrode trajectories: example EpiNav generated implantation from patient 13 with suspected right fronto-temporal onset. a Right fronto-lateral view of 3D model of the cortex with the EpiNav generated implantation plan of 13 electrodes. b Transparent cortex to allow visualization of the intracerebral course of the planned electrodes. c Superimposed vessel segmentation from a right internal carotid artery used for precise planning. d Superimposed post-implantation bolt and actual electrode contact segmentation (yellow)
Fig. 3
Fig. 3
Detailed post-implantation view of active contacts: detailed views of the contacts that were active on the right orbitofrontal electrode at the onset of the seizure. Implemented electrode trajectories segmented from the post-operative CT are shown (yellow) and fused with the preoperative MRI. The electrode contacts active at the onset of the seizure are shown in red. These have been accentuated for clarity. In-line trajectory views (top left and bottom left) as well as probes eye view (top right) and 3D model (bottom right) are shown. Note: the orbitofrontal trajectory passes through the gray matter at the depths of the sulci along the orbitofrontal cortex before terminating in the mesial prefrontal cortex. Electrode conflicts with vessels in the sulcus are averted by preventing the trajectory from crossing sulcal pial boundaries
Fig. 4
Fig. 4
Comparative trajectory metrics between plans: a comparison of mean length (mm) and drilling angle to the skull (deg.) and b risk score, gray matter sampling ratio, and minimum distance from vasculature (mm) between the different trajectory generation methods (plans 1–4). Error bars represent 95% confidence intervals
Fig. 5
Fig. 5
Timeline for SEEG implantation generation for CAP and manually generated trajectories: comparative mean timelines for trajectory generation between CAP and manually planned SEEG implantations. Manual trajectory planning is represented by plan 1. CAP planning consisted of automated trajectory generation (plan 2), followed by semi-automated trajectory alterations by cycling through risk-stratified automated trajectories (plan 3) and manual checking and fine adjustments to the CAP trajectories were required (plan 4). Please note, only plan 4 trajectories were implanted into patients

References

    1. De Tisi J, Bell GS, Peacock JL, et al. The long-term outcome of adult epilepsy surgery, patterns of seizure remission, and relapse: a cohort study. Lancet [Internet]. 2011;378:1388–1395. - PubMed
    1. Kovac S, Vakharia VN, Scott C, et al. Invasive epilepsy surgery evaluation. Seizure. 2016;Jan:125–136. - PubMed
    1. Isnard J, Taussig D, Bartolomei F, et al. French guidelines on stereoelectroencephalography (SEEG) Neurophysiol. Clin. [Internet]. 2018;48:5–13. - PubMed
    1. Vakharia VN, Duncan JS, Witt J-AA, et al. Getting the best outcomes from epilepsy surgery. Ann. Neurol. 2018;83:676–690. - PMC - PubMed
    1. Bourdillon P, Ryvlin P, Isnard J, et al. Stereotactic electroencephalography is a safe procedure, including for insular implantations. World Neurosurg. 2017;99:353–361. - PubMed

MeSH terms