. 2019 Nov;20(7-8):538-548.
doi: 10.1080/21678421.2019.1646769. Epub 2019 Aug 21.

Neurofilaments in pre-symptomatic ALS and the impact of genotype

Affiliations

Neurofilaments in pre-symptomatic ALS and the impact of genotype

Michael Benatar et al. Amyotroph Lateral Scler Frontotemporal Degener. 2019 Nov.

Abstract

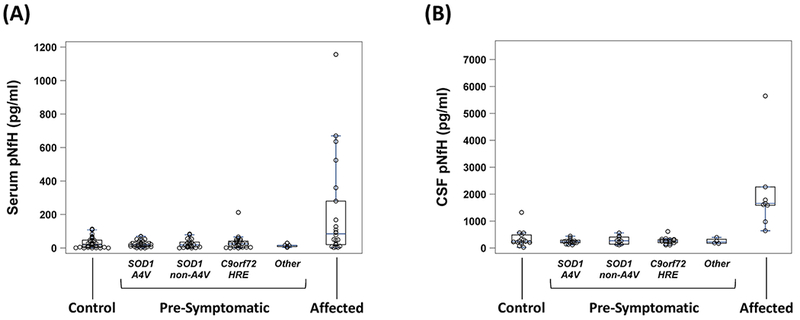
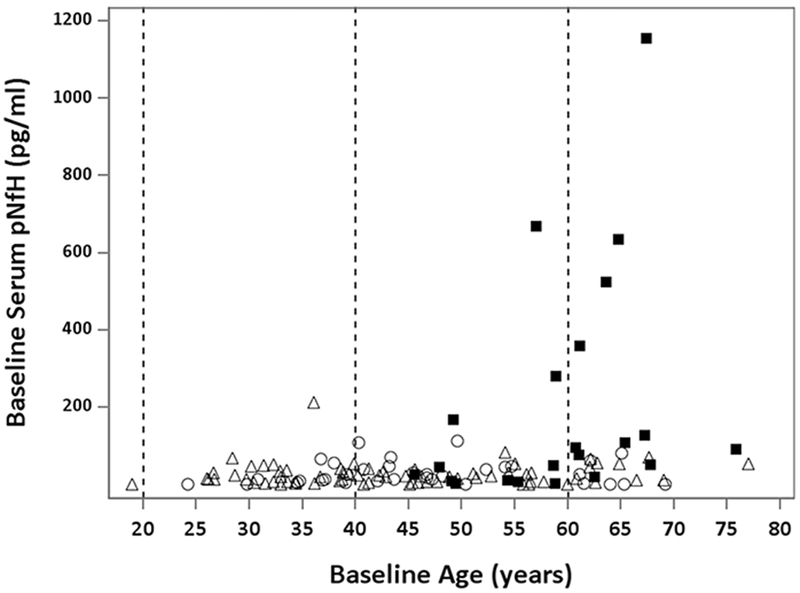
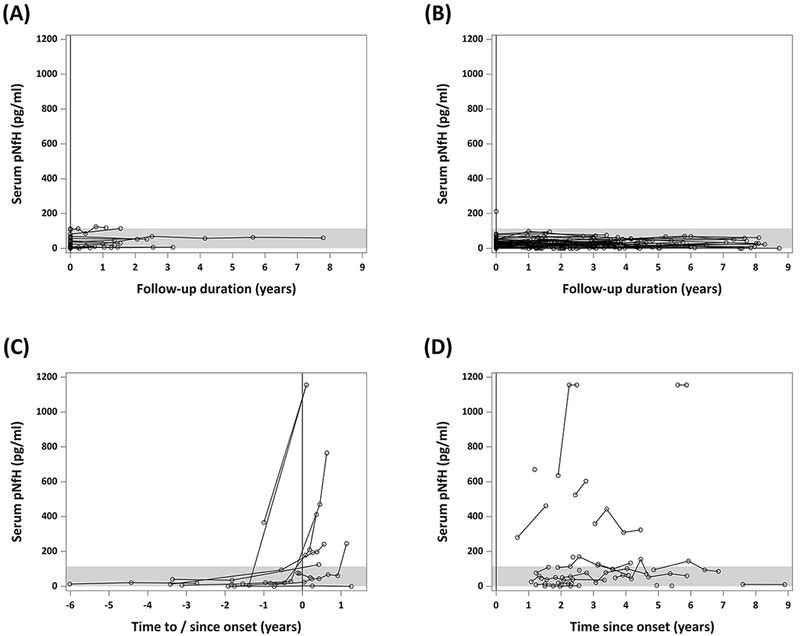
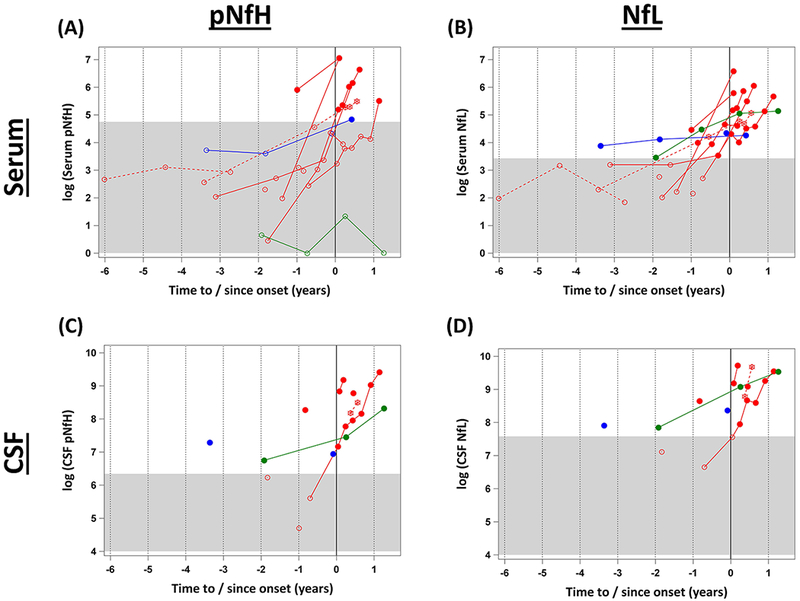
Objective. To evaluate serum and cerebrospinal fluid (CSF) levels of phosphorylated neurofilament heavy (pNfH), and to compare these to levels of neurofilament light (NfL), as biomarkers of pre-symptomatic ALS. Design. The study population includes 34 controls, 79 individuals at-risk for ALS, 22 ALS patients, and 14 phenoconverters. At-risk individuals are enrolled through Pre-Symptomatic Familial ALS (Pre-fALS), a longitudinal natural history and biomarker study of individuals who are carriers of any ALS-associated gene mutation, but who demonstrate no clinical evidence of disease at the time of enrollment. pNfH and NfL in serum and CSF were quantified using established enzyme-linked immunosorbent assays. Results. There is a longitudinal increase in serum pNfH in advance of the emergence of clinically manifest ALS. A similar pattern is observed for NfL, but with the absolute levels also frequently exceeding a normative threshold. Although CSF data are more sparse, similar patterns are observed for both neurofilaments, with absolute levels exceeding a normative threshold prior to phenoconversion. In serum, these changes are observed in the 6-12 months prior to disease among SOD1 A4V mutation carriers, and as far back as 2 and 3.5 years, respectively, in individuals with a FUS c.521del6 mutation and a C9ORF72 hexanucleotide repeat expansion. Conclusions. Serum and CSF pNfH increase prior to phenoconversion. In CSF, the temporal course of these changes is similar to NfL. In serum, however, pNfH is less sensitive to pre-symptomatic disease than NfL. The duration of pre-symptomatic disease, as defined by changes in neurofilaments, may vary depending on underlying genotype.


Figures

Figure 1.
Figure 1.. Baseline levels of pNfH in serum and CSF
(A) Serum pNfH (pg/ml); and (B) CSF pNfH (pg/ml). Boxes show median, and 25th and 75th percentiles; whiskers extend to a maximum of 1.5 x interquartile range (IQR), or to the most extreme value if it is less than 1.5 x IQR from the 25th or 75th percentile. CSF = cerebrospinal fluid; pNfH = phosphorylated neurofilament heavy.
Figure 2.
Figure 2.. Scatterplot of baseline serum pNfH levels vs. age
Although pNfH levels are slightly higher among older individuals in the control group (open circles) and at-risk group (open triangles), the magnitude of this increase is negligible in comparison to the levels of pNfH observed among ALS patients (closed squares); that is, older age does not explain the increase in serum pNfH among ALS patients. Vertical dashed lines demarcate age groups (< 40, 40-60 and > 60 years). ALS = amyotrophic lateral sclerosis; NfL = neurofilament light; pNfH = phosphorylated neurofilament heavy.
Figure 3.
Figure 3.. Longitudinal changes in serum pNfH concentrations (pg/ml)
(A) Controls; (B) at-risk individuals who remain pre-symptomatic throughout follow-up; (C) phenoconverters; and (D) ALS patients. The x-axis in (A) and (B) shows years since baseline. The x-axis in (C) and (D) shows years to or since the onset of symptoms/signs, which is marked by the vertical dashed line at year = 0. ALS = amyotrophic lateral sclerosis; pNfH = phosphorylated neurofilament heavy. Shading indicates the 95th percentile of all available data among controls.
Figure 4.
Figure 4.. Longitudinal changes in serum NfL and pNfH among phenoconverters
(A) Serum pNfH; (B) serum NfL; (c) CSF pNfH; (d) CSF NfL each plotted on the natural logarithm scale. The x-axis shows years to or since the onset of symptoms/signs, which is marked by the vertical dashed line at year = 0. The gray area covers the range of values within the normative threshold, defined here as the 95th percentile of serum NfL or pNfH values observed in the control group. Colors indicate genotype, with SOD1 A4V in solid red, SOD1 non-A4V in dotted red, FUS in green, and C9orf72 in blue. The closed circles mark the levels that are elevated above the normative threshold. ALS = amyotrophic lateral sclerosis; NfL = neurofilament light; pNfH = phosphorylated neurofilament heavy.

References

    1. Sperling RA, Rentz DM, Johnson KA, et al. The A4 study: stopping AD before symptoms begin? Sci Transl Med 2014;6:228fs213. - PMC - PubMed
    1. Preische O, Schultz SA, Apel A, et al. Serum neurofilament dynamics predicts neurodegeneration and clinical progression in presymptomatic Alzheimer’s disease. Nature medicine 2019;25:277–283. - PMC - PubMed
    1. Weston PSJ, Poole T, O’Connor A, et al. Longitudinal measurement of serum neurofilament light in presymptomatic familial Alzheimer’s disease. Alzheimers Res Ther 2019;11:19. - PMC - PubMed
    1. Weston PSJ, Poole T, Ryan NS, et al. Serum neurofilament light in familial Alzheimer disease: A marker of early neurodegeneration. Neurology 2017;89:2167–2175. - PMC - PubMed
    1. Rostgaard N, Roos P, Portelius E, et al. CSF neurofilament light concentration is increased in presymptomatic CHMP2B mutation carriers. Neurology 2018;90:e157–e163. - PMC - PubMed

Publication types