. 2019 Aug 21;15(8):e1007273.
doi: 10.1371/journal.pcbi.1007273. eCollection 2019 Aug.

Integrating Hi-C links with assembly graphs for chromosome-scale assembly

Affiliations

Integrating Hi-C links with assembly graphs for chromosome-scale assembly

Jay Ghurye et al. PLoS Comput Biol. .

Abstract

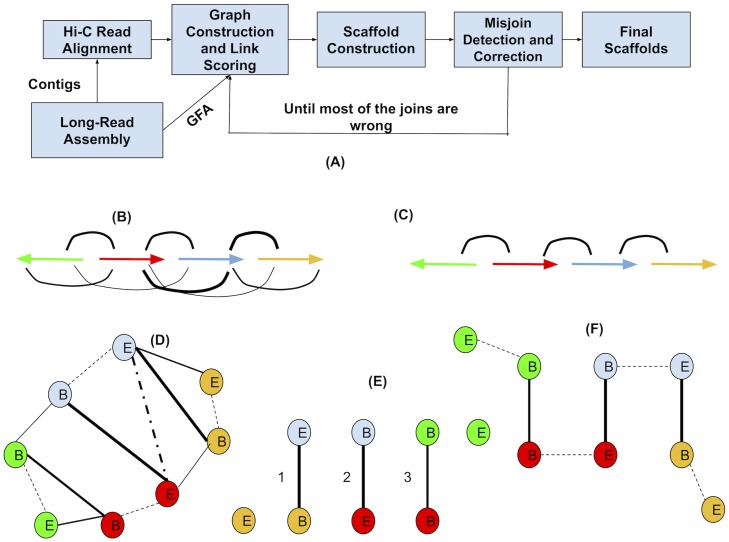
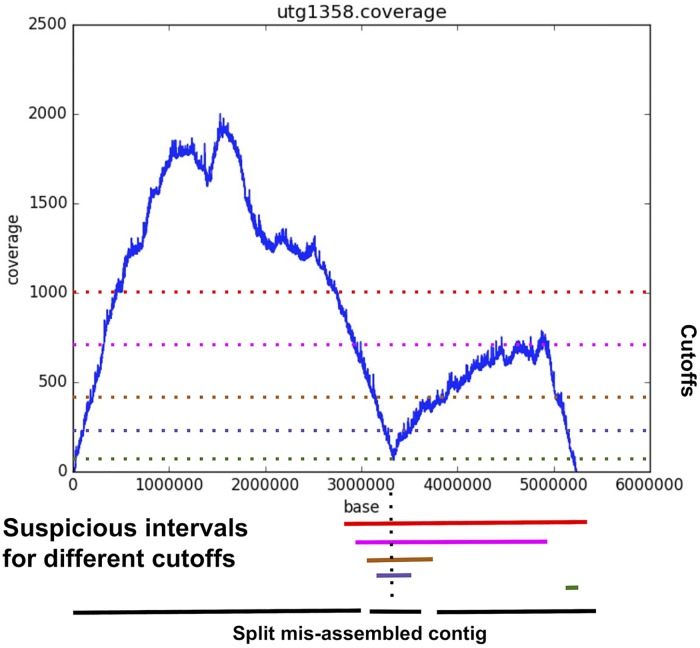
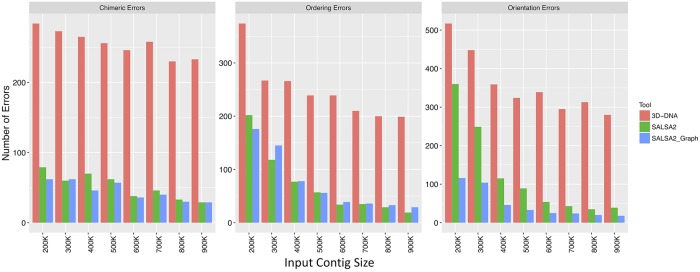
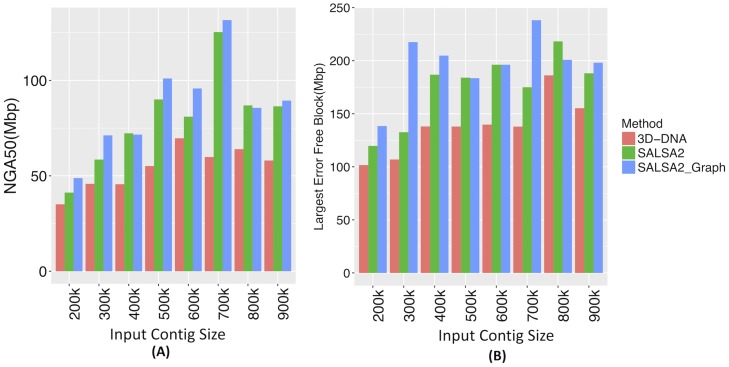
Long-read sequencing and novel long-range assays have revolutionized de novo genome assembly by automating the reconstruction of reference-quality genomes. In particular, Hi-C sequencing is becoming an economical method for generating chromosome-scale scaffolds. Despite its increasing popularity, there are limited open-source tools available. Errors, particularly inversions and fusions across chromosomes, remain higher than alternate scaffolding technologies. We present a novel open-source Hi-C scaffolder that does not require an a priori estimate of chromosome number and minimizes errors by scaffolding with the assistance of an assembly graph. We demonstrate higher accuracy than the state-of-the-art methods across a variety of Hi-C library preparations and input assembly sizes. The Python and C++ code for our method is openly available at https://github.com/machinegun/SALSA.


Conflict of interest statement

Sergey Koren has received travel and accommodation expenses to speak at Oxford Nanopore Technologies conferences. Anthony Schmitt and Siddarth Selvaraj are employees of Arima Genomics, a company commercializing Hi-C DNA sequencing technologies.

Figures

Fig 1
Fig 1
(A) Overview of the SALSA2 scaffolding algorithm. (B) Linkage information obtained from the alignment of Hi-C reads to the assembly. Arrows denote contigs and arcs between arrows denote the inferred linking information from Hi-C reads. Thickness of arcs denote the weight on the Hi-C edge. Thicker edge indicates higher edge weight implied by Hi-C reads (C) Assembly graph obtained from the assembler, where arrows are contigs and arcs denote overlap between contigs(D) Hybrid scaffold graph constructed from the links obtained from the Hi-C read alignments and the overlap graph. Solid edges indicate the linkages between different contigs and dotted edges indicate the links between the ends of the same contig. B and E denote the start and end of contigs, respectively. The E-E edge between blue and red contigs is dashed as this particular orientation between them is not supported by assembly graph, but rather B-E edge is supported. We ignore this dotted edge while computing maximal matching (E) Maximal weighted matching obtained from the graph using a greedy weighted maximum matching algorithm. The numbering of the edges indicates the order in which they were added to the graph. No more solid edges can be added to the matching as it would assign more than one edge to already matched nodes. (F) Edges between the ends of same contigs are added back to the matching to obtain final scaffolds.
Fig 2
Fig 2. Example of the mis-assembly detection algorithm in SALSA2.
The plot shows the position on x-axis and the physical coverage on the y-axis. The dotted horizontal lines show the different thresholds tested to find low physical coverage intervals. The lines at the bottom show the suspicious intervals identified by the algorithm. The dotted line through the intervals shows the maximal clique. The smallest interval (purple) in the clique is identified as mis-assembly and the contig is broken in three parts at its boundaries.
Fig 3
Fig 3. Comparison of orientation, ordering, and chimeric errors in the scaffolds produced by SALSA2 and 3D-DNA on the simulated data.
As expected, the number of errors for all error types decrease with increasing input contig size. Incorporating the assembly graph reduces error across all categories and most assembly sizes, with the largest decrease seen in orientation errors. SALSA2 utilizing the graph has 2-4 fold fewer errors than 3D-DNA.
Fig 4
Fig 4. (A) NGA50 statistic for different input contig sizes and (B) the length of longest error-free block for different input contig sizes.
Once again, the assembly graph typically increases both the NGA50 and the largest correct block.
Fig 5
Fig 5. Feature response curve for (A) assemblies obtained from contigs as input (B) assemblies obtained from mitotic Hi-C data and (C) assemblies obtained using Dovetail Chicago data.
The best assemblies lie near the top left of the plot, with the largest area under the curve.
Fig 6
Fig 6. Chromosome ideogram generated using the coloredChromosomes [39] package.
Each color switch denotes a change in the aligned sequence, either due to large structural error or the end of a contig/scaffold. Left: input contigs aligned to the GRCh38 reference genome. Right: SALSA2 scaffolds aligned to the GRCh38 reference genome. More than ten chromosomes are in a single scaffold. Chromosomes 16 and 19 are more fragmented due to scaffolding errors that break the alignment.
Fig 7
Fig 7. Contiguity plot for scaffolds generated with (A) standard Arima-HiC data (B) mitotic Hi-C data and (C) Chicago data.
The X-axis denotes the NGAX statistic and the Y-axis denotes the corrected block length to reach the NGAX value. SALSA2 results were generated using the assembly graph, unless otherwise noted.
Fig 8
Fig 8. Contact map of Hi-C interactions on chromosome 3 generated by the Juicebox software [41].
The cells sequenced in (A) normal conditions, (B) during mitosis, and (C) Dovetail Chicago.

References

    1. Nagarajan N, Pop M. Sequence assembly demystified. Nature Reviews Genetics. 2013;14(3):157–167. 10.1038/nrg3367 - DOI - PubMed
    1. Miller JR, Koren S, Sutton G. Assembly algorithms for next-generation sequencing data. Genomics. 2010;95(6):315–327. 10.1016/j.ygeno.2010.03.001 - DOI - PMC - PubMed
    1. Pevzner PA, Tang H, Waterman MS. An Eulerian path approach to DNA fragment assembly. Proceedings of the National Academy of Sciences. 2001;98(17):9748–9753. 10.1073/pnas.171285098 - DOI - PMC - PubMed
    1. Myers EW. The fragment assembly string graph. Bioinformatics. 2005;21(suppl 2):ii79–ii85. 10.1093/bioinformatics/bti1114 - DOI - PubMed
    1. Nagarajan N, Pop M. Parametric complexity of sequence assembly: theory and applications to next generation sequencing. Journal of computational biology. 2009;16(7):897–908. 10.1089/cmb.2009.0005 - DOI - PubMed

Publication types

MeSH terms