

Ambient Particulate Air Pollution and Daily Mortality in 652 Cities
- PMID: 31433918
- PMCID: PMC7891185
- DOI: 10.1056/NEJMoa1817364
Ambient Particulate Air Pollution and Daily Mortality in 652 Cities
Abstract
Background: The systematic evaluation of the results of time-series studies of air pollution is challenged by differences in model specification and publication bias.
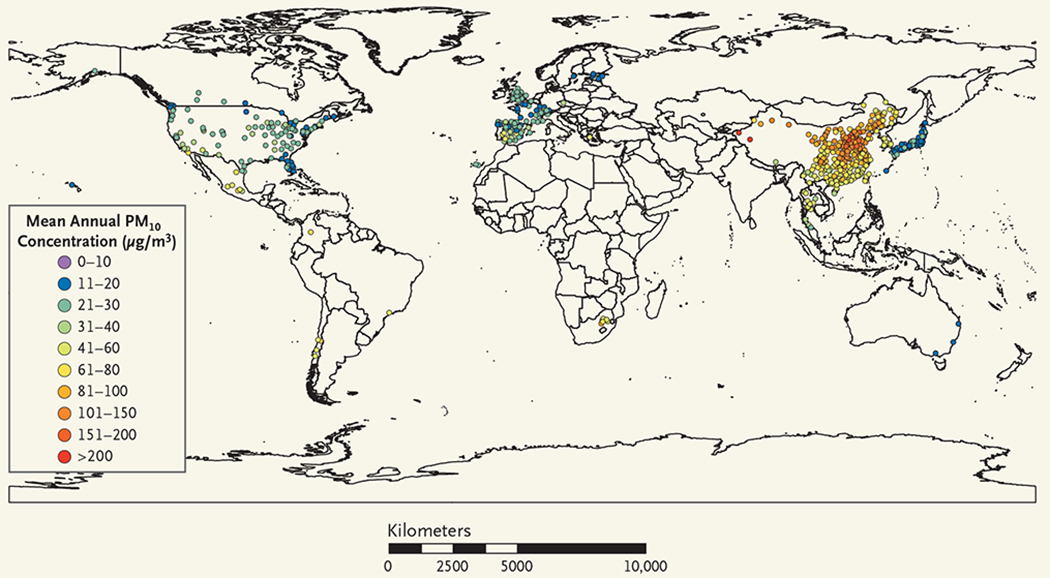
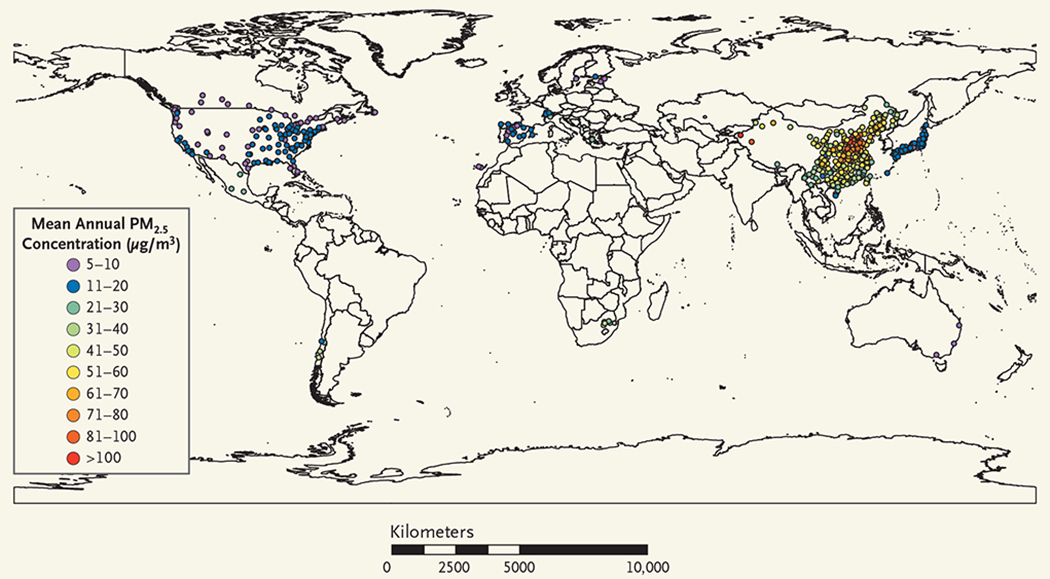
Methods: We evaluated the associations of inhalable particulate matter (PM) with an aerodynamic diameter of 10 μm or less (PM10) and fine PM with an aerodynamic diameter of 2.5 μm or less (PM2.5) with daily all-cause, cardiovascular, and respiratory mortality across multiple countries or regions. Daily data on mortality and air pollution were collected from 652 cities in 24 countries or regions. We used overdispersed generalized additive models with random-effects meta-analysis to investigate the associations. Two-pollutant models were fitted to test the robustness of the associations. Concentration-response curves from each city were pooled to allow global estimates to be derived.
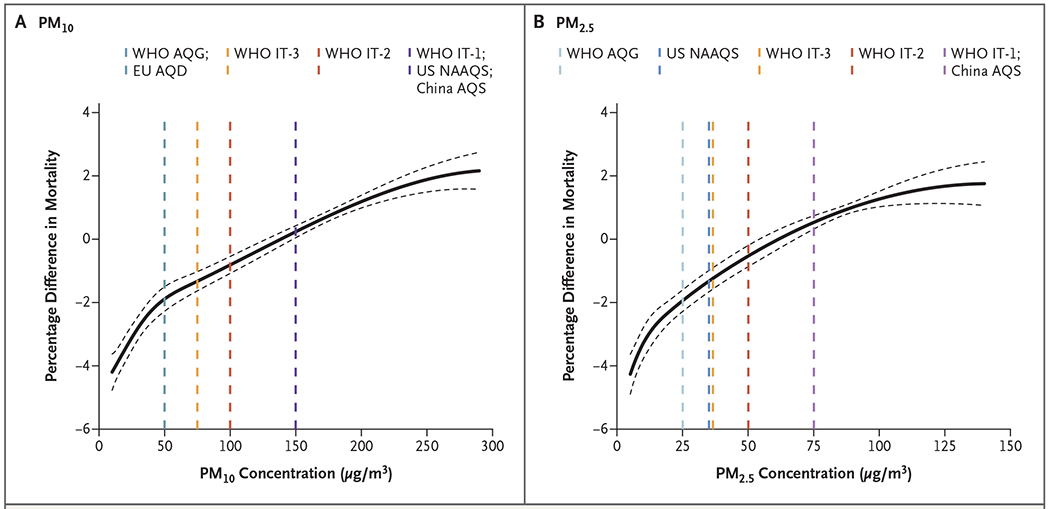
Results: On average, an increase of 10 μg per cubic meter in the 2-day moving average of PM10 concentration, which represents the average over the current and previous day, was associated with increases of 0.44% (95% confidence interval [CI], 0.39 to 0.50) in daily all-cause mortality, 0.36% (95% CI, 0.30 to 0.43) in daily cardiovascular mortality, and 0.47% (95% CI, 0.35 to 0.58) in daily respiratory mortality. The corresponding increases in daily mortality for the same change in PM2.5 concentration were 0.68% (95% CI, 0.59 to 0.77), 0.55% (95% CI, 0.45 to 0.66), and 0.74% (95% CI, 0.53 to 0.95). These associations remained significant after adjustment for gaseous pollutants. Associations were stronger in locations with lower annual mean PM concentrations and higher annual mean temperatures. The pooled concentration-response curves showed a consistent increase in daily mortality with increasing PM concentration, with steeper slopes at lower PM concentrations.
Conclusions: Our data show independent associations between short-term exposure to PM10 and PM2.5 and daily all-cause, cardiovascular, and respiratory mortality in more than 600 cities across the globe. These data reinforce the evidence of a link between mortality and PM concentration established in regional and local studies. (Funded by the National Natural Science Foundation of China and others.).
Copyright © 2019 Massachusetts Medical Society.
Conflict of interest statement
No potential conflict of interest relevant to this article was reported.
Figures
Comment in
-
Prioritizing Health in a Changing Climate.N Engl J Med. 2019 Aug 22;381(8):773-774. doi: 10.1056/NEJMe1909957. N Engl J Med. 2019. PMID: 31433926 No abstract available.
-
Do We Really Need Another Time-Series Study of the PM2.5-Mortality Association?N Engl J Med. 2019 Aug 22;381(8):774-776. doi: 10.1056/NEJMe1909053. N Engl J Med. 2019. PMID: 31433927 No abstract available.
-
Ambient Air Pollution and Mortality in 652 Cities.N Engl J Med. 2019 Nov 21;381(21):2072-2073. doi: 10.1056/NEJMc1913285. N Engl J Med. 2019. PMID: 31747733 No abstract available.
-
Ambient Air Pollution and Mortality in 652 Cities.N Engl J Med. 2019 Nov 21;381(21):2073. doi: 10.1056/NEJMc1913285. N Engl J Med. 2019. PMID: 31747734 No abstract available.
-
Ambient Air Pollution and Mortality in 652 Cities.N Engl J Med. 2019 Nov 21;381(21):2073-2074. doi: 10.1056/NEJMc1913285. N Engl J Med. 2019. PMID: 31747735 No abstract available.
-
Ambient Air Pollution and Mortality in 652 Cities.N Engl J Med. 2019 Nov 21;381(21):2074. doi: 10.1056/NEJMc1913285. N Engl J Med. 2019. PMID: 31747736 No abstract available.
-
Feinstaub auch unterhalb der Grenzwerte schädlich : Public Health.MMW Fortschr Med. 2020 Mar;162(Suppl 1):22. doi: 10.1007/s15006-020-0292-3. MMW Fortschr Med. 2020. PMID: 32221888 German. No abstract available.
References
-
- Rückerl R, Schneider A, Breitner S, Cyrys J, Peters A. Health effects of particulate air pollution: a review of epidemiological evidence. Inhal Toxicol 2011;23:555–92. - PubMed
-
- Brunekreef B, Holgate ST. Air pollution and health. Lancet 2002;360:1233–42. - PubMed
-
- WHO air quality guidelines for particulate matter, ozone, nitrogen dioxide and sulfur dioxide: global update 2005: summary of risk assessment. Geneva: World Health Organization, 2006. - PubMed
Publication types
MeSH terms
Substances
Grants and funding
- PRX17/00705/Ministerio de Educación, Cultura y Deporte/International
- K21004000001-10A0500-00710/National Research Foundation of Korea/International
- MR/R013349/1/MRC_/Medical Research Council/United Kingdom
- MR/R013349/1/US/United States/United States
- 91643205/National Natural Science Foundation of China/International
- P30 ES019776/ES/NIEHS NIH HHS/United States
- MR/S019669/1/MRC_/Medical Research Council/United Kingdom
- 310373/Academy of Finland/International
- IUT34-17/US/United States/United States
- 310372/Academy of Finland/International
- PI15/00515/Secretaría de Estado de Investigacion, Desarrollo e Innovacion/International
- 91843302/National Natural Science Foundation of China/International
- APP1163693/US/United States/United States
- 18-22125S/Grantová Agentura České Republiky/International
- APP1107107/US/United States/United States
- Grant 16-250/US/United States/United States
- MR/M022625/1/MRC_/Medical Research Council/United Kingdom
LinkOut - more resources
Full Text Sources
Medical