. 2019 Aug 20;28(8):2012-2022.e4.
doi: 10.1016/j.celrep.2019.07.056.

EGFR Signaling Termination via Numb Trafficking in Ependymal Progenitors Controls Postnatal Neurogenic Niche Differentiation

Affiliations

EGFR Signaling Termination via Numb Trafficking in Ependymal Progenitors Controls Postnatal Neurogenic Niche Differentiation

Khadar Abdi et al. Cell Rep. .

Abstract

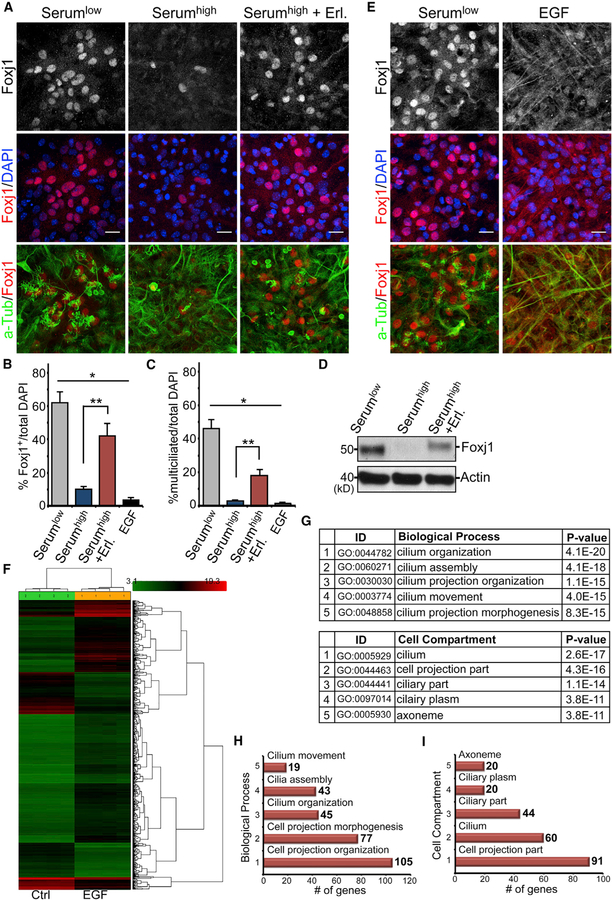
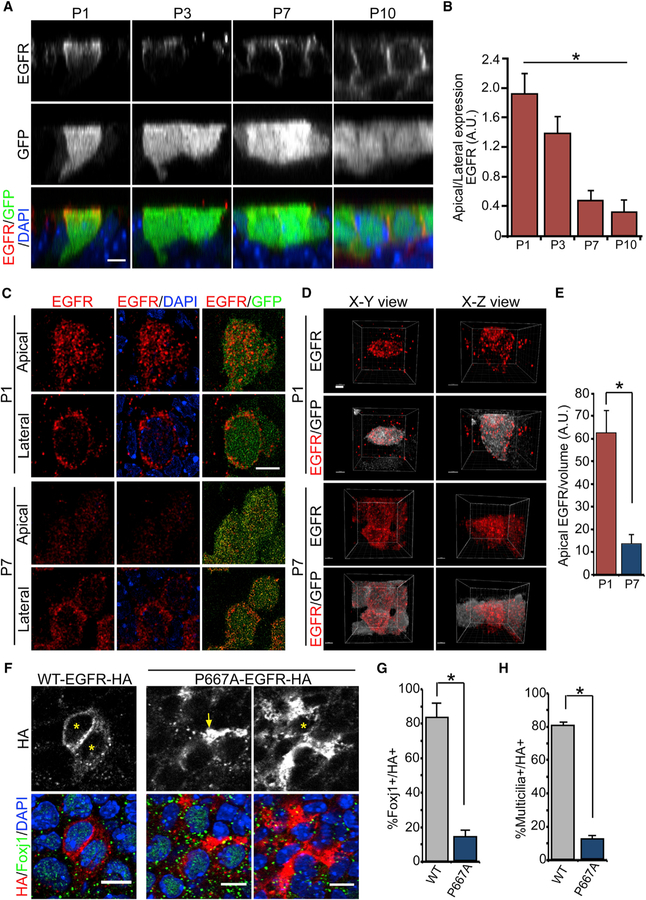
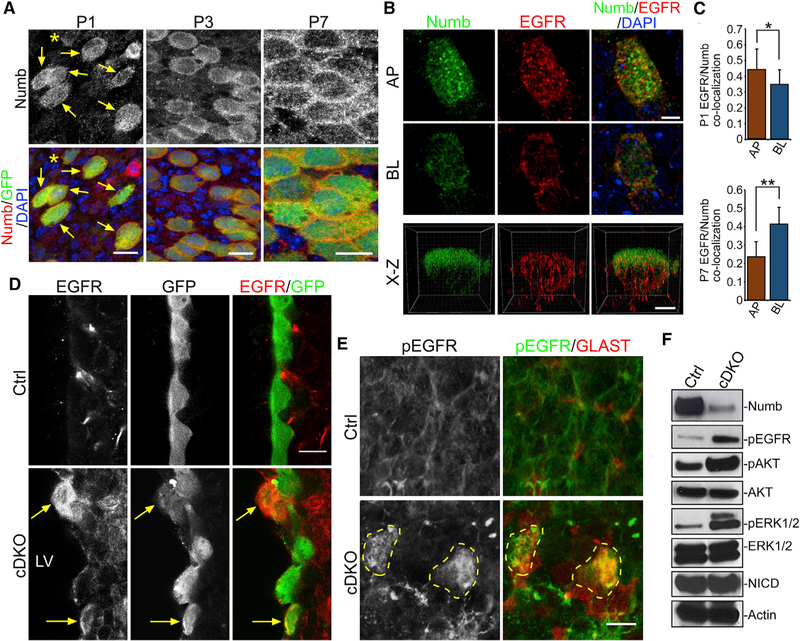
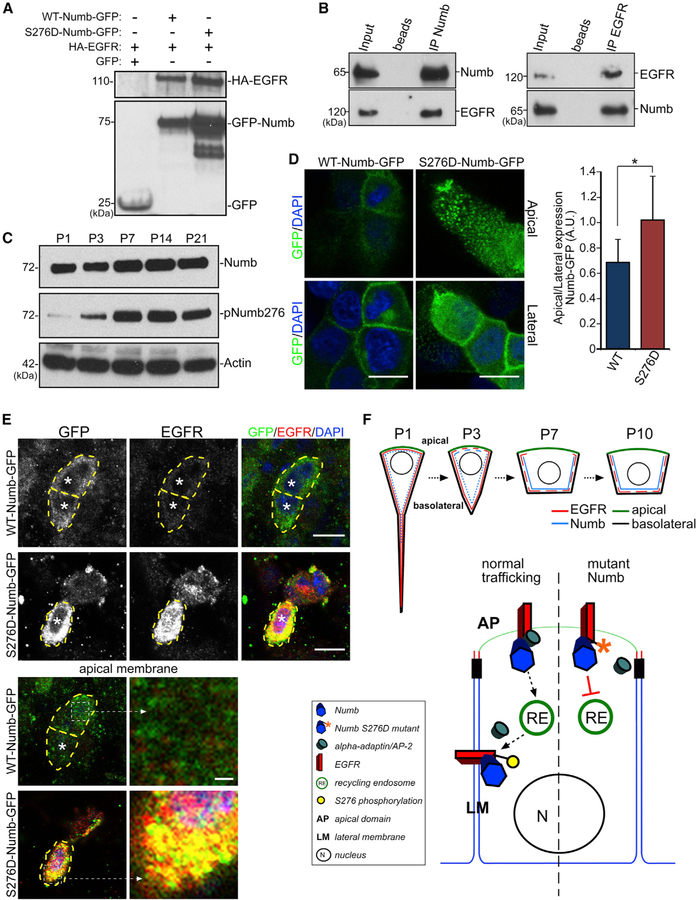
Specialized microenvironments, called niches, control adult stem cell proliferation and differentiation. The brain lateral ventricular (LV) neurogenic niche is generated from distinct postnatal radial glial progenitors (pRGPs), giving rise to adult neural stem cells (NSCs) and niche ependymal cells (ECs). Cellular-intrinsic programs govern stem versus supporting cell maturation during adult niche assembly, but how they are differentially initiated within a similar microenvironment remains unknown. Using chemical approaches, we discovered that EGFR signaling powerfully inhibits EC differentiation by suppressing multiciliogenesis. We found that EC pRGPs actively terminated EGF activation through receptor redistribution away from CSF-contacting apical domains and that randomized EGFR membrane targeting blocked EC differentiation. Mechanistically, we uncovered spatiotemporal interactions between EGFR and endocytic adaptor protein Numb. Ca2+-dependent basolateral targeting of Numb is necessary and sufficient for proper EGFR redistribution. These results reveal a previously unknown cellular mechanism for neighboring progenitors to differentially engage environmental signals, initiating adult stem cell niche assembly.

Keywords: EGFR; Foxj1; Numb; ependymal cells; hydrocephalus; multiciliated differentiation; neurogenic niche; radial glia; receptor trafficking.


Conflict of interest statement

DECLARATION OF INTERESTS

The authors declare no competing interests.

Figures

Figure 1.
Figure 1.. EGF Inhibition of Ependymal Differentiation
(A) IHC images of EC cultures grown in differentiation media (Serumlow), media containing 10% serum (Serumhigh), or media containing both 10% serum and Erlotinib (Serumhigh + Erl.). Samples were labeled with antibodies to Foxj1, acetylated tubulin (a-Tub), and DAPI. Scale bar: 20 µm. (B) IHC images of EC cultures grown in differentiation media or differentiation media + EGF (EGF) and labeled with antibodies to Foxj1, a-Tub, and DAPI. Scale bar: 20 µm. (C) Quantifications of Foxj1+ cells as the percentage of total DAPI-labeled cells. *p < 0.0001, one-way ANOVA; **p < 0.0064, Wilcoxon two-sample test; n = 5; mean ± SEM. (D) Quantifications of multiciliated cells (visualized by a-Tub staining) as the percentage of total DAPI-labeled cells. *p < 0.0001, one-way ANOVA; **p < 0.0064, Wilcoxon two-sample test; n = 5; mean ± SEM. (E) Western blot analysis of EC cultures grown in differentiation media (Serumlow), 10% serum (Serumhigh), or 10% serum + Erlotinib (Serumhigh + Erl.). Actin is the loading control. (F) Transcriptome heatmap, with genes changing at least 2-fold between EGF-treated (EGF) and untreated (Ctrl) cultures. Log2 expression values were row normalized using Z scores and clustered using hierarchical clustering. (G–I) Enriched GO terms (G) ranked by the percentage of genes located in each library. The number of genes identified for biological process (H) and cell compartment (I) is indicated for each bar graph. See also Figure S1.
Figure 2.
Figure 2.. Apical to Basolateral Ependymal EGFR Localization
(A) IHC images in x-z views of LV whole mounts from FOXJ1-GFP+ animals, with antibodies to EGFR, GFP, and DAPI. Scale bar: 10 µm. (B) Quantification of the apical/basolateral EGFR expression ratio in FOXJ1-GFP+ pRGPs. *p < 0.0001, one-way ANOVA, n = 10 cells for each group, mean ± SEM. (C) STED super-resolution images from the P1 and P7 LV surface labeled with EGFR and GFP antibodies. Single apical and lateral optical sections are shown. Scale bar: 5 µm. (D) 3D rendering of STED super-resolution images from (C), with EGFR in red and GFP in white for clarity. Scale bars: 2 µm. (E) Quantifications of apical EGFR particles as the fraction of the volume measured. *p < 0.001, Student’s t test, n = 10, mean ± SEM. (F) IHC images from P14 LV whole mounts injected P1 with either WT-EGFR-HA or P667A-EGFR-HA lentivirus and labeled with anti-Foxj1/HA antibodies and DAPI. The asterisk indicates the cell body of HA+ cells quantified; note apically expressed P667A-EGFR-HA (arrow, left panels) from the deeper section of the same cell in right panels (*). Scale bars: 10 µm. (G) Quantifications of Foxj1+ cells per total HA+ cells for each construct. *p < 0.0286, Wilcoxon two-sample test, n = 4 animals, mean ± SEM. (H) Quantifications of multicilia+ cells per total HA+ cells for each construct. *p < 0.0286, Wilcoxon two-sample test, n = 4 animals, mean ± SEM. See also Figures S2 and S3.
Figure 3.
Figure 3.. EGFR Activation Defects in Numb/Numblike Mutants
(A) IHC images of LV whole mounts from FOXJ1-GFP+ mice labeled with antibodies to Numb/GFP and DAPI. At P1, most GFP+ cells strongly expressed Numb (arrows), while GFP-dim cells showed lower Numb levels (*). Scale bar: 10 µm. (B) STED super-resolution images of LV whole mounts from P1 FOXJ1-GFP+ animals labeled with antibodies to Numb, EGFR, and DAPI. AP, apical domain; BL, basolateral domain. x-z view, optical section from longest x-y axis. Scale bar: 5 µm. (C) Quantifications of Numb/EGFR co-localization at AP or BL domains from P1 (top graph) or P7 (bottom graph) animals. Co-localization, average Pearson’s coefficient. *p < 0.03, **p < 0.0001, Student’s t test, n = 12 cells, mean ± SEM. (D) IHC images of LV neurogenic niche coronal sections from P14 control (Ctrl) or FOXJ1-Cre; Nbflox/flox; NblKO/KO; CAG-GFP (cDKO) animals labeled with antibodies to GFP and EGFR. Note the cDKO GFP+ cells with high-level EGFR and AP localization (arrows). (E) IHC images of LV whole mounts from P14 Ctrl or cDKO animals, labeled with antibodies to pEGFR and GLAST and showing mutant cells strongly expressing pEGFR (dashed circles). Scale bar: 20 µm. (F) Western blot analysis of LV whole mounts from P14 Ctrl or cDKO animals. Actin is the loading control. See also Figure S4.
Figure 4.
Figure 4.. EGFR Trafficking via Numb Phosphorylation
(A) IP from HEK293 cell lysates co-transfected with constructs as indicated (+) and probed with antibodies to HA (EGFR, upper blot) and GFP (Numb, lower blot). (B) IP from P3 LV whole mounts using anti-Numb or anti-EGFR antibodies. Blots were then probed with anti-Numb and anti-EGFR antibodies. (C) Western blot analyses of LV walls of indicated ages and blotted for Numb and pNumb276. Actin is the loading control. (D) IHC images of MDCK cells expressing either WT-Numb-GFP or S276D-Numb-GFP stained with anti-GFP antibody and DAPI. Single optical section views are from cellular apical surfaces (apical view, top row) or below the surface showing lateral membrane domains (lateral view, bottom row). Scale bars: 10 mm. The ratio of GFP fluorescent intensity at apical versus lateral domains for WT-Numb-GFP and S276D-Numb-GFP is shown. *p < 0.001, Student’s t test, n = 10, mean ± SEM. (E) IHC images of P7 LV whole mounts expressing WT-Numb-GFP or S276D-Numb-GFP (from P1 lentiviral infection) labeled with anti-GFP, EGFR antibodies, and DAPI. Note high-level EGFR expression in S276D-Numb-GFP-expressing cells, but not WT-Numb-GFP-expressing cells (*). Right panels: single optical plane of the apical membrane, with enlarged areas showing high-level EGFR localization with S276D-Numb-GFP (dashed boxes). Scale bars: 10 µm; inset 1 µm. (F) Schematic illustrations showing EGFR/Numb localizations during postnatal ependymal maturation (top) and the putative molecular pathway of EGFR redistribution (bottom).

References

    1. Abdi KM, and Bennett V (2008). Adducin promotes micrometer-scale organization of beta2-spectrin in lateral membranes of bronchial epithelial cells. Mol. Biol. Cell 19, 536–545. - PMC - PubMed
    1. Abdi K, Lai CH, Paez-Gonzalez P, Lay M, Pyun J, and Kuo CT (2018). Uncovering inherent cellular plasticity of multiciliated ependyma leading to ventricular wall transformation and hydrocephalus. Nat. Commun 9, 1655. - PMC - PubMed
    1. Arenkiel BR, Hasegawa H, Yi JJ, Larsen RS, Wallace ML, Philpot BD, Wang F, and Ehlers MD (2011). Activity-induced remodeling of olfactory bulb microcircuits revealed by monosynaptic tracing. PLoS ONE 6, e29423. - PMC - PubMed
    1. Barrilleaux B, Phinney DG, Prockop DJ, and O’Connor KC (2006). Review: ex vivo engineering of living tissues with adult stem cells. Tissue Eng 12, 3007–3019. - PubMed
    1. Benner EJ, Luciano D, Jo R, Abdi K, Paez-Gonzalez P, Sheng H, Warner DS, Liu C, Eroglu C, and Kuo CT (2013). Protective astrogenesis from the SVZ niche after injury is controlled by Notch modulator Thbs4. Nature 497, 369–373. - PMC - PubMed

Publication types

MeSH terms