. 2019 Aug 20;28(8):2048-2063.e8.
doi: 10.1016/j.celrep.2019.07.022.

Genomic Resolution of DLX-Orchestrated Transcriptional Circuits Driving Development of Forebrain GABAergic Neurons

Affiliations

Genomic Resolution of DLX-Orchestrated Transcriptional Circuits Driving Development of Forebrain GABAergic Neurons

Susan Lindtner et al. Cell Rep. .

Abstract

DLX transcription factors (TFs) are master regulators of the developing vertebrate brain, driving forebrain GABAergic neuronal differentiation. Ablation of Dlx1&2 alters expression of genes that are critical for forebrain GABAergic development. We integrated epigenomic and transcriptomic analyses, complemented with in situ hybridization (ISH), and in vivo and in vitro studies of regulatory element (RE) function. This revealed the DLX-organized gene regulatory network at genomic, cellular, and spatial levels in mouse embryonic basal ganglia. DLX TFs perform dual activating and repressing functions; the consequences of their binding were determined by the sequence and genomic context of target loci. Our results reveal and, in part, explain the paradox of widespread DLX binding contrasted with a limited subset of target loci that are sensitive at the epigenomic and transcriptomic level to Dlx1&2 ablation. The regulatory properties identified here for DLX TFs suggest general mechanisms by which TFs orchestrate dynamic expression programs underlying neurodevelopment.

Keywords: ChIP-seq; DLX; GABA neuron; basal ganglia; chromatin; development; enhancers; ganglionic eminence; genome; histone; regulatory element; telencephalon; transcription factor; transcriptional circuits.


Conflict of interest statement

DECLARATION OF INTERESTS

J.L.R.R. is co-founder, stockholder, and currently on the scientific board of Neurona, a company studying the potential therapeutic use of interneuron transplantation. The other authors declare no competing interests.

Figures

Figure 1.
Figure 1.. DLX2, DLX1, and DLX5 Genomic Binding in Embryonic GE
(A) Schematic of functional genomic dissection of DLX. (B) DLX ChIP-seq coverage at Gad2 and Lhx6 loci; merged peak dataset represented inside a golden box on top of first DLX track. (C) DLX peak counts by genomic feature at E11.5, E13.5, and E16.5. (D) Heatmap showing pairwise Pearson correlation for genome-wide coverage values for DLX ChIP-seq. (E) Normalized coverage of ChIP-seq peaks. Each row represents a DLX binding region ± 10 kb. Numbers under the heatmap columns denote number of peaks called for each DLX/time point. (F) Venn diagrams showing increasing percent of peaks shared across DLXs as peak stringency increases. (G) Volcano plot showing E13.5 Dlx1/2−/− versus WT GE differential gene expression fold change and statistical significance. (H) Shared primary binding DNA motif across DLXs (i) centered within ChIP-seq peaks (ii). Motifs that were strongly enriched within DLX peaks (iii); blue bars show motif frequency in DLX peaks and red bars in GC-matched background sequences (enrichment in parentheses). (I) Distance from TSS to nearest DLX peak for DE genes by peak stringency. (J) Median Phastcons scores for vertebrate-conserved elements at promoter and distal DLX peaks by stringency.
Figure 2.
Figure 2.. Chromatin State Is Dependent on DLX Binding for Key Regulatory Targets
(A) Schematic of epigenomic comparison of WT and Dlx1/2−/− E13.5 GE. (B) DLX and histone ChIP-seq coverage for Slc32a1 (Vgat, downregulated) and Otp (upregulated) loci; merged peak dataset represented inside a golden box on top of first DLX track, and differential histone PTMs shown as black bars under the peak where there was statistically significant difference. (C) Average change in histone PTM signal in Dlx1/2−/− GE at DLX-bound loci for regions featuring loss of activating or gain of repressive marks (a.RE) or gain of activating or loss of repressive marks (r.RE). (D) Log2 fold change of nearest gene expression for all DLX peaks, higher-affinity peaks, and a.RE and r.RE loci. (E) Modified volcano plot showing intersection of all differential gene expression and a.RE and r.RE loci. Colored circles represent a.RE (red) or r.RE (blue) within 100 kb of gene TSS. Circle size shows magnitude of histone PTM change in Dlx1/2−/− GE. (F) Differential enrichment of functional annotation terms comparing all DLX TF peaks and a.RE and r.RE loci.
Figure 3.
Figure 3.. Nrxn3 and Arx Are Regulated by DLX via RE Interactions
(A) ChIP-seq data for Nrxn3 locus; called DLX peaks and histone differential PTM as described in Figure 2B. (B) ISH analysis of Nrxn3 expression in WT (upper panel) and Dlx1/2−/− (lower panel) forebrain at E13.5. (MGE, medial GE; LGE, lateral GE; CGE, caudal GE; SVZ, subventricular zone; VZ, ventricular zone; MZ, mantle zone). Images are representatives of 3 embryos. Scale bar represents 500 μm. (C) mm1203 sequence drives LacZ expression in E12.5 forebrain in a transgenic mouse enhancer assay. Dashed line indicates plane of section. (D) Dlx transfection luciferase transcription assays in P19 cells showing activating effect of DLX on mm1203. (E) ChIP-seq data for Arx locus; called DLX peaks and histone differential PTM as described in Figure 2B. (F) Activity patterns in mouse transgenic assays for characterized Arx GE (hs119, hs121) and pallial (hs122, hs123) REs. (G) Dlx transfection luciferase transcription assays in P19 cells showing specific activating effect of DLX on Arx GE REs. Luciferase data are represented as mean ± SEM (n = 5 for Nrxn3 and n = 3 for Arx). Unpaired t test was used for the statistical analysis between the presence of enhancer in the reporter or no enhancer (*p < 0.05, **p <0.01, ***p <0.001, and ****p < 0.0001).
Figure 4.
Figure 4.. Genome Sequence and Context Define a.RE and r.RE Loci
(A) Differential motif enrichment in a.RE and r.RE. loci. Motifs specific to a.RE or r.RE labeled in blue. Horizontal bar plot on left shows log2 fold enrichment difference between a.RE and r.RE with dotted blue lines shown for 1.2-fold enrichment difference. Heatmap on right shows a.RE and r.RE enrichment versus all DLX peaks. (B) Distribution of all DLX peaks, higher-affinity peaks, and a.RE and r.RE loci by chromatin state. ChromHMM states defined by relative histone PTM enrichment as shown on left. Each dot in center plot represents one peak with density represented by shaded area. Distal and proximal (promoter) region assignment shown as colored bars along they axis, with blue and yellow indicating distal and proximal regions, respectively; no chromatin state signal and repressed regions marked as both (black). Proportion of total peaks shown in bar plot at right. (C) Distribution of the number of DLX peaks within 50 kb of TSS for all versus DE genes, with gene counts by DLX peak number histogram and representative example genes shown. (D) Relationship between log2 FC (fold change of gene expression Dlx1/2−/− versus WT) of the nearest TSS (x-axis) and histone H3K27ac signal in WT E13.5 GE (y-axis) and for all DLX peaks, a.RE, and r.RE. Symbol size shows density of DLX TF peaks within 50 kb. Distribution of H3K27ac enrichment for peak classes shown at right. (E) Receiver operating characteristic (ROC) curve for logistic regression models predicting a.RE or r.RE status. Predictors include DNA motif presence, chromatin context (histone PTM, distal/proximal, ChromHMM state) and DLX (affinity and local peak density), and a full model with all features included. ***p < 2.2 × 10⁻¹⁶ in (C) and (D).
Figure 5.
Figure 5.. Sp8 Is Regulated by DLX Binding to Promoter-Interacting Distal Elements
(A) ChIP-seq coverage for Sp8 locus; called DLX peaks and histone differential PTM as described in Figure 2B. (B) Transgenic RE assay results showing activity of three GE-active (hs110, hs1226, and hs1007) and limb-active (hs1148) REs. (C) Downregulation of Sp8 mRNA caused by delivery of dCas9-KRAB and gRNA targeting putative Sp8 REs. y-axis shows the amount of Sp8 mRNA relative to control GFP gRNA (blue points) measured in RT-qPCR (n = 3 for gRNA-hs1148; n = 6 for the rest). (D) Dlx transfection luciferase transcription assay in P19 cells showing the effect of DLX on the Sp8 GE REs; data represented as mean ± SEM (n = 3). Unpaired t test was used for the statistical analysis between the presence of enhancer in the reporter or no enhancer (*p < 0.05; **p < 0.01, ***p < 0.001, ****p < 0.0001).
Figure 6.
Figure 6.. DLX TFs Regulate Spatial Patterns of Gene Expression
(A) ISH analyses using probes detecting Arl4d and Grik3, and Tox and Lhx9 in WT and Dlx1/2−/− forebrain at E13.5 (MGE, medial GE; LGE, lateral GE; CGE, caudal GE; SVZ, subventricular zone; VZ, ventricular zone; MZ, mantle zone; open arrows, downregulation; black arrows, upregulations; red arrows, ectopic expression). Images are representatives of 2 embryos for each probe. Scale bar represents 500 μm. (B) Summary of spatial changes in DE gene expression from ISH analysis comparing WT and Dlx1/2−/− forebrain. (C) Transgenic RE assay activity patterns for representative a.RE and r.RE sequences. (D) Summary of RE activity patterns within GE subregions (VZ, ventricular zone; SVZ, subventricular zone; MZ, mantle zone).
Figure 7.
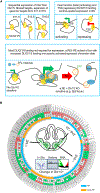
Figure 7.. Regulatory Model and Gene Regulatory Networks Orchestrated by DLX
(A) Schematic model of DLX genomic function in developing GE. (B) Curated gene regulatory network (GRN) for DLX-regulated transcription factors and lineage specification factors. The GRN is organized radially with regard to the laminar activity of genes (VZ/SVZ, SVZ, and MZ, shown in three different shades of gray). The effects of the Dlx1/2−/− mutation are indicated in three nested circles. The outer circle reports RNA changes measured by ISH (IS) (this study; Long et al., 2009a, 2009b). The middle circle reports histone PTM signal (H) changes. The inner circle reports RNA-seq (R) changes. Red and green represent repressive and activating roles for DLX TFs on each assay, respectively. For histone changes, REs assigned to nearest TSS.

References

    1. Anderson SA, Eisenstat DD, Shi L, and Rubenstein JL (1997a). Interneuron migration from basal forebrain to neocortex: dependence on Dlx genes. Science 278, 474–476. - PubMed
    1. Anderson SA, Qiu M, Bulfone A, Eisenstat DD, Meneses J, Pedersen R, and Rubenstein JL (1997b). Mutations of the homeobox genes Dlx-1 and Dlx-2 disrupt the striatal subventricular zone and differentiation of late born striatal neurons. Neuron 19, 27–37. - PubMed
    1. Andrews S (2010). FASTQC. A quality control tool for high throughput sequence data. http://www.bioinformatics.babraham.ac.uk/.
    1. Boija A, Klein IA, Sabari BR, Dall’Agnese A, Coffey EL, Zamudio AV, Li CH, Shrinivas K, Manteiga JC, Hannett NM, et al. (2018). Transcription factors activate genes through the phase-separation capacity of their activation domains. Cell 175, 1842–1855.e16. - PMC - PubMed
    1. Casarosa S, Fode C, and Guillemot F (1999). Mash1 regulates neurogenesis in the ventral telencephalon. Development 126, 525–534. - PubMed

Publication types