. 2019 Aug 20;28(8):2156-2168.e5.
doi: 10.1016/j.celrep.2019.07.068.

Re-education of Tumor-Associated Macrophages by CXCR2 Blockade Drives Senescence and Tumor Inhibition in Advanced Prostate Cancer

Affiliations

Re-education of Tumor-Associated Macrophages by CXCR2 Blockade Drives Senescence and Tumor Inhibition in Advanced Prostate Cancer

Diletta Di Mitri et al. Cell Rep. .

Abstract

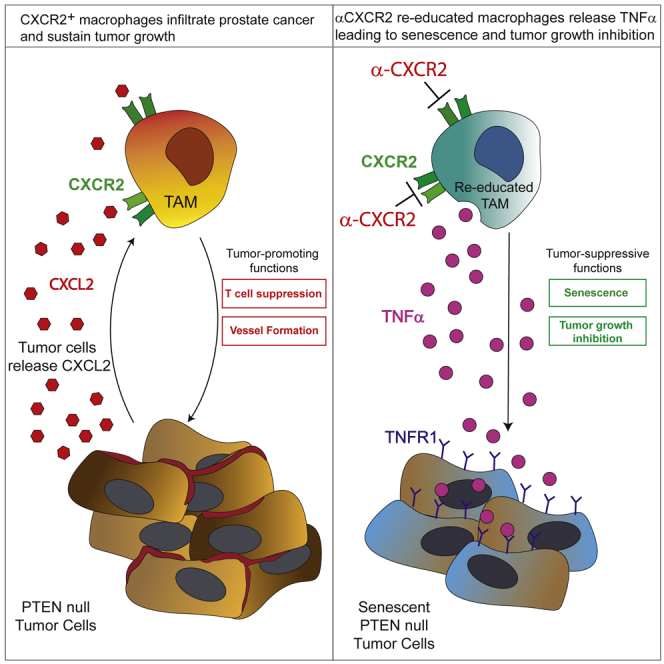
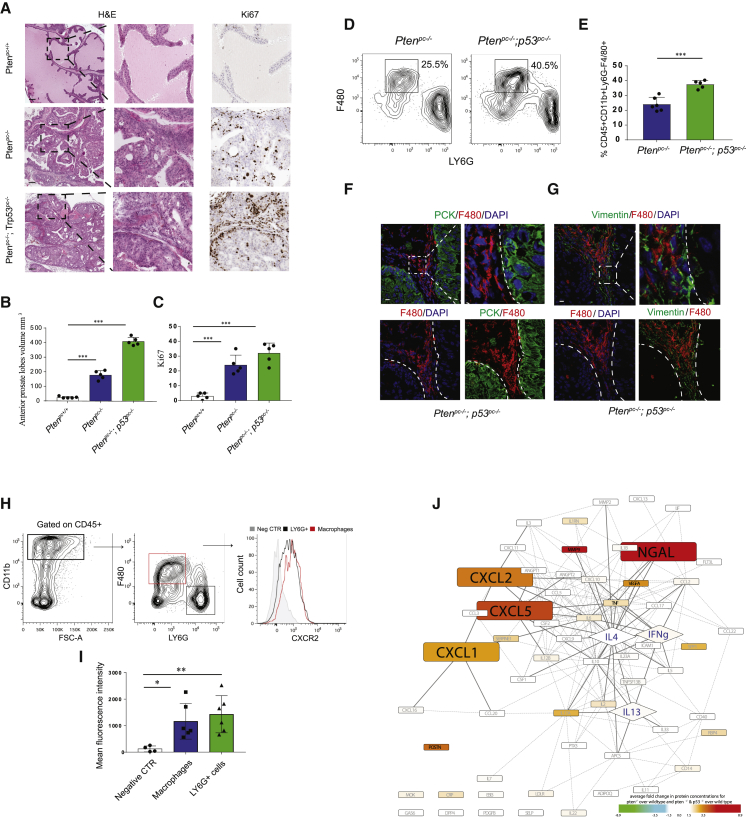
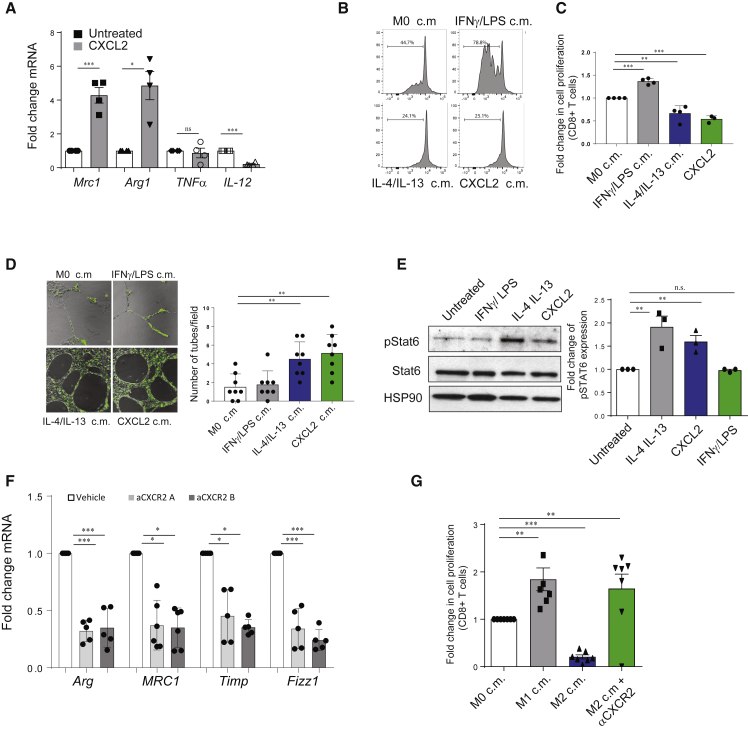
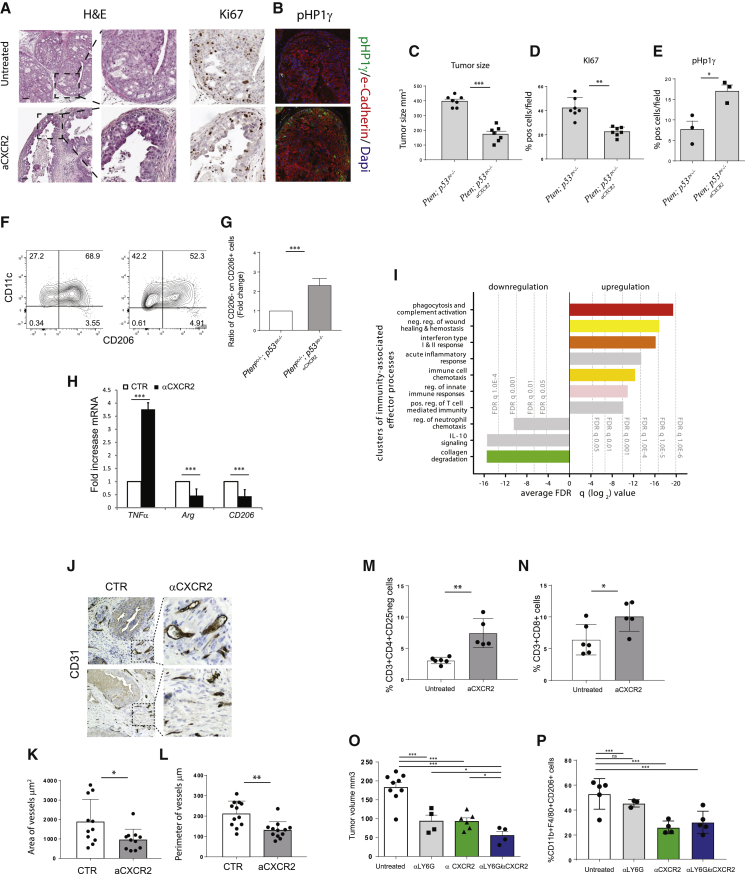
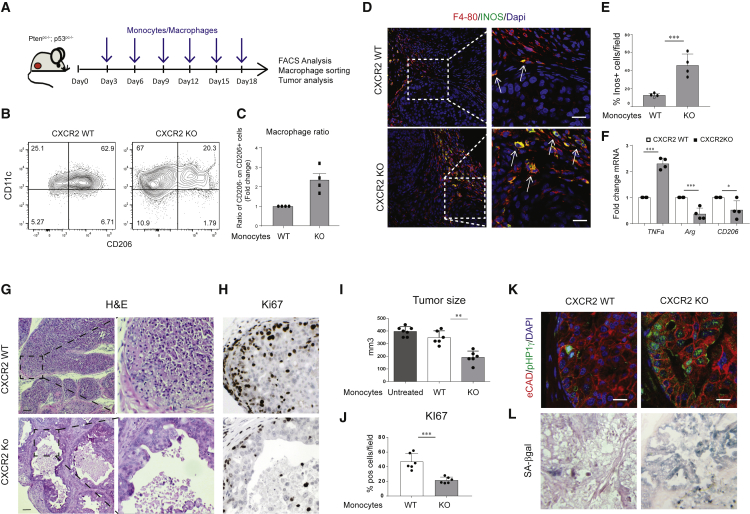
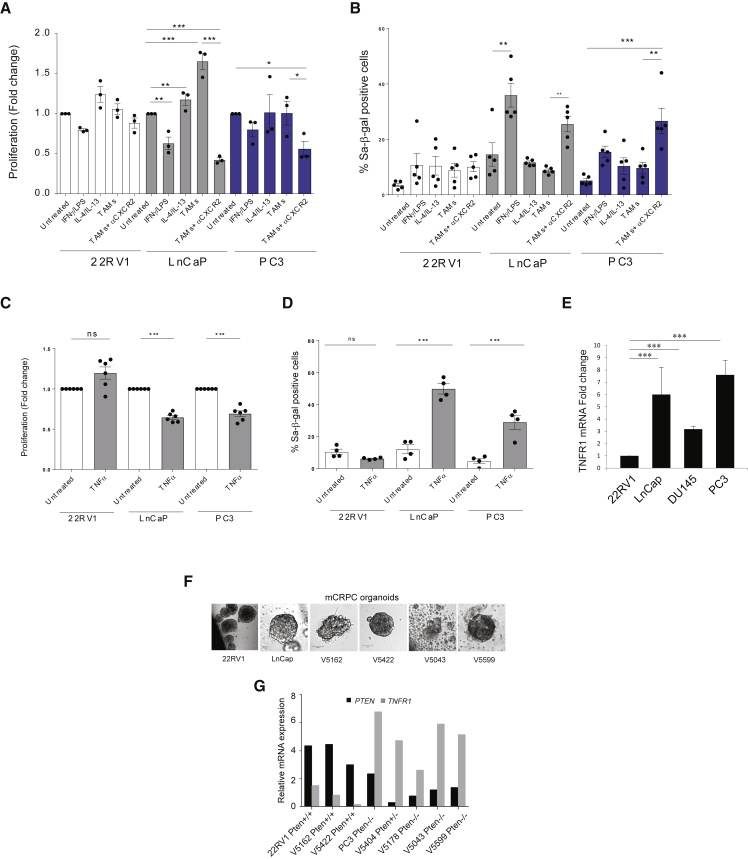
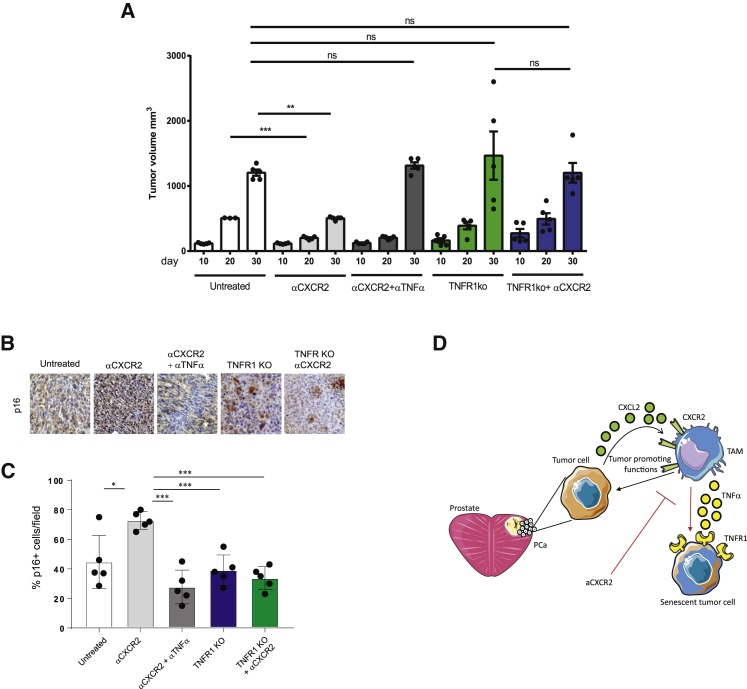
Tumor-associated macrophages (TAMs) represent a major component of the tumor microenvironment supporting tumorigenesis. TAMs re-education has been proposed as a strategy to promote tumor inhibition. However, whether this approach may work in prostate cancer is unknown. Here we find that Pten-null prostate tumors are strongly infiltrated by TAMs expressing C-X-C chemokine receptor type 2 (CXCR2), and activation of this receptor through CXCL2 polarizes macrophages toward an anti-inflammatory phenotype. Notably, pharmacological blockade of CXCR2 receptor by a selective antagonist promoted the re-education of TAMs toward a pro-inflammatory phenotype. Strikingly, CXCR2 knockout monocytes infused in Ptenpc-/-; Trp53pc-/- mice differentiated in tumor necrosis factor alpha (TNF-α)-releasing pro-inflammatory macrophages, leading to senescence and tumor inhibition. Mechanistically, PTEN-deficient tumor cells are vulnerable to TNF-α-induced senescence, because of an increase of TNFR1. Our results identify TAMs as targets in prostate cancer and describe a therapeutic strategy based on CXCR2 blockade to harness anti-tumorigenic potential of macrophages against this disease.

Keywords: immune response to cancer; immunomodulation; prostate cancer; tumor associated macrophages; tumor immunology.


Conflict of interest statement

S.B. is employed in the Oncology Department of AstraZeneca, Li KaShing Centre, Cambridge, UK. A.A. and J.D.B. have received a research grant from AstraZeneca for the clinical development of AZD5069. J.D.B. has served on advisory boards for many companies, including AstraZeneca, Astellas, Bayer, Boehringer Ingelheim, Genentech/Roche, Genmab, GlaxoSmithKline, Janssen, Merck Serono, Merck Sharp & Dohme, Menarini/Silicon Biosystems, Orion, Pfizer, Sanofi-Aventis, and Taiho. The ICR has a commercial interest in abiraterone, PARP inhibition in DNA repair-defective cancers, and PI3K/AKT pathway inhibitors (no personal income). The ICR has received funding or other support for my research work from AstraZeneca, Astellas, Bayer, Genentech, GlaxoSmithKline, Janssen, Merck Serono, Merck Sharp & Dohme, Menarini/Silicon Biosystems, Orion, Sanofi-Aventis, and Taiho. J.D.B. has been the chief investigator (CI) or principal investigator (PI) of many industry sponsored clinical trials. All the other authors declare no competing interests.

Figures

None
Graphical abstract
Figure 1
Figure 1
Tumor-Associated Macrophages (TAMs) Infiltrate Prostate Cancer and Express CXCR2 (A) Representative images of H&E and Ki-67 IHC staining. Original magnification, 20×. Scale bar: 100 μm. (B and C) Anterior prostate lobe volume (mm3) (B) (see STAR Methods) and Ki-67 quantification (C) in 12-week-old Ptenpc+/+, Ptenpc−/−; Trp53pc+/+ (Ptenpc−/−), and Ptenpc−/−; Trp53pc−/−mice (n = 5 mice per group). (D and E) Representative FACS plots of immunophenotyping (D) and quantification (E) of tumor-infiltrating CD11b+Ly6GF4/80+ macrophages in 12-week-old Ptenpc−/− and Ptenpc−/−; Trp53pc−/− mice. Events are gated on CD45+CD11b+ cells (n = 5 per group). (F) Representative confocal immunofluorescence (IF) images and quantification showing the localization of F4/80+ (red) macrophages in Ptenpc−/−; Trp53pc−/−prostatic tumors. Prostatic epithelial tissue is stained with αPan-Cytokeratin antibody (PCK; green). Cells were counterstained with the nuclear marker DAPI (blue). Scale bar, 10 μm (n = 3 mice per group). (G) Representative confocal immunofluorescence images of F4/80+ (red) tumor-infiltrating macrophages in Ptenpc−/−; Trp53pc−/−prostatic tumors. Stromal cells are stained with anti-vimentin antibody (vimentin; green). Cells were counterstained with the nuclear marker DAPI (blue). Scale bar, 10 μm (n = 3 mice per group). (H and I) Representative FACS analysis (H) and quantification (I) of the mean fluorescence index (MFI) per cell of CXCR2 expression on TAMs and neutrophils in Ptenpc−/−; Trp53pc−/− prostatic tumors (n = 6 mice). Mean fluorescence intensity was measured on CD11b+CD45+F480+Ly6G TAMs and CD11b+CD45+F480LY6G+ neutrophils. (J) Graph showing analysis of the protein expression profiling from epithelia isolated from Ptenpc−/− and Ptenpc−/−; Trp53pc−/− tumors. One hundred ten proteins were analyzed by mean of the XL mouse protein array kit (R&D). All proteins included in our panel were assessed for their possible involvement in macrophage polarization by applying text-mining algorithms (Agilent Literature Search 3.1.1, in Cytoscape 3.1.1) for a minimum of 40 papers per protein. A node’s color represents mean fold change for Ptenpc−/− versus wild-type and Ptenpc−/−; Trp53pc−/− versus wild-type. Genes consistently yielding a >2-fold increase for both comparisons and showing significant matching trends for their gene expression profiles (Figure S1E) are magnified. Classical and alternatively activating polarizers are annotated with blue as font color and displayed as diamonds. Error bars are mean ± SEM. ∗∗∗p < 0.001.
Figure 2
Figure 2
CXCL2 Administration Induces a Suppressive and Pro-angiogenic Functional State in Macrophages In Vitro (A) RT-qPCR gene expression analysis of BMDMs polarized in vitro upon administration of CXCL2 recombinant protein (n = 4). (B and C) FACS analysis (B) and quantification (C) showing a carboxyfluorescein succinimidyl ester (CFSE) proliferation assays performed on isolated splenocytes exposed to macrophage-derived conditioned media (n = 3). Plots show the percentage of CD8+CFSE proliferating cells. Macrophages were polarized in presence of stimuli for 48 h, then media was washed out and replaced. Conditioned media for the experiment was collected after 24 h. (D) Representative pictures of immunofluorescence staining (left panel) and quantification (right panel) showing a tube formation assays performed on CECs (cardiac endothelial murine cells) exposed to macrophage-derived conditioned media (n = 3). Macrophages were polarized in presence of stimuli for 48 h, then media was washed out and replaced. Conditioned media for the experiment was collected after 24 h. (E) Western blot analysis (left panel) showing the levels of total Stat6, phosphorylated Stat6, and HSP90 in IL-4/IL-13 and CXCL2-polarized macrophages. The bar graph (right panel) shows the levels of pStat6 expression. The levels of pStat6 expression were normalized for the levels of total Stat6 in each sample. (F) RT-qPCR gene expression analysis of alternative macrophages prototypic markers on macrophages polarized in vitro in absence or presence of αCXCR2 1 (1 μΜ, SB265610) and αCXCR2 (1 μΜ, SB225002) (n = 5). (G) FACS analysis and quantification of a CFSE proliferation assay on isolated splenocytes exposed to macrophage-derived conditioned media in absence or presence of SB265610. Quantification is based on the frequency of CD8+CFSE proliferating cells (n = 5). Error bars are mean ± SEM. p < 0.05, ∗∗p < 0.01, and ∗∗∗p < 0.001.
Figure 3
Figure 3
αCXCR2-Mediated TAMs Reprogramming Induces Tumor Regression and Modulates T Cell Response and Vessel Size. Mice were treated with αCXCR2 (AZD5069 100 mg/kg) or vehicle, starting at the age of tumor formation (8 weeks), for 3 weeks. (A) Representative images of H&E (right panel) and Ki-67 IHC staining (right panel). Original magnification, 20×; scale bar, 50 μm. (B) pHp1γ IF staining. Original magnification, 20×; scale bar, 25 μm. (C) Volume of anterior prostate lobes (see STAR Methods); n = 7. (D) and E) Ki-67 (D) and pHp1γ quantification (E) in Ptenpc−/−; p53pc−/− prostatic tumors upon αCXCR2 treatment (n = 7 and n = 3, respectively). (F and G) Representative immunophenotyping plot (F) and quantification (G) of CD11c+CD206 pro-inflammatory and CD11c+/−CD206+ tumor-promoting macrophages (Mazzieri et al., 2011) infiltrating the tumor upon administration of αCXCR2. Events are gated on CD45+CD11b+F4/80+ cells (n = 5 mice per group). (H) RT-qPCR gene expression analysis on CD45+/F4/80+ macrophages sorted from tumors (n = 4). (I) Unbiased systematic analyses of coordinated alterations following gene expression profiling in TAMs isolated from the prostate of untreated and αCXCR2-treated mice (n = 3 per group). Graph shows significantly altered clusters of immunity-associated effector processes. Bars represent the average log2FDRq values of the gene sets included in each cluster. (J) Representative images of CD31 IHC staining on anterior lobe prostate of Ptenpc−/−; Trp53pc−/−mice upon αCXCR2 treatment. Original magnification 20×. (K and L) Quantification of area (K) and perimeter (L) of vessels in the tumor area (n = 3). (M and N) Quantification of the frequency of infiltrating CD4+CD25 (M) and CD8+ T cells (N) in prostatic tumors before and after αCXCR2 treatment. Events are gated on CD45+ cells (n = 5 mice per group). (O) Volume of anterior prostate lobes (see STAR Methods) at the end of the treatments. (P) Quantification of CD45+CD11b+F4/80+CD206+ anti-inflammatory macrophages infiltrating the tumor upon treatments. Ptenpc−/−; Trp53pc−/−mice were treated with αCXCR2 (AZD5069 100 mg/kg), 1A8 (αLy6G antibody), or αCXCR2/1A8 for 3 weeks, starting at the age of tumor formation (8 weeks). Events are gated on CD45+CD11b+ cells (n = 4 mice per group). Error bars are mean ± SEM. p < 0.05, p < 0.01, and ∗∗∗p < 0.001.
Figure 4
Figure 4
CXCR2-Depleted Monocytes Infusion Drives TAM Re-education and Senescence Induction in Ptenpc−/−; p53pc−/− Tumors (A) Schedule of treatment used in the pre-clinical trial with CXCR2 WT or CXCR2-KO infused monocytes (n = 6 mice per group). (B and C) Representative FACS plots of immunophenotyping (B) and quantification (C) showing macrophages ratio of CD11c+CD206 pro-inflammatory and CD11c+/− CD206+ anti-inflammatory macrophages infiltrating the tumor upon infusion of CXCR2 WT or CXCR2-KO monocytes. Events are gated on CD45+CD11b+F4/80+ cells (n = 4 mice per group). (D and E) Representative confocal immunofluorescence image (D) and quantification (E) of F4/80-positive (red) and Inos-positive (green) tumor-infiltrating macrophages. Cells were counterstained with the nuclear marker DAPI (blue). Scale bar, 15 μM. (F) RT-qPCR gene expression analysis on CD45+F4/80+ macrophages sorted from tumors. (G–J) H&E (G), Ki-67 IHC staining (original magnification, 20×) (H), relative anterior prostate lobe volume compared with untreated Ptenpc−/−; p53pc−/− mice (I), and Ki-67 quantification in Ptenpc−/−; p53pc−/− prostatic tumors upon infusion of CXCR2 WT or CXCR2-KO monocytes (J). (K) Immunofluorescence staining of e-Cadherin-positive (red) and pHP1γ-positive (green) epithelial cells in Ptenpc−/−; p53pc−/− prostatic tumors upon infusion of CXCR2 WT or CXCR2-KO monocytes. Cells were counterstained with the nuclear marker DAPI (blue). Scale bar, 20 μm. (L) Representative images of SA-βgalactosidase IHC staining on Ptenpc−/−; p53pc−/− prostatic tumors. Original magnification, 40×. Scale bar, 100 μm. Error bars are mean ± SEM. ∗∗p < 0.01 and ∗∗∗p < 0.001.
Figure 5
Figure 5
Pro-inflammatory Macrophages Induce Growth Arrest and Senescence Enhancement in Pten-Null Tumors (A and B) Bar graph showing fold change in cell proliferation (A) and percentage (B) of SA-b-galactosidase positive human cancer cells exposed to conditioned media from stimulated macrophages. Macrophages were either untreated or stimulated with the following: IFNγ/LPS, IL-4/IL-13, and conditioned media from PC3 cancer cells ± aCXCR2. (C and D) Bar graph showing fold change in cell proliferation (C) and percentage (D) of SA-b-galactosidase positive cells from 22Rv1, LnCaP, and PC3 treated with recombinant TNFα. (E) RT-qPCR analysis of TNFR1 expression in the three human cell lines. (F) Bright-field images from three-dimensional (3D) culture of CRPC patient-derived organoids and cell line-derived organoids (hanging drop) acquired with Zeiss LSM700 confocal laser scanning microscope. (G) RT-qPCR analysis showing the anti-correlation of PTEN and TNFR1 relative expression in human mCRPC patient-derived organoids. Bar chart showing fold change comparison between each gene in reference to a PTEN +/+ control (22Rv1) and Lamin A/C used as a housekeeping gene. Error bars are mean ± SEM (n = 2). p < 0.05, ∗∗p = 0.0071 (two-way ANOVA), and ∗∗∗p < 0.001.
Figure 6
Figure 6
TNFα Neutralization Disrupts the Efficacy of CXCR2 Blockade in Syngeneic Prostate Tumors In Vivo For the allograft experiments, 2.5 × 106 TRAMP-C1 cells were injected subcutaneously into the flank of male C57BL/6 mice. When tumors were approximately 200 mm3, mice were randomized to the treatment groups. Tumor growth was monitored daily by measuring the tumor size with caliper. Mice were treated with αCXCR2 (AZD5069 100 mg/kg) daily for 3 weeks. (A) Bar graph showing the relative tumor volume (mm3) at days 10, 20, and 30 after injection in mice bearing TRAMPTRAMP-C1C1 Pten−/−; Trp53−/− allografts treated with αCXCR2 with or without combination with a monoclonal antibody for TNFα. The graph is also showing the tumor size of Pten−/−; Trp53−/− TNFR1−/− TRAMP-C1 cells in the presence or absence of αCXCR2 treatment, at the same time points. CRISPR/Cas9 was performed on TRAMP-C1 cells to delete TNFR1. (B and C) Representative images of IHC staining (B) and quantification (C) of p16 in all the conditions. (D) Schematic model showing the mechanism by which CXCR2 blockade reprograms TAMs in prostate tumors. Error bars are mean ± SEM. p < 0.05, ∗∗p < 0.01, and ∗∗∗p < 0.001.

References

    1. Alimonti A., Carracedo A., Clohessy J.G., Trotman L.C., Nardella C., Egia A., Salmena L., Sampieri K., Haveman W.J., Brogi E. Subtle variations in Pten dose determine cancer susceptibility. Nat. Genet. 2010;42:454–458. - PMC - PubMed
    1. Baer C., Squadrito M.L., Laoui D., Thompson D., Hansen S.K., Kiialainen A., Hoves S., Ries C.H., Ooi C.H., De Palma M. Suppression of microRNA activity amplifies IFN-γ-induced macrophage activation and promotes anti-tumour immunity. Nat. Cell Biol. 2016;18:790–802. - PubMed
    1. Beatty G.L., Torigian D.A., Chiorean E.G., Saboury B., Brothers A., Alavi A., Troxel A.B., Sun W., Teitelbaum U.R., Vonderheide R.H. A phase I study of an agonist CD40 monoclonal antibody (CP-870,893) in combination with gemcitabine in patients with advanced pancreatic ductal adenocarcinoma. Clin. Cancer Res. 2013;19:6286–6295. - PMC - PubMed
    1. Beyne-Rauzy O., Recher C., Dastugue N., Demur C., Pottier G., Laurent G., Sabatier L., Mansat-De Mas V. Tumor necrosis factor alpha induces senescence and chromosomal instability in human leukemic cells. Oncogene. 2004;23:7507–7516. - PubMed
    1. Bingle L., Brown N.J., Lewis C.E. The role of tumour-associated macrophages in tumour progression: implications for new anticancer therapies. J. Pathol. 2002;196:254–265. - PubMed

Publication types

MeSH terms