. 2019 Sep:118:101859.
doi: 10.1016/j.tube.2019.101859. Epub 2019 Aug 12.

Distinct serum biosignatures are associated with different tuberculosis treatment outcomes

Affiliations

Distinct serum biosignatures are associated with different tuberculosis treatment outcomes

Katharina Ronacher et al. Tuberculosis (Edinb). 2019 Sep.

Abstract

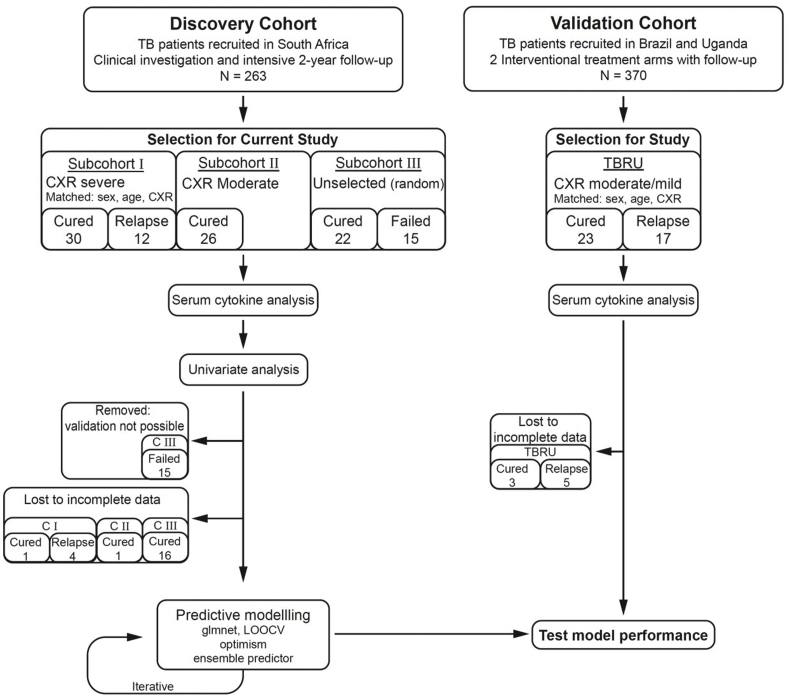
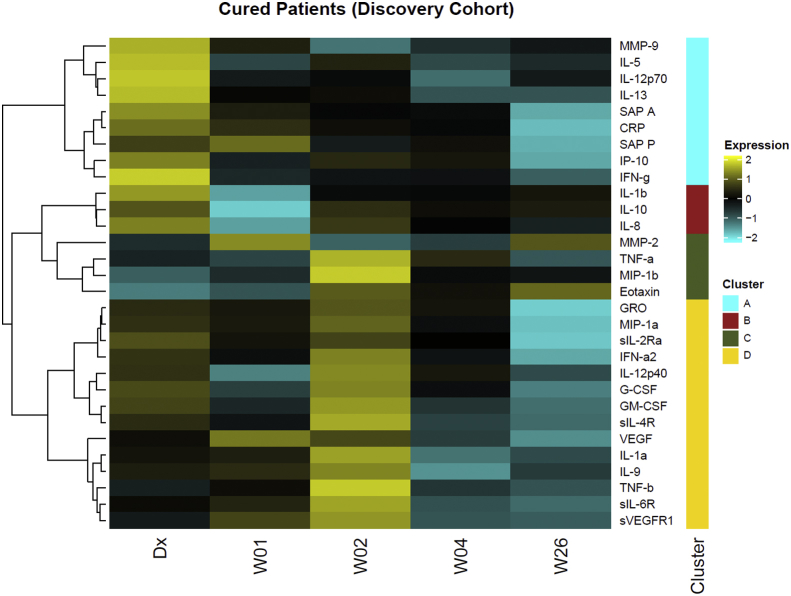
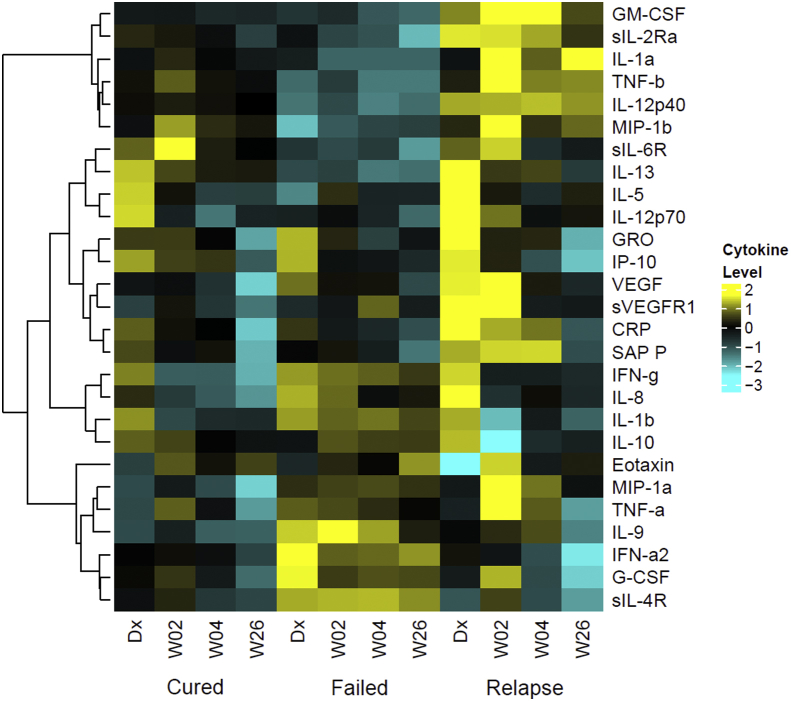
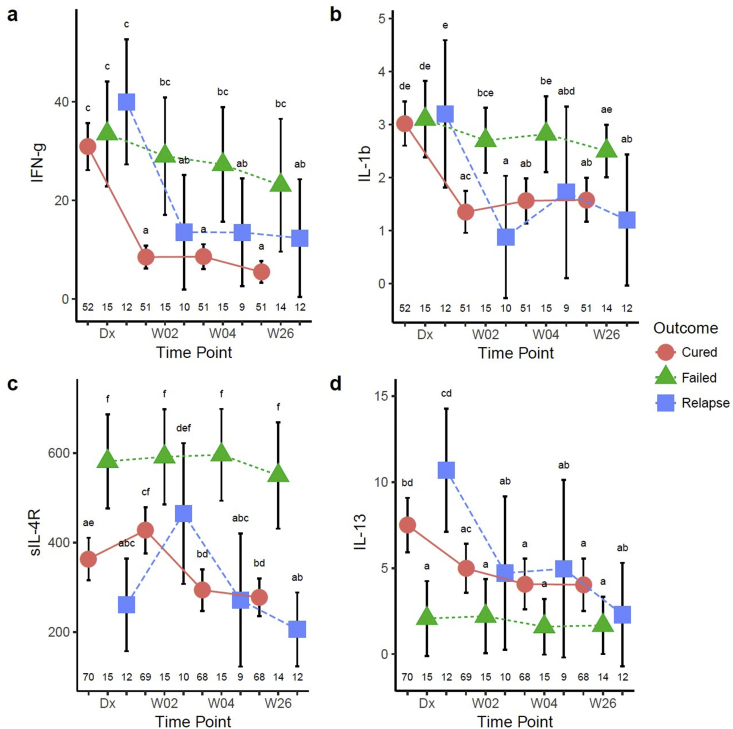
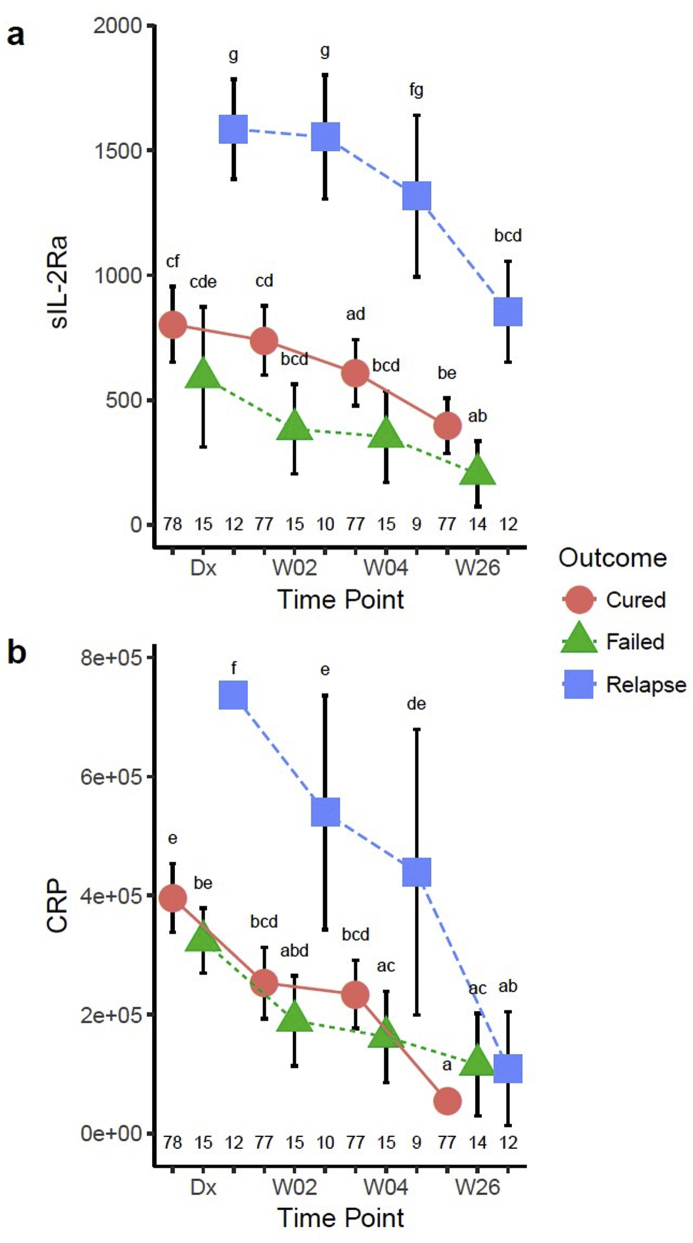
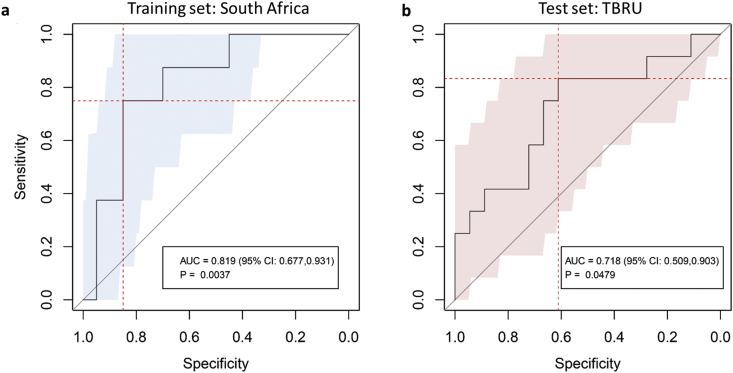
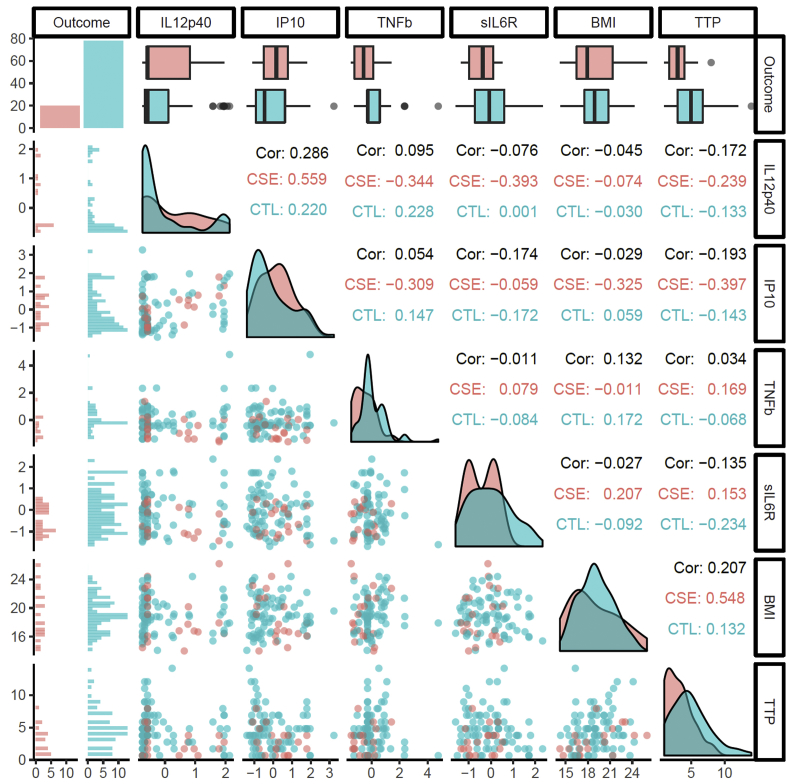
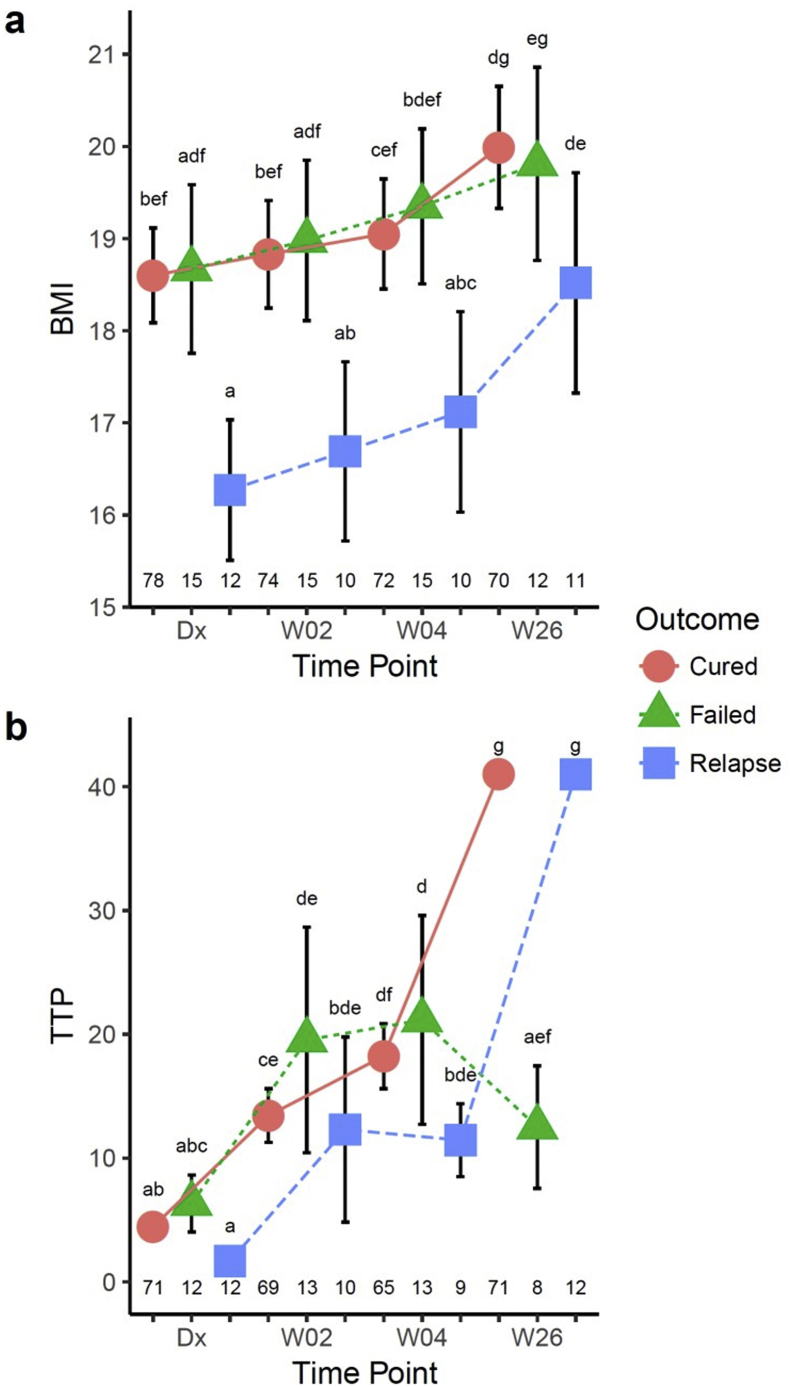
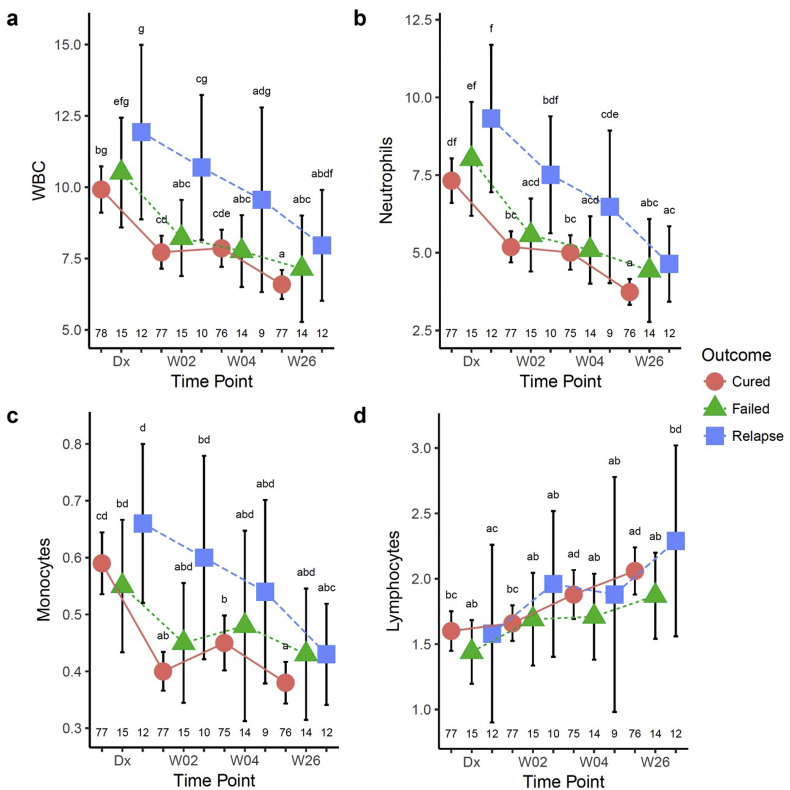
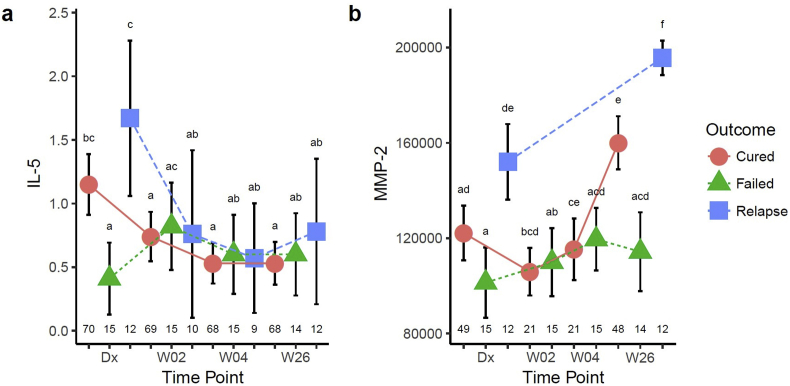
Biomarkers for TB treatment response and outcome are needed. This study characterize changes in immune profiles during TB treatment, define biosignatures associated with treatment outcomes, and explore the feasibility of predictive models for relapse. Seventy-two markers were measured by multiplex cytokine array in serum samples from 78 cured, 12 relapsed and 15 failed treatment patients from South Africa before and during therapy for pulmonary TB. Promising biosignatures were evaluated in a second cohort from Uganda/Brazil consisting of 17 relapse and 23 cured patients. Thirty markers changed significantly with different response patterns during TB treatment in cured patients. The serum biosignature distinguished cured from relapse patients and a combination of two clinical (time to positivity in liquid culture and BMI) and four immunological parameters (TNF-β, sIL-6R, IL-12p40 and IP-10) at diagnosis predicted relapse with a 75% sensitivity (95%CI 0.38-1) and 85% specificity (95%CI 0.75-0.93). This biosignature was validated in an independent Uganda/Brazil cohort correctly classifying relapse patients with 83% (95%CI 0.58-1) sensitivity and 61% (95%CI 0.39-0.83) specificity. A characteristic biosignature with value as predictor of TB relapse was identified. The repeatability and robustness of these biomarkers require further validation in well-characterized cohorts.

Keywords: Biomarkers; Relapse; Treatment failure; Tuberculosis; Tuberculosis treatment.


Figures

Fig. 1
Fig. 1
Overall study design and numbers of patients included in the South African discovery cohort and TBRU cohort. Patients were selected from the discovery cohort in three phases (subcohort I − III) as funding became available. Of the 263 TB patients recruited in South Africa 12 had documented relapse. Initially these 12 relapse patients were selected and matched according to sex, age and extent of disease on chest X-ray (CXR) at diagnosis (subcohort I). As those patients all had extensive disease, 26 cured patients with moderate extent of disease on CXR were added in phase 2 (subcohort II). Finally, 15 treatment failure patients were added as well as 22 randomly selected cured patients (subcohort III). The prediction models using combined clinical, microbiological and immunological parameters were then applied to the TBRU cohort (validation cohort), which consisted of 17 relapse patients and 23 matched cured patients from Uganda and Brazil.
Fig. 2
Fig. 2
Cytokine expression patterns during TB treatment in South African cured patients. Heatmap of serum cytokine levels in 78 cured patients at diagnosis, weeks 1, 2, 4 and 26 of TB treatment. We performed unsupervised hierarchical clustering of 30 markers with Euclidean distance as the metric and the Ward D method of agglomeration, which resulted in four distinct cytokine clusters (A–D). We first log2 transformed and centered the data by protein. Bright yellow (+2) indicates 4-fold upregulation from the mean (black) and bright blue (−2) indicates a 4-fold downregulation from the mean. (For interpretation of the references to color in this figure legend, the reader is referred to the Web version of this article.)
Fig. 3
Fig. 3
Cytokine expression patterns during TB treatment in cured, failed and relapsed TB patients in South Africa. Heatmap of serum cytokine concentrations in 78 cured, 15 failed and 12 relapse patients at diagnosis, weeks 2, 4 and 26 of TB treatment. The heatmap was generated as in Fig. 2. Only cytokines detected in serum of all three patient groups are shown. Bright yellow (+2) indicates 4-fold upregulation from the mean (black) and bright blue (−3) indicates an 8-fold downregulation from the mean. (For interpretation of the references to color in this figure legend, the reader is referred to the Web version of this article.)
Fig. 4
Fig. 4
Patients with failed therapy have different serum cytokine profiles from those with microbiological cure at 6 months (cure and relapse patients) in South Africa. Serum IFN-γ (a), IL-1β (b), sIL-4R (c) and IL-13 (d) were determined in cured, failed and relapse patients at diagnosis, weeks 2, 4, and 26 of treatment and analyzed by a mixed model repeated measures ANOVA. Each data point represents the mean and the error bars denote the 95% confidence intervals. Cytokine data are shown in pg/ml. The letters a – f indicate statistical significance where values with the same letter are not significantly different from each other. The number of patients in each group at each time-point (n) is indicated above the x-axis. A p-value of <0.05 was regarded as significantly different.
Fig. 5
Fig. 5
Cytokines significantly different between relapse and cured/failed patients. Serum sIL-2R alpha (pg/ml) (a) and CRP (ng/ml) (b) were determined in cured, failed and relapse patients at diagnosis, weeks 2, 4, and 26 of treatment and analyzed by a mixed model repeated measures ANOVA. Each data point represents the mean and the error bars denote the 95% confidence intervals. The letters a – f indicate statistical significance where values with the same letter are not significantly different from each other. The number of patients in each group at each time-point (n) is indicated above the x-axis. A p-value of <0.05 was regarded as significantly different.
Fig. 6
Fig. 6
Receiver operating characteristic (ROC) curve for discriminating relapse patients from cured patients at the start of TB treatment in the discovery/training and validation/test cohorts. A predictive model was generated using glmnet and patients who were recruited in South Africa (discovery cohort) in three phases (subcohort I − III). The predictive model was built using the leave-one-out cross-validation (LOOCV) consisting of 68 individual models (a). The predictive model (average of 68 individual predictions) based on combined clinical, microbiological and immunological parameters was then applied to the TBRU cohort (validation cohort) from Uganda and Brazil (b). Relapse patients can be distinguished from cured patients using six markers measured at diagnosis: BMI, TTP, TNF-β, sIL-6R, IL-12p40 and IP-10 with an area under the curve of 0.819 [95% CI 0.679–0.942] for the training set (a) and 0.718 [95% CI 0.509–0.903] for the validation set (b).
Supplemental Fig. 1
Supplemental Fig. 1
Distribution of optimism scores for the training set. We estimated model performance using Harrell's optimism by creating 500 bootstrap (sampling with replacement) iterations of the training set. We performed the full modeling process on the bootstrap training set and predicted on the test set and computed the C statistics (essentially equivalent to the area under the curve) for both. Optimism is defined as Cboot−Ctest. The ideal optimism is as small as possible.
Supplemental Fig. 2
Supplemental Fig. 2
Relationship between final model variables: Outcome, IL12p40, IP10, TNFb, sIL6R, BMI and TTP. BMI and TTP are on their original scale, whereas the cytokines have been scaled (Z-transform). The figure produced using the GGAlly R package [25] is a matrix showing the pairwise relationship between variables with labels for the column (top) and row (right). The diagonal shows the distributions of the variables as either bar graphs for binary variables (Outcome) or smoothed density plots by Outcome for continuous variables. The first column shows histograms of the continuous variables split by Outcome for each variable. The first row shows box plots by Outcome. The lower triangle (below the diagonal) shows pairwise scatter plots and the upper triangle shows the correlation coefficients: Cor, overall; CSE, relapse case; CTL, cured with no relapse “control”. Colors: coral, relapse; sea green, cured. The complex relationship between variables is illustrated by the scatterplots for BMI, TTP, and sIL6R. For a diagonal line with a negative slope through each of the scatterplots, relapse cases with high BMI and moderately high TTP, sIL6R increases the separation and brings them closer to the other relapse cases. The other variables similarly provide some separation that, weighted appropriately in the glmnet model, contribute to the model's discrimination and robustness.
Supplemental Fig. 3
Supplemental Fig. 3
BMI and TTP of cured, failed and relapse patients. BMI during the course of TB treatment (a), time to culture positivity (TTP) in days (BACTEC 460 method) during treatment (b) of cured, failed and relapse patients. Data were analyzed by a mixed-effect repeated-measures ANOVA. Each data point represents the mean and the error bars denote the 95% confidence intervals. BMI data are shown as kg/m2 and TTP in days. A TTP of ≥42 is considered as negative. The number of patients in each group at each time-point (n) is indicated above the x-axis. The letters a - g indicate statistical significance where values with the same letter are not significantly different from each other. A p-value of <0.05 was regarded as significantly different.
Supplemental Fig. 4
Supplemental Fig. 4
Differential blood counts in cured, failed and relapse patients during TB treatment. White blood cell counts (a), absolute numbers of neutrophils (b), monocytes (c) and lymphocytes (c) were determined in cured, failed and relapse patients at diagnosis, weeks 2, 4, and week 26 of treatment and analyzed by a mixed-effect repeated-measures ANOVA. The number of patients in each group at each time-point (n) is indicated above the x-axis. The letters a - g indicate statistical significance where values with the same letter are not significantly different from each other. A p-value of <0.05 was regarded as significantly different.
Supplemental Fig. 5
Supplemental Fig. 5
IL-5 and MMP-2 concentrations in cured, failed and relapse patients. Serum IL-5 concentrations (pg/ml) (a) were determined in cured, failed and relapse patients at diagnosis, weeks 2, 4, and 26 of treatment and MMP-2 (pg/ml) (b) concentrations at diagnosis weeks 2, 4 and 26 in cured and failed patients and at diagnosis and end of treatment in the relapse patients. Data were analyzed by a mixed-effect repeated-measures ANOVA. The number of patients in each group at each time-point (n) is indicated above the x-axis. The letters a - f indicate statistical significance where values with the same letter are not significantly different from each other. A p-value of <0.05 was regarded as significantly different.

References

    1. Hong Kong Chest Service/Tuberculosis Research Center Madras/British Medical Research C. A controlled trial of a 2-month, 3-month, and 12-month regimens of chemotherapy for sputum smear-negative pulmonary tuberculosis: the results at 30 months. Hong Kong Chest Service/Tuberculosis Research Centre, Madras/British Medical Research Council. Am Rev Respir Dis. 1981;124(2):138–142. - PubMed
    1. Imperial M.Z. A patient-level pooled analysis of treatment-shortening regimens for drug-susceptible pulmonary tuberculosis. Nat Med. 2018;24(11):1708–1715. - PMC - PubMed
    1. Mitchison D.A. Assessment of new sterilizing drugs for treating pulmonary tuberculosis by culture at 2 months. Am Rev Respir Dis. 1993;147(4):1062–1063. - PubMed
    1. Wallis R.S. Biomarkers for tuberculosis disease activity, cure, and relapse. Lancet Infect Dis. 2010;10(2):68–69. - PubMed
    1. Wallis R.S. Month 2 culture status and treatment duration as predictors of tuberculosis relapse risk in a meta-regression model. PLoS One. 2013;8(8):e71116. - PMC - PubMed

Publication types