. 2019 Aug 20;24(16):3011.
doi: 10.3390/molecules24163011.

A Mass Spectrometry-Based Study Shows that Volatiles Emitted by Arthrobacter agilis UMCV2 Increase the Content of Brassinosteroids in Medicago truncatula in Response to Iron Deficiency Stress

Affiliations

A Mass Spectrometry-Based Study Shows that Volatiles Emitted by Arthrobacter agilis UMCV2 Increase the Content of Brassinosteroids in Medicago truncatula in Response to Iron Deficiency Stress

Idolina Flores-Cortez et al. Molecules. .

Abstract

Iron is an essential plant micronutrient. It is a component of numerous proteins and participates in cell redox reactions; iron deficiency results in a reduction in nutritional quality and crop yields. Volatiles from the rhizobacterium Arthrobacter agilis UMCV2 induce iron acquisition mechanisms in plants. However, it is not known whether microbial volatiles modulate other metabolic plant stress responses to reduce the negative effect of iron deficiency. Mass spectrometry has great potential to analyze metabolite alterations in plants exposed to biotic and abiotic factors. Direct liquid introduction-electrospray-mass spectrometry was used to study the metabolite profile in Medicago truncatula due to iron deficiency, and in response to microbial volatiles. The putatively identified compounds belonged to different classes, including pigments, terpenes, flavonoids, and brassinosteroids, which have been associated with defense responses against abiotic stress. Notably, the levels of these compounds increased in the presence of the rhizobacterium. In particular, the analysis of brassinolide by gas chromatography in tandem with mass spectrometry showed that the phytohormone increased ten times in plants grown under iron-deficient growth conditions and exposed to microbial volatiles. In this mass spectrometry-based study, we provide new evidence on the role of A. agilis UMCV2 in the modulation of certain compounds involved in stress tolerance in M. truncatula.

Keywords: DLI-ESI-MS; Fe deficiency; legumes; microbial volatiles.


Conflict of interest statement

The authors declare that they have no conflict of interest.

Figures

Figure 1
Figure 1
Interaction between Medicago truncatula and rhizobacteria through the emission of volatile compounds. A 4 mL glass vial with 2 mL nutritive agar medium was inserted in each system; in the control system, 20 μL water was added into the vial instead of the bacterial inoculum. The interaction lasted for 10 days. Uninoculated 12-day-old plants grown under conditions of iron (Fe) sufficiency (a) and deficiency (d). (b) Plants were inoculated with the commensal strain Bacillus sp. L264 grown under Fe-sufficient and -deficient conditions (e). Inoculated plants exposed to volatiles from A. agilis UMCV2 and under Fe-sufficient (c) and -deficient conditions (f). (g) Dry weights of control plants and plants during interactions with bacterial volatile compounds. Data shown are means ± standard error (n = 15). White and black bars indicate Fe-sufficient and -deficient growth conditions, respectively. Different letters indicate significant differences (p ≤ 0.05) among treatments determined with two-way ANOVA and Tukey’s test.
Figure 2
Figure 2
Non-targeted metabolomic profiling normalized from leaves of Medicago truncatula obtained by DLI-ESI-MS. (a) Control plants grown under Fe-sufficient (green) and -deficient conditions (orange). (b) Plants exposed to volatile compounds from A. agilis UMCV2 for 10 days and grown under iron-sufficient (green) and -deficient conditions (orange).
Figure 3
Figure 3
Principal component analysis (PCA) obtained from DLI-ESI mass spectra of Medicago truncatula leaves under Fe-sufficient and -deficient conditions and following exposure to microbial volatiles. Blue indicates control plants, orange represents plants exposed to volatiles emitted by L264 strain, and red shows the plants exposed to volatiles from A. agilis UMCV2. Circles (O) and triangles (Δ) indicate Fe sufficiency and deficiency, respectively. The ellipses represent 95% confidence intervals. Differences between groups were compared with a PERMANOVA test (p < 0.001).
Figure 4
Figure 4
Ion importance ranking obtained by Random Forest model for differentiating between sample treatments with DLI-ESI mass spectra data. The thirty most important ions are shown for discriminating between Fe growth conditions (a) and the effect of microbial volatiles (b). Ntrees = 500, OOB error = 0% for Fe growth conditions and 43.75% for volatiles.
Figure 5
Figure 5
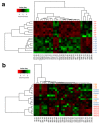
Metabolomic heatmap generated with the 30 most important ions detected by the Random Forest model for Fe availability (a) and bacterial volatiles (b). Heatmap combined with an analysis of cluster hierarchical using Euclidean distance between experimental units and Ward’s algorithm for classification by ion (along x-axis) and by treatment (along y-axis).
Figure 6
Figure 6
Identification of brassinolide in Medicago truncatula by GC-MS. (a) Total ion chromatogram of the epibrassinolide standard, indicating the retention time of the phytohormone and the electron impact mass spectrum during the SIM analysis. (b) Total ion chromatogram and mass spectrum obtained from the control plants grown under conditions of iron (Fe) deficiency. (c) Total ion chromatogram and mass spectrum obtained from plants grown under conditions of Fe deficiency and exposed to volatiles from A. agilis UMCV2. (d) Brassinolide content in plants grown under Fe-sufficient (white bars) and -deficient (black bars) growth conditions. Data shown are means ± standard error (n = 3). Different letters indicate significant differences (p ≤ 0.05) among treatments determined with two-way ANOVA followed by a Tukey’s test.

References

    1. Analytical Methods Committee AMCTB No. 81. A “periodic table” of mass spectrometry instrumentation and acronyms. Anal. Methods. 2017;9:5086–5090. - PubMed
    1. García-Flores M., Juárez-Colunga S., García-Casarrubias A., Trachsel S., Winkler R., Tiessen A. Metabolic profiling of plant extracts using direct-injection electrospray ionization mass spectrometry allows for high-throughput phenotypic characterization according to genetic and environmental effects. J. Agric. Food Chem. 2015;63:1042–1052. doi: 10.1021/jf504853w. - DOI - PubMed
    1. Gamboa-Becerra R., Montero-Vargas J., Martínez-Jarquín S., Gálvez-Ponce E., Moreno-Pedraza A., Winkler R. Rapid classification of coffee products by data mining models from direct electrospray and plasma-based mass spectrometry analyses. Food Anal. Methods. 2016;10:1359–1368. doi: 10.1007/s12161-016-0696-y. - DOI
    1. González-Domínguez R., Sayago A., Fernández-Recamales A. High-throughput mass-spectrometry based-metabolomics to characterize metabolite fingerprints associated with Alzheimer’s disease pathogenesis. Metabolites. 2018;8:52. doi: 10.3390/metabo8030052. - DOI - PMC - PubMed
    1. Montero-Vargas J., Casarrubias-Castillo K., Martínez-Gallardo N., Ordaz-Ortiz J., Délano-Frier J., Winkler R. Modulation of steroidal glycoalkaloid biosynthesis in tomato (Solanum lycopersicum) by jasmonic acid. Plant. Sci. 2018;277:155–165. doi: 10.1016/j.plantsci.2018.08.020. - DOI - PubMed

MeSH terms