. 2019 Aug 20;20(16):4057.
doi: 10.3390/ijms20164057.

Therapeutic and Protective Effects of Liposomal Encapsulation of Astaxanthin in Mice with Alcoholic Liver Fibrosis

Affiliations

Therapeutic and Protective Effects of Liposomal Encapsulation of Astaxanthin in Mice with Alcoholic Liver Fibrosis

Yu Chiuan Wu et al. Int J Mol Sci. .

Abstract

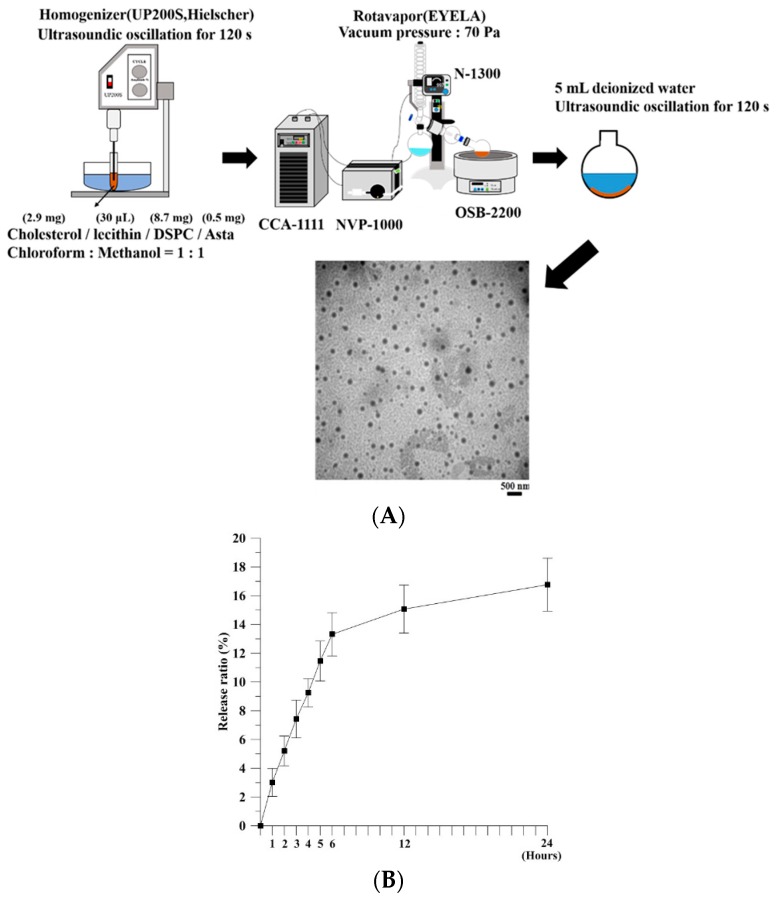
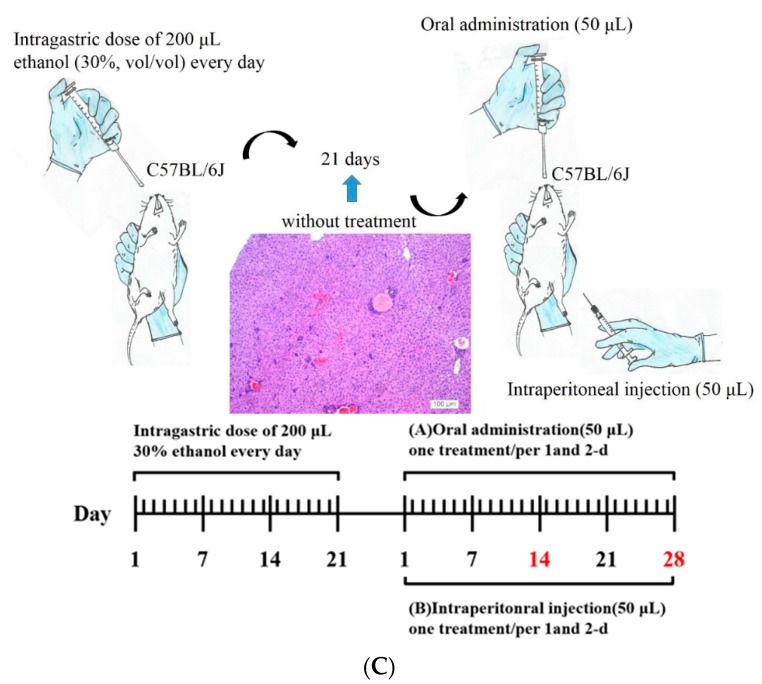
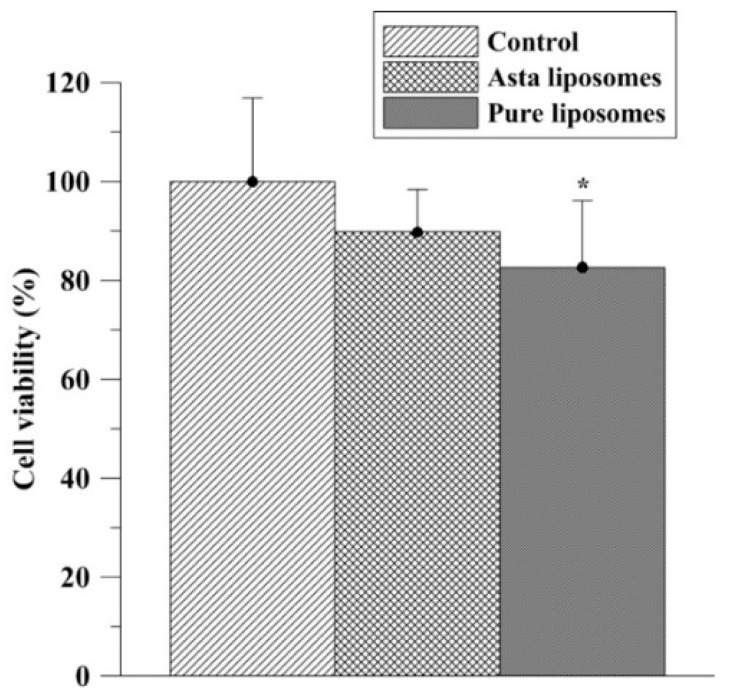
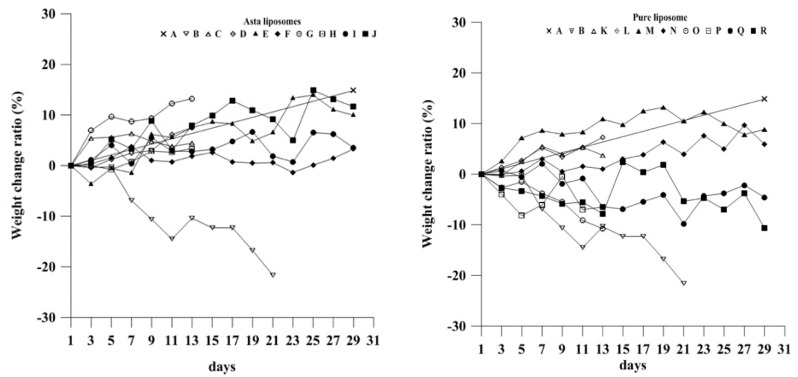
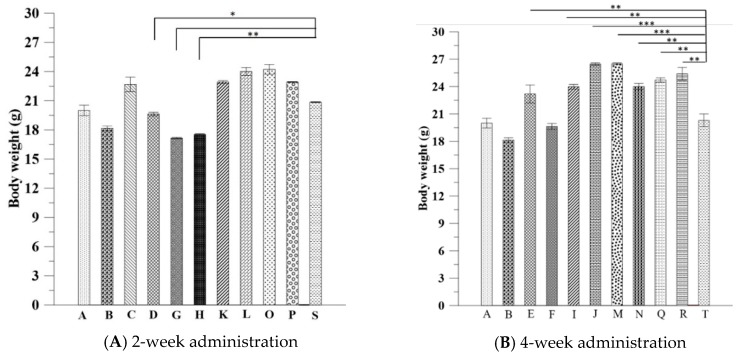
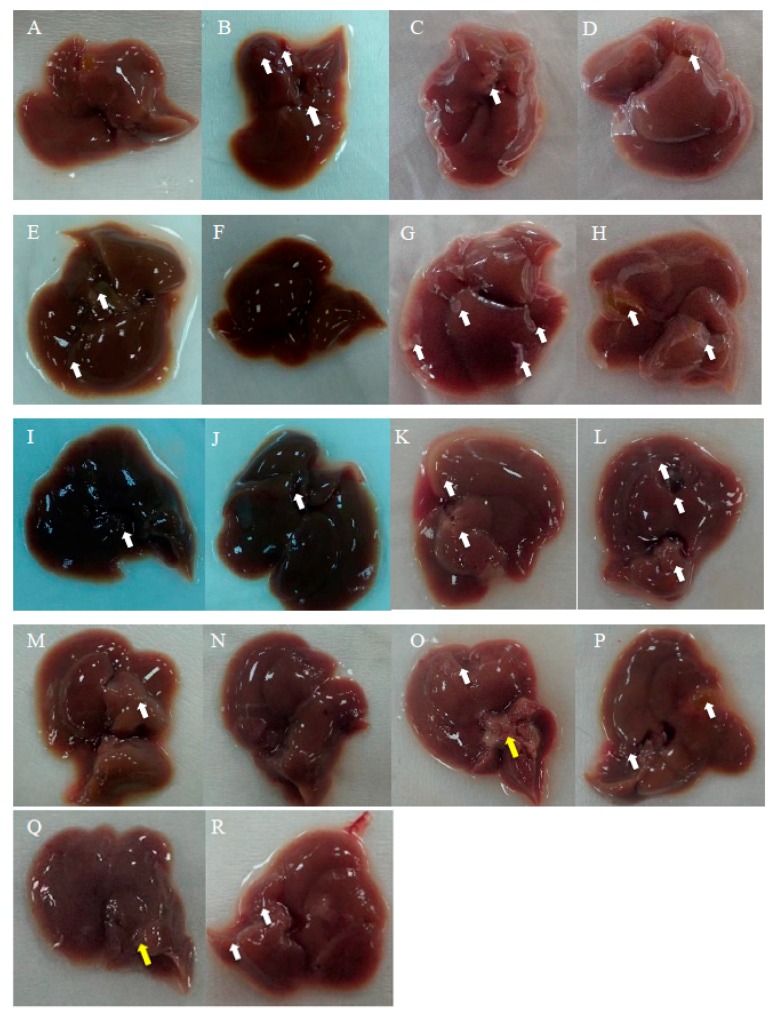
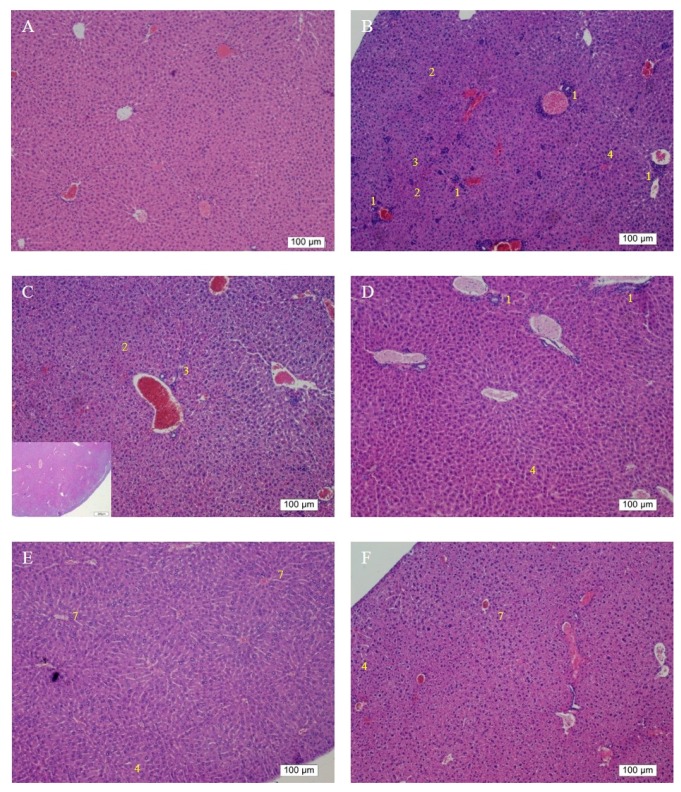
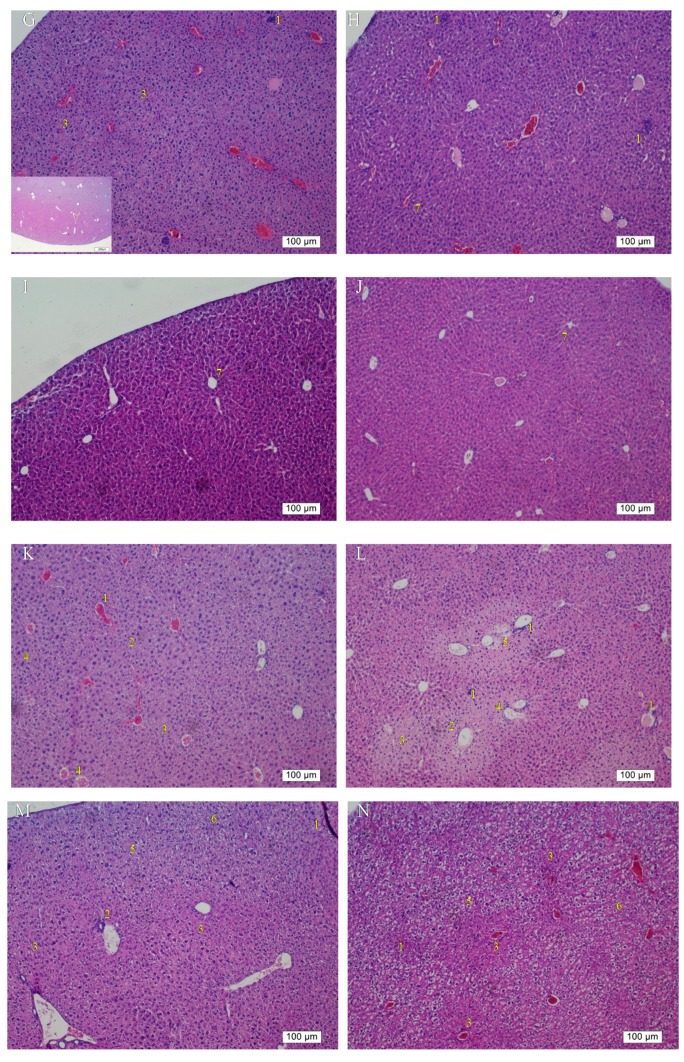
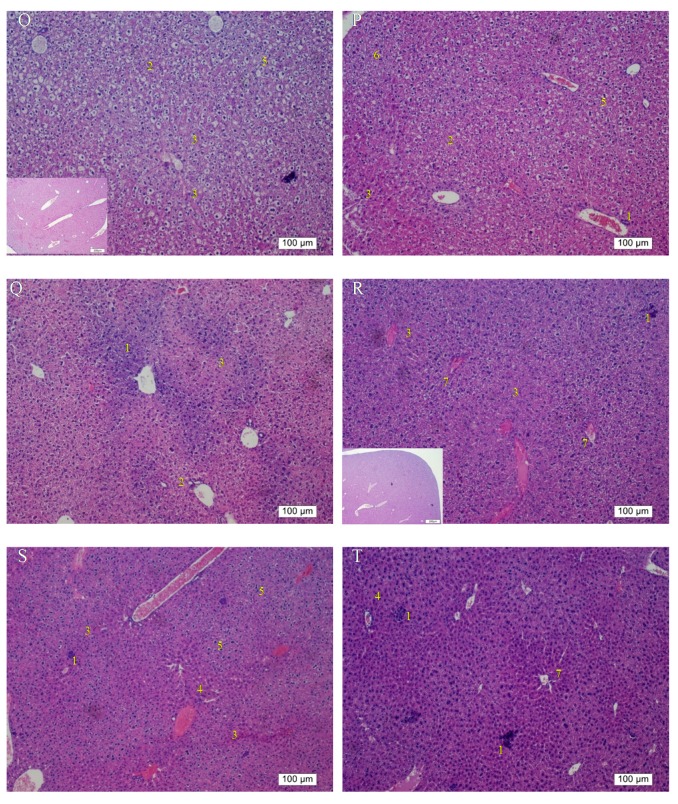
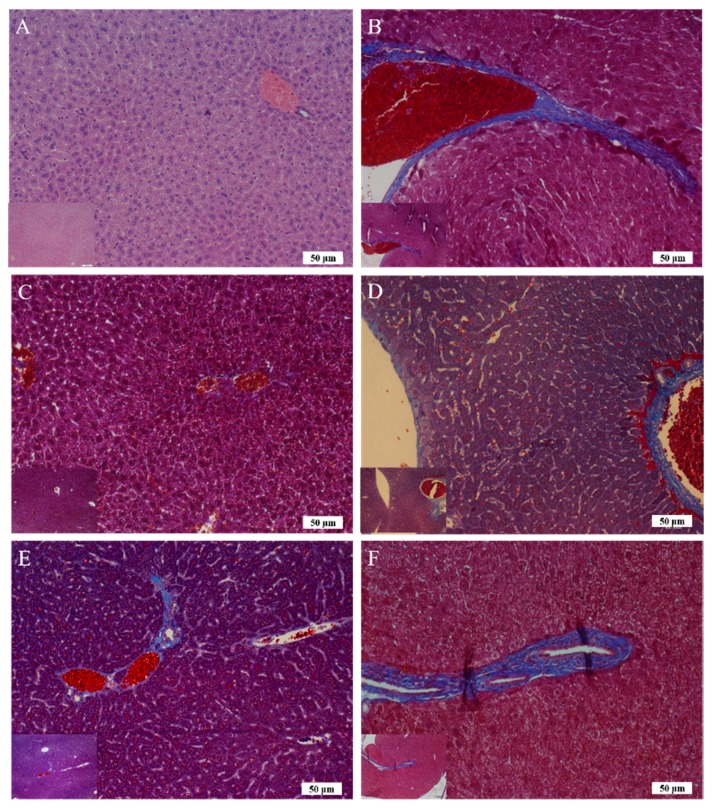
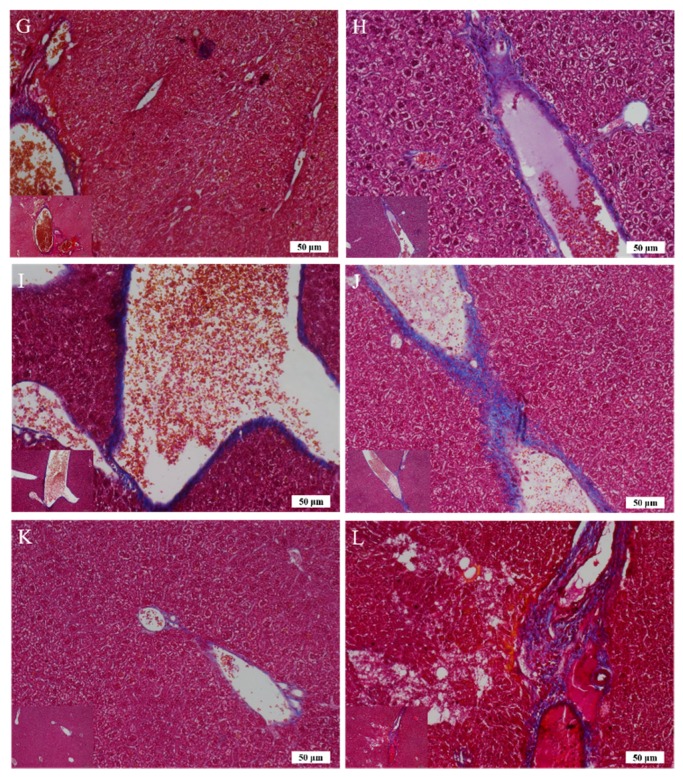
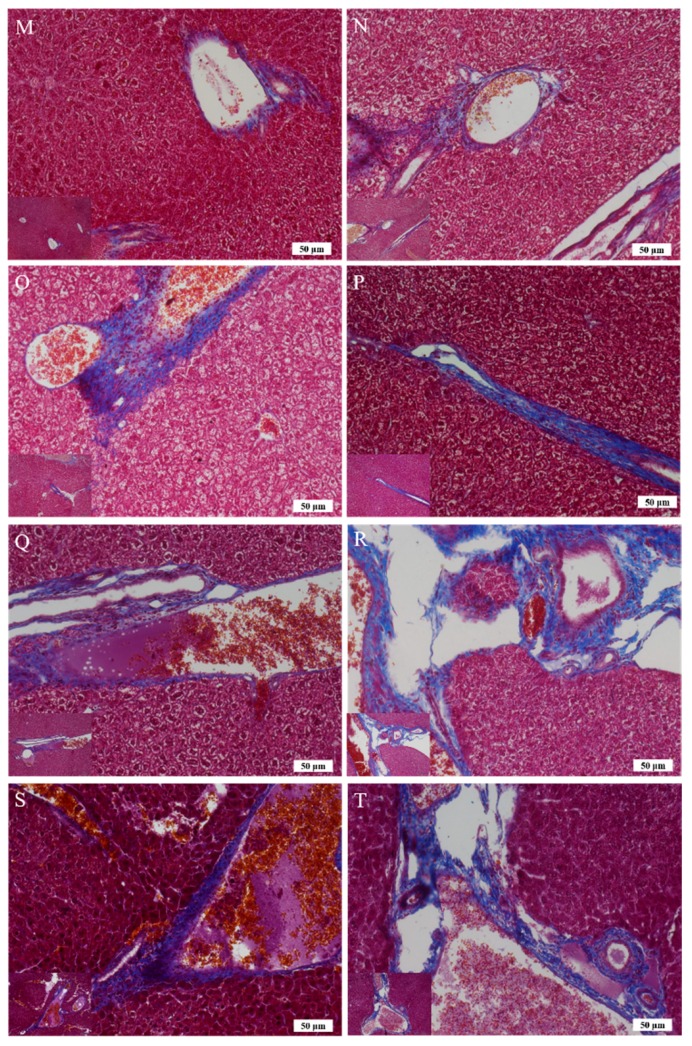
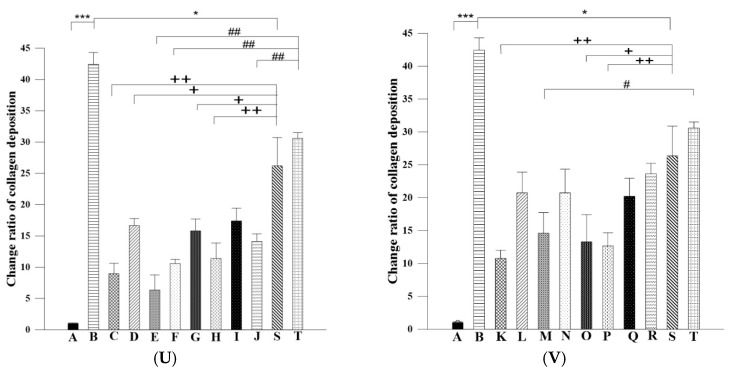
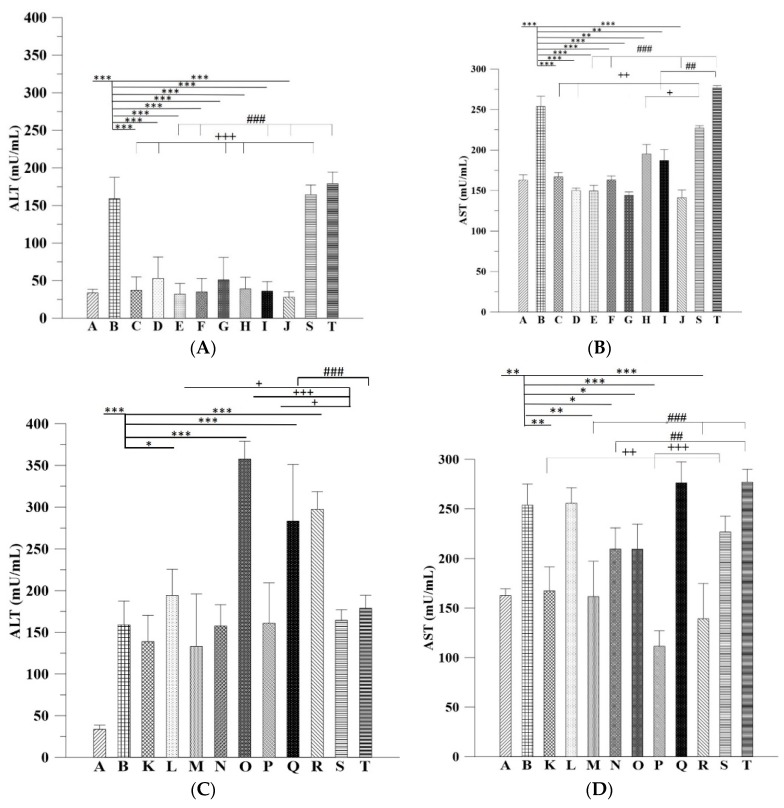
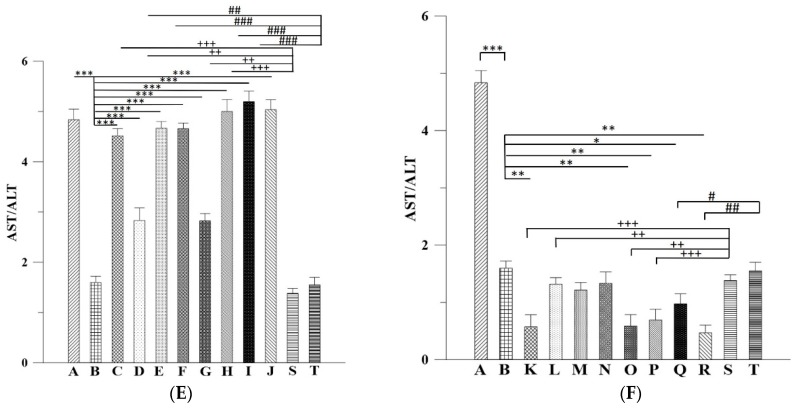
Astaxanthin (Asta) has been demonstrated to possess anti-inflammatory, antitumor, and free radical-clearing activities. However, the poor stability and low water solubility of Asta hamper its bioavailability. The objectives of this study were to fabricate Asta-loaded liposomes (Asta-lipo) and investigate the therapeutic effects of Asta-lipo on alcoholic liver fibrosis in mice. The mice were administered with Asta-lipo or liposomes alone prior to a 3-week dose containing 30% alcohol with or without feeding with a second dose of 30% alcohol. The prepared Asta-lipo of 225.0 ± 58.3 nm in diameter, had an encapsulation efficiency of 98%. A slow release profile of 16.2% Asta from Asta-lipo was observed after a 24-h incubation. Restorative actions against alcoholic liver fibrosis were observed after oral administration of Asta-lipo for 4 weeks. Hepatic repair, followed by a second dose of 30% alcohol, suggested that Asta-lipo exerted protective and reparative effects against liver injuries induced by repeated consumption of alcohol. The changes of serum ALT and AST values were principally in consistence with the histopathologic findings. Asta-lipo exerted rapid and direct effects against repeated alcohol-induced liver disease, whereas Asta-lipo given orally could boost recovery from liver injuries obtained due to previous long-term alcohol use. These data demonstrate that Asta-lipo has applicable protective and therapeutic potential to treat alcohol-induced liver diseases.

Keywords: alcohol; astaxanthin; intraperitoneal injection; liposome; liver fibrosis.


Conflict of interest statement

The authors declare no conflict of interest.

Figures

Figure 1
Figure 1
(A) Schematic of the Asta-lipo fabrication processes and the TEM images of the produced Asta-lipo. The TEM shows that the diameter of the fabricated Asta-lipo was approximately 225.0 ± 58.2 nm (mean ± SD). (B) Profile of Asta released from Asta-lipo (N = 3, data are presented as the mean ± SEM by one-way analysis of variance (ANOVA)). (C) Schematic representation and time scale of the establishment of alcoholic disease and administration routes on the mouse model (scale bar: day).
Figure 1
Figure 1
(A) Schematic of the Asta-lipo fabrication processes and the TEM images of the produced Asta-lipo. The TEM shows that the diameter of the fabricated Asta-lipo was approximately 225.0 ± 58.2 nm (mean ± SD). (B) Profile of Asta released from Asta-lipo (N = 3, data are presented as the mean ± SEM by one-way analysis of variance (ANOVA)). (C) Schematic representation and time scale of the establishment of alcoholic disease and administration routes on the mouse model (scale bar: day).
Figure 2
Figure 2
Effects of pure liposomes and Asta liposomes (Asta-lipo) at 0.01 mg/mL on the viability of L929 fibroblasts assessed using the 3-(4,5-dimethylthiazol-2-yl)-2,5-diphenyltetrazolium bromide (MTT) assay after 24-h incubation. Control stands for incubation with the vehicle for the same period (24 h) as Asta-lipo and pure liposomes. Pure liposomes slightly but significantly reduced the viability of the normal fibroblasts (N = 3, data are presented as the mean ± SEM, * P < 0.05 by ANOVA compared to control).
Figure 3
Figure 3
Cell cycle distribution analysis of L929 fibroblasts after (A) 24- and (B) 48-h treatment with 0.01 mg/mL pure liposomes or Asta-lipo. No significant differences were found in the cell cycle phases prior to treatment with pure liposomes or Asta-lipo.
Figure 4
Figure 4
The weight change ratio of mice in each experimental group. Mice that received Asta-lipo gained weight normally, whereas mice in Groups O–R that received repeated alcohol intake lost weight, which was similar to the result in the untreated mice in Group B (Groups which received 2-week p.o and i.p. administration with Asta-lipo or pure liposomes were compared to Group S; Groups which received 4-week p.o and i.p. administration with Asta-lipo or pure liposomes were compared to Group T; N = 4, * P < 0.05, ** P < 0.01 and *** P < 0.001, by ANOVA).
Figure 4
Figure 4
The weight change ratio of mice in each experimental group. Mice that received Asta-lipo gained weight normally, whereas mice in Groups O–R that received repeated alcohol intake lost weight, which was similar to the result in the untreated mice in Group B (Groups which received 2-week p.o and i.p. administration with Asta-lipo or pure liposomes were compared to Group S; Groups which received 4-week p.o and i.p. administration with Asta-lipo or pure liposomes were compared to Group T; N = 4, * P < 0.05, ** P < 0.01 and *** P < 0.001, by ANOVA).
Figure 5
Figure 5
Gross observations of the liver in mice with or without treatment with Asta-lipo or pure liposomes for 2 and 4 weeks on the mouse model that received two modes of alcohol administration. The categorization of the experimental groups is shown in Table 1. Group A shows the liver of normal mice, and Group B received alcohol for 3 weeks to induce alcoholic disease. Mice were given Asta-lipo or pure liposomes for 2 or 4 weeks prior to the administration of 30% alcohol for 3 weeks (Groups CF and KN) or 3-week alcohol administration plus a second dose of 30% alcohol (Groups GJ and OR). White arrows indicate the enlarged liver lobe coupled with some white deposits, and yellow arrows show the locations of fibrotic tissues.
Figure 6
Figure 6
H&E staining and histopathological analysis of the liver in the experimental mice that received alcohol through two modes. Group A showed normal mice liver as Group B represented the mice received 3-week 30% alcohol feeding. Mice were given Asta-lipo or pure liposomes for 2 or 4 weeks prior to the 3-week 30% alcohol consumption (Groups CF and KN) or 3-week 30% alcohol administration plus a second dose of 30% alcohol (Groups GJ and OR). Mice in Groups S and T received alcohol for 3 weeks without any administration for 2 and 4 weeks, respectively. Histopathological lesions were observed at 100× magnification as below: 1. inflammatory cell infiltration. 2. fibrotic tissues/accumulation of fibrocytes. 3. necrosis of hepatocytes. 4. swollen hepatocytes. 5. fatty degeneration-like areas. 6. proliferation of minibile duct. 7. hepatic repair showing normal hepatic structures such as the central vein, hepatocytes, and sinusoids (N = 4).
Figure 6
Figure 6
H&E staining and histopathological analysis of the liver in the experimental mice that received alcohol through two modes. Group A showed normal mice liver as Group B represented the mice received 3-week 30% alcohol feeding. Mice were given Asta-lipo or pure liposomes for 2 or 4 weeks prior to the 3-week 30% alcohol consumption (Groups CF and KN) or 3-week 30% alcohol administration plus a second dose of 30% alcohol (Groups GJ and OR). Mice in Groups S and T received alcohol for 3 weeks without any administration for 2 and 4 weeks, respectively. Histopathological lesions were observed at 100× magnification as below: 1. inflammatory cell infiltration. 2. fibrotic tissues/accumulation of fibrocytes. 3. necrosis of hepatocytes. 4. swollen hepatocytes. 5. fatty degeneration-like areas. 6. proliferation of minibile duct. 7. hepatic repair showing normal hepatic structures such as the central vein, hepatocytes, and sinusoids (N = 4).
Figure 7
Figure 7
(AT) Masson’s Trichrome staining of the liver sections in the experimental mice that received alcohol through two modes. The observations were performed at 200× magnification (the image on bottom left site was 100× magnification). Group A showed normal mice liver as Group B represented the mice received 3-week 30% alcohol feeding. Mice were given Asta-lipo or pure liposomes for 2 or 4 weeks prior to the 3-week 30% alcohol consumption (Groups CF and KN) or 3-week 30% alcohol administration plus a second dose of 30% alcohol (Groups GJ and OR) as shown in Table 1. (U and V). Mice were treated with Asta-lipo (subfigure U) or pure liposomes (subfigure V) for 2 and 4 weeks and the collagen content in liver of each group was semi-quantitated by ImageJ software (Version 1.50, National Institutes of Health, USA). The color settings in ImageJ software was maintained at all times between the calculations of the blue-stained areas in samples. Magnification 100× was employed to evaluate the samples and the calculation was repeated in four microscopic fields. The measurement was repeated in four microscopic fields. (Group A and the treated groups were compared to Group B; Groups which received 2-week p.o and i.p. administration with Asta-lipo or pure liposomes were compared to Group S; Groups which received 4-week p.o and i.p. administration with Asta-lipo or pure liposomes were compared to Group T; N = 4, *,#,+ P < 0.05, ##,++ P < 0.01 and *** P < 0.001, by ANOVA).
Figure 7
Figure 7
(AT) Masson’s Trichrome staining of the liver sections in the experimental mice that received alcohol through two modes. The observations were performed at 200× magnification (the image on bottom left site was 100× magnification). Group A showed normal mice liver as Group B represented the mice received 3-week 30% alcohol feeding. Mice were given Asta-lipo or pure liposomes for 2 or 4 weeks prior to the 3-week 30% alcohol consumption (Groups CF and KN) or 3-week 30% alcohol administration plus a second dose of 30% alcohol (Groups GJ and OR) as shown in Table 1. (U and V). Mice were treated with Asta-lipo (subfigure U) or pure liposomes (subfigure V) for 2 and 4 weeks and the collagen content in liver of each group was semi-quantitated by ImageJ software (Version 1.50, National Institutes of Health, USA). The color settings in ImageJ software was maintained at all times between the calculations of the blue-stained areas in samples. Magnification 100× was employed to evaluate the samples and the calculation was repeated in four microscopic fields. The measurement was repeated in four microscopic fields. (Group A and the treated groups were compared to Group B; Groups which received 2-week p.o and i.p. administration with Asta-lipo or pure liposomes were compared to Group S; Groups which received 4-week p.o and i.p. administration with Asta-lipo or pure liposomes were compared to Group T; N = 4, *,#,+ P < 0.05, ##,++ P < 0.01 and *** P < 0.001, by ANOVA).
Figure 8
Figure 8
ALT, AST levels and the AST:ALT ratio of mice treated with Asta-lipo (subfigures A, B and E) or pure liposomes (subfigures C, D and F) for 2 and 4 weeks. Mice were given Asta-lipo or pure liposomes for 2 or 4 weeks prior to the 3-week 30% alcohol consumption (Groups CF and KN) or 3-week 30% alcohol administration plus a second dose of 30% alcohol (Groups GJ and OR) as shown in Table 1. The letters A to T in each subfigure represent Groups A to Group T where the treatment conditions of each group are shown in Table 1 (Group A and the treated groups were compared to Group B; Groups which received 2-week p.o and i.p. administration with Asta-lipo or pure liposomes were compared to Group S; Groups which received 4-week p.o and i.p. administration with Asta-lipo or pure liposomes were compared to Group T; N = 4, *,#,+ P < 0.05, **,##,++ P < 0.01 and ***,###,+++ P < 0.001, by ANOVA).
Figure 8
Figure 8
ALT, AST levels and the AST:ALT ratio of mice treated with Asta-lipo (subfigures A, B and E) or pure liposomes (subfigures C, D and F) for 2 and 4 weeks. Mice were given Asta-lipo or pure liposomes for 2 or 4 weeks prior to the 3-week 30% alcohol consumption (Groups CF and KN) or 3-week 30% alcohol administration plus a second dose of 30% alcohol (Groups GJ and OR) as shown in Table 1. The letters A to T in each subfigure represent Groups A to Group T where the treatment conditions of each group are shown in Table 1 (Group A and the treated groups were compared to Group B; Groups which received 2-week p.o and i.p. administration with Asta-lipo or pure liposomes were compared to Group S; Groups which received 4-week p.o and i.p. administration with Asta-lipo or pure liposomes were compared to Group T; N = 4, *,#,+ P < 0.05, **,##,++ P < 0.01 and ***,###,+++ P < 0.001, by ANOVA).

References

    1. Rehm J., Samokhvalov A.V., Shield K.D. Global burden of alcoholic liver diseases. J. Hepatol. 2013;59:160–168. doi: 10.1016/j.jhep.2013.03.007. - DOI - PubMed
    1. Natalia A.O., Srivatsan K. In vitro studies of alcohol-induced liver injury in virally-infected human hepatocytes: Advantages and limitations. Int. J. Hepatobiliary Pancreat. Dis. 2017;7:50–52.
    1. Massey V.L., Arteel G.E. Acute alcohol-induced liver injury. Front. Physiol. 2012;3:193. doi: 10.3389/fphys.2012.00193. - DOI - PMC - PubMed
    1. Le Marchand L., Hankin J.H., Kolonel L.N., Beecher G.R., Wilkens L.R., Zhao L.P. Intake of specific carotenoids and lung cancer risk. Cancer Epidemiol. Biomark. Prev. 1993;2:183–187. - PubMed
    1. Ambati R.R., Moi P.S., Ravi S., Aswathanarayana R.G. Astaxanthin: Sources, Extraction, Stability, Biological Activities and Its Commercial Applications—A Review. Mar. Drugs. 2014;12:128–152. doi: 10.3390/md12010128. - DOI - PMC - PubMed