

Molecular phylogenetics of the African horseshoe bats (Chiroptera: Rhinolophidae): expanded geographic and taxonomic sampling of the Afrotropics
- PMID: 31434566
- PMCID: PMC6704657
- DOI: 10.1186/s12862-019-1485-1
Molecular phylogenetics of the African horseshoe bats (Chiroptera: Rhinolophidae): expanded geographic and taxonomic sampling of the Afrotropics
Abstract
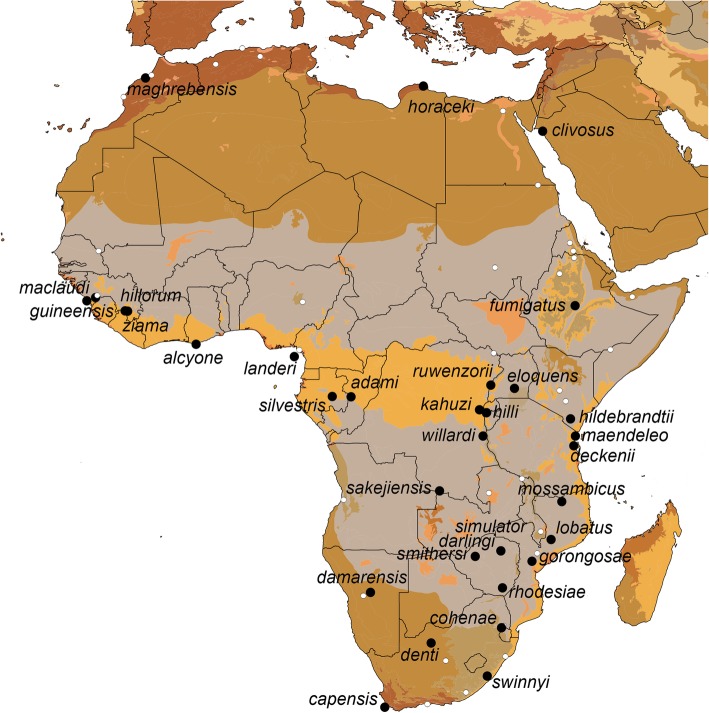
Background: The Old World insectivorous bat genus Rhinolophus is highly speciose. Over the last 15 years, the number of its recognized species has grown from 77 to 106, but knowledge of their interrelationships has not kept pace. Species limits and phylogenetic relationships of this morphologically conservative group remain problematic due both to poor sampling across the Afrotropics and to repeated instances of mitochondrial-nuclear discordance. Recent intensive surveys in East Africa and neighboring regions, coupled with parallel studies by others in West Africa and in Southern Africa, offer a new basis for understanding its evolutionary history.
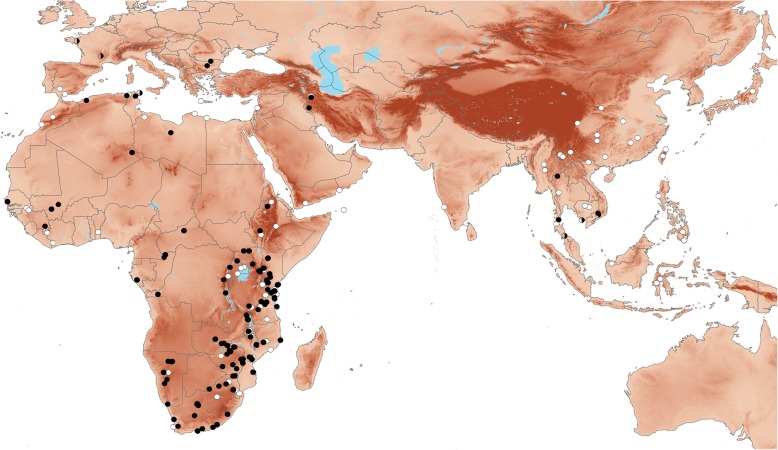
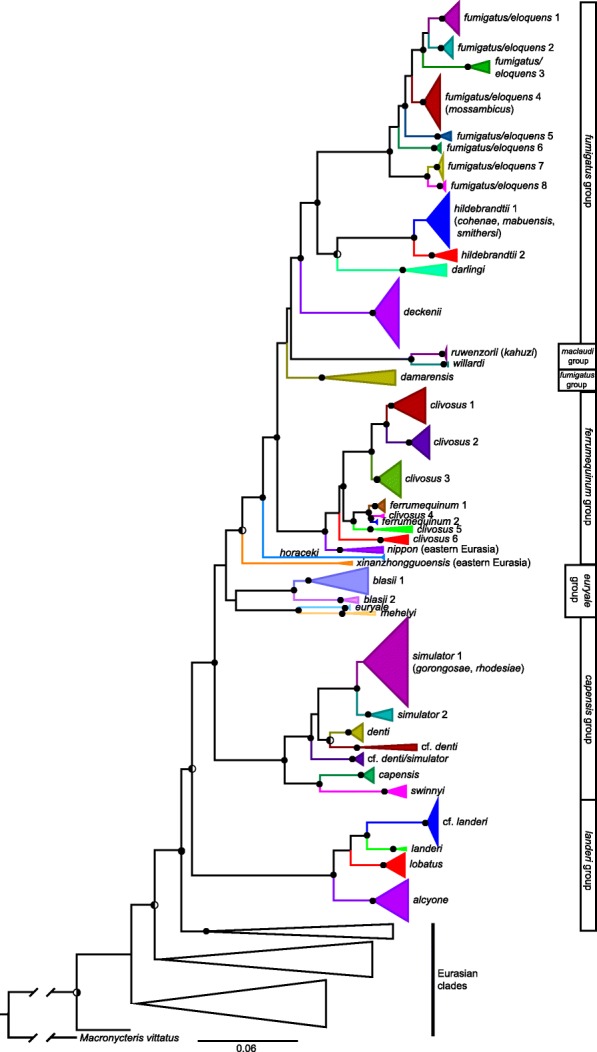
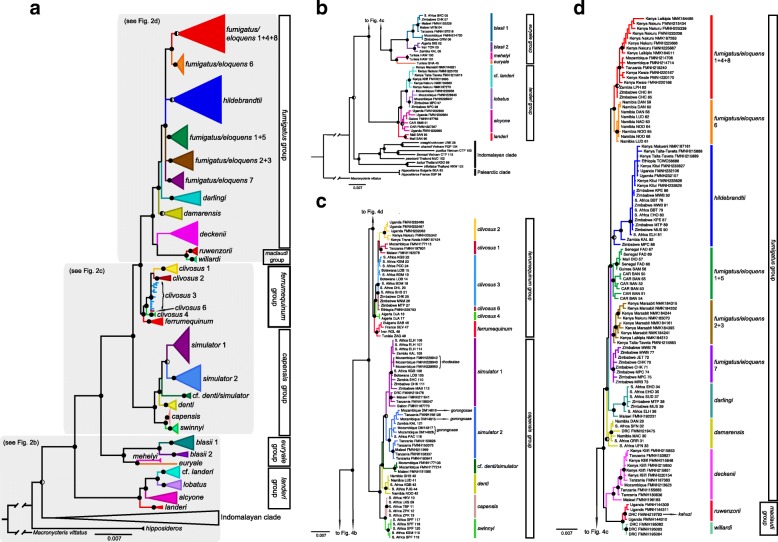
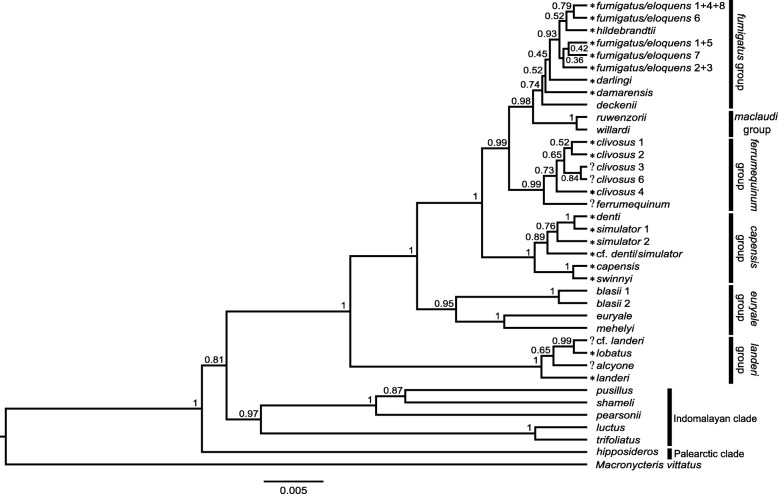
Results: We investigated phylogenetic relationships and intraspecific genetic variation in the Afro-Palearctic clade of Rhinolophidae using broad sampling. We sequenced mitochondrial cytochrome-b (1140 bp) and four independent and informative nuclear introns (2611 bp) for 213 individuals and incorporated sequence data from 210 additional individuals on GenBank that together represent 24 of the 33 currently recognized Afrotropical Rhinolophus species. We addressed the widespread occurrence of mito-nuclear discordance in Rhinolophus by inferring concatenated and species tree phylogenies using only the nuclear data. Well resolved mitochondrial, concatenated nuclear, and species trees revealed phylogenetic relationships and population structure of the Afrotropical species and species groups.
Conclusions: Multiple well-supported and deeply divergent lineages were resolved in each of the six African Rhinolophus species groups analyzed, suggesting as many as 12 undescribed cryptic species; these include several instances of sympatry among close relatives. Coalescent lineage delimitation offered support for new undescribed lineages in four of the six African groups in this study. On the other hand, two to five currently recognized species may be invalid based on combined mitochondrial and/or nuclear phylogenetic analyses. Validation of these cryptic lineages as species and formal relegation of current names to synonymy will require integrative taxonomic assessments involving morphology, ecology, acoustics, distribution, and behavior. The resulting phylogenetic framework offers a powerful basis for addressing questions regarding their ecology and evolution.
Keywords: Afrotropical biodiversity; East Africa; Introgression; Introns; Phylogeny; Rhinolophus; Species tree; Taxonomy.
Conflict of interest statement
The authors declare that they have no competing interests.
Figures
Similar articles
-
Evolutionary relationships and population genetics of the Afrotropical leaf-nosed bats (Chiroptera, Hipposideridae).Zookeys. 2020 Apr 22;929:117-161. doi: 10.3897/zookeys.929.50240. eCollection 2020. Zookeys. 2020. PMID: 32390744 Free PMC article.
-
Nuclear introns outperform mitochondrial DNA in inter-specific phylogenetic reconstruction: Lessons from horseshoe bats (Rhinolophidae: Chiroptera).Mol Phylogenet Evol. 2016 Apr;97:196-212. doi: 10.1016/j.ympev.2016.01.003. Epub 2016 Jan 28. Mol Phylogenet Evol. 2016. PMID: 26826601
-
Molecular phylogenetics and historical biogeography of Rhinolophus bats.Mol Phylogenet Evol. 2010 Jan;54(1):1-9. doi: 10.1016/j.ympev.2009.09.021. Epub 2009 Sep 18. Mol Phylogenet Evol. 2010. PMID: 19766726
-
Understanding phylogenetic incongruence: lessons from phyllostomid bats.Biol Rev Camb Philos Soc. 2012 Nov;87(4):991-1024. doi: 10.1111/j.1469-185X.2012.00240.x. Epub 2012 Aug 14. Biol Rev Camb Philos Soc. 2012. PMID: 22891620 Free PMC article. Review.
-
Systematic review of Myotis (Chiroptera, Vespertilionidae) from Chile based on molecular, morphological, and bioacoustic data.Zootaxa. 2022 Sep 21;5188(5):430-452. doi: 10.11646/zootaxa.5188.5.2. Zootaxa. 2022. PMID: 37044767
Cited by
-
Expanded ACE2 dependencies of diverse SARS-like coronavirus receptor binding domains.PLoS Biol. 2022 Jul 27;20(7):e3001738. doi: 10.1371/journal.pbio.3001738. eCollection 2022 Jul. PLoS Biol. 2022. PMID: 35895696 Free PMC article.
-
Present and future distribution of bat hosts of sarbecoviruses: implications for conservation and public health.Proc Biol Sci. 2022 May 25;289(1975):20220397. doi: 10.1098/rspb.2022.0397. Epub 2022 May 25. Proc Biol Sci. 2022. PMID: 35611534 Free PMC article.
-
Rediscovery of the critically endangered Hill's horseshoe bat (Rhinolophushilli) and other new records of bat species in Rwanda.Biodivers Data J. 2022 May 19;10:e83546. doi: 10.3897/BDJ.10.e83546. eCollection 2022. Biodivers Data J. 2022. PMID: 36761632 Free PMC article.
-
Nycteribiid bat flies (Arthropoda, Insecta, Diptera, Nycteribiidae) of Kenya.Zookeys. 2023 Jul 13;1169:65-85. doi: 10.3897/zookeys.1169.102800. eCollection 2023. Zookeys. 2023. PMID: 38328029 Free PMC article.
-
Evolutionary relationships and population genetics of the Afrotropical leaf-nosed bats (Chiroptera, Hipposideridae).Zookeys. 2020 Apr 22;929:117-161. doi: 10.3897/zookeys.929.50240. eCollection 2020. Zookeys. 2020. PMID: 32390744 Free PMC article.
References
-
- Donoghue MJ, Alverson WS. A new age of discovery. Ann Missouri Bot Gard. 2000;87:110–126.
-
- Wilson DE, Reeder DM, editors. Mammal species of the world: a taxonomic and geographic reference, 3rd ed. 3. Baltimore, MD: Johns Hopkins University Press; 2005.
-
- Burgin CJ, Colella JP, Kahn PL, Upham NS. How many species of mammals are there? J Mamm. 2018;99(1):1–11.
-
- Fujita MK, Leaché AD, Burbrink FT, McGuire JA, Moritz C. Coalescent-based species delimitation in an integrative taxonomy. Trends Ecol Evol. 2012;27(9):480–488. - PubMed
-
- Leaché AD, McElroy MT, Trinh A. A genomic evaluation of taxonomic trends through time in coast horned lizards (genus Phrynosoma). Mol Ecol. 2018. - PubMed
Publication types
MeSH terms
Substances
LinkOut - more resources
Full Text Sources
