. 2019 Nov;9(11):1574-1589.
doi: 10.1158/2159-8290.CD-18-1308. Epub 2019 Aug 21.

ADAMDEC1 Maintains a Growth Factor Signaling Loop in Cancer Stem Cells

Affiliations

ADAMDEC1 Maintains a Growth Factor Signaling Loop in Cancer Stem Cells

Ana Jimenez-Pascual et al. Cancer Discov. 2019 Nov.

Abstract

Glioblastomas (GBM) are lethal brain tumors where poor outcome is attributed to cellular heterogeneity, therapeutic resistance, and a highly infiltrative nature. These characteristics are preferentially linked to GBM cancer stem cells (GSC), but how GSCs maintain their stemness is incompletely understood and the subject of intense investigation. Here, we identify a novel signaling loop that induces and maintains GSCs consisting of an atypical metalloproteinase, ADAMDEC1, secreted by GSCs. ADAMDEC1 rapidly solubilizes FGF2 to stimulate FGFR1 expressed on GSCs. FGFR1 signaling induces upregulation of ZEB1 via ERK1/2 that regulates ADAMDEC1 expression through miR-203, creating a positive feedback loop. Genetic or pharmacologic targeting of components of this axis attenuates self-renewal and tumor growth. These findings reveal a new signaling axis for GSC maintenance and highlight ADAMDEC1 and FGFR1 as potential therapeutic targets in GBM. SIGNIFICANCE: Cancer stem cells (CSC) drive tumor growth in many cancers including GBM. We identified a novel sheddase, ADAMDEC1, which initiates an FGF autocrine loop to promote stemness in CSCs. This loop can be targeted to reduce GBM growth.This article is highlighted in the In This Issue feature, p. 1469.


Conflict of interest statement

Conflict of interest: The authors declare no conflict of interest

Figures

Figure 1:
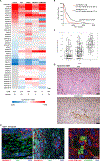
Figure 1:. ADAMDEC1 is associated with malignancy in GBM.
(A) Expression of ADAM family metalloproteinases across different GBM datasets. Expression levels were normalized to normal brain tissue samples and are presented as fold change. ADAMDEC1 is highly expressed across all datasets. (B) Kaplan-Meier survival analysis of TCGA data, stratified for above-median (high) or below-median (low) gene expression shows a significantly poorer survival in ADAMDEC1 high tumors. (C) ADAMDEC1 mRNA expression levels are significantly increased in GBM compared to lower grade gliomas (TCGA). (D) Immunohistochemistry demonstrates ADAMDEC1 expression in GBM. (E) Immunofluorescence shows ADAMDEC1 is absent in tumor-associated microglia (left and center panels; scale bars 50 µm), but is expressed in human xenografted GBM cells (far right panel; GBM cells identified by human-specific Nestin; scale bar 10 µm). Nuclei are counterstained with DAPI.
Figure 2:
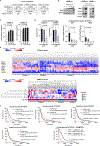
Figure 2:. ADAMDEC1 is associated with GBM stemness and secreted by GSCs.
(A) ADAMDEC1 protein is expressed in GSC, but not in NSTC culture paradigms. Likewise, GSCs secrete ADAMDEC1 into the medium. Depicted are Western blots from cell culture conditioned medium, with 10 µg protein lysate loaded per lane. (B) Knockdown of ADAMDEC1 using shRNA. Compared to non-targeting (NT) constructs, ADAMDEC1 knockdown results in decreased SOX2 and increased GFAP expression. (C) Sphere-forming frequency is reduced after ADAMDEC1 knockdown (data from two independent experiments, one-way ANOVA). (D) ADAMDEC1 knockdown results in decreased cell proliferation in GSC cultures (n=6, non-linear regression). (E) Orthotopic implantation of ADAMDEC1 knockdown cells significantly increases survival of tumor-bearing animals compared to control cells (median survival NT=43 d, #4 and #5=100d; n=10 mice/group; log rank test). (F) Treatment of GSCs with recombinant ADAMDEC1 results in increased levels of FGF2, but not GRO alpha, in the culture supernatant in a concentration-dependent manner (n=3, two-way ANOVA with Dunnet post-test). (G) ELISA shows increased levels of FGF2 in ADAMDEC1-treated GSC, but not in NSTC cultures (data from two independent experiments). (H) Western blot depicting FGFR phosphorylation after knockdown of ADAMDEC1, or after treatment with rADAMDEC1.
Figure 3:
Figure 3:. FGF2 promotes sphere formation in GBM and is linked with FGFR1.
(A) Spearman correlation of FGF2 with stem cell-associated transcription factors ZEB1, SOX2 and OLIG2 using the Glioblastoma (TCGA, Provisional) Tumor Samples with mRNA data (U133 microarray only) dataset (n=528 samples) shows significant positive correlation for each factor. (B) Treatment of primary patient-derived GBM cells with recombinant FGF2 increases ZEB1 expression in a dose-dependent manner. OLIG2 expression is also increased, whereas no change was found for SOX2. (C) FGF2 treatment results in increased sphere forming frequency of GSCs in a dose-dependent manner (hGBM L2 n=14, L0 n=10, one-way ANOVA). (D) Blocking FGF2 binding to FGFRs using a specific inhibitor (2-Naphthalenesulfonic acid, NSC 65575) reduces colony forming potential of GSCs dose-dependently (n=5, one-way ANOVA). (E) Supervised hierarchical clustering of TCGA data (n=528) using FGF2, FGFR1–4, ZEB1, SOX2 and OLIG2 reveals three separate clusters. These clusters could be validated in the HGCC dataset (below) (see text for full description). (F) Kaplan-Meier survival analysis of TCGA GBM data, stratified for above-median (high) or below-median (low) gene expression shows a significantly poorer survival in FGFR1 high tumors, but increased survival of FGFR2 high tumors. FGFR3 expression has no effect on survival. Combined analysis of FGFR1 and ADAMDEC1 shows a very strong effect on survival.
Figure 4:
Figure 4:. FGFR1 promotes stemness in GBM.
(A) Western blotting shows expression of FGFR1–3, but not FGFR-4 in primary patient-derived GBM cell lines (hGBM L0, L1, L2). (B) Flow cytometry quantification of FGFR1–3 expression in patient-derived human GBM lines (n=3 independent experiments/sample). Note that FGFR1 is expressed in a small subset of each line. (C) Knockdown of FGFR1–3 using shRNA constructs shows specificity for each receptor. Additional constructs are shown in Fig. S5. (D) Knockdown of FGFR1, but not FGFR2 or FGFR3, results in decreased sphere-forming frequency compared to control cells (hGBM L2 n=6, U3019 n=9, one-way ANOVA). (E) FGFR1 knockdown decreases expression of ZEB1, SOX2 and OLIG2 in GSCs. (F) Orthotopic implantation of FGFR1 knockdown cells significantly increases survival of tumor-bearing animals (median survival shCo: 43d, shFGFR1#1: 54.5d, shFGFR1#2: 49d; log-rank test). (G) Limiting-dilution orthotopic implantation reveals FGFR1 knockdown reduces tumorigenic potential. Stem cell frequency was calculated using ELDA (Chi square test). (H) Expression of full-length FGFR1 increases ZEB1 expression in control cells, and rescues ZEB1 expression in FGFR1 knockdown cells. (I) Full-length FGFR1 expression increases sphere-forming frequency in control cells (black bars), and rescues sphere-forming frequency of FGFR1 knockdown cells to control levels (blue bars). Knockdown of ZEB1 negates the effect of FGFR1 expression (white bars) (n=9, two-way ANOVA).
Figure 5:
Figure 5:. FGFR1 is endogenously associated with a stem cell population.
(A) Expression of FGFR1, FGFR2, ZEB1, and SOX2 is affected by the culture paradigm. FGFR1, ZEB1 and SOX2 expression are higher in GSC conditions, whereas FGFR2 and FGFR3 increase upon differentiation (diff.). (B) Flow cytometry isolation of FGFR1+ cells. Histogram shows positive FGFR1 staining in GBM cells compared to isotype control. Additional plots are shown in Fig. S5. Western analysis using an independent FGFR1 antibody demonstrates higher FGFR1 expression in FGFR1+ cells post sort, as well as increased ZEB1, SOX2 and OLIG2 expression. (C) FGFR1+ cells show greater potential for colony formation in a collagen matrix. Cells were plated in limiting-dilution colony forming assays immediately after sorting (2-way ANOVA). (D) Limiting dilution orthotopic xenografts reveal greater tumorigenicity of FGFR1+ cells. Stem cell frequency was calculated using ELDA (Chi square test).
Figure 6:
Figure 6:. FGFR1 regulates ADAMDEC1 through ZEB1.
(A) Western analysis shows increased ADAMDEC1 expression after GSC treatment with FGF2. (B) ADAMDEC1 expression is decreased after FGFR1 knockdown and increased after FGFR1 expression in GSCs. (C) ZEB1 knockdown results in decreased expression of ADAMDEC1. (D) ZEB1 overexpression increases ADAMDEC1 levels. Targeted expression of ZEB1 rescues ADAMDEC1 after ZEB1 (E) or FGFR1 (F) knockdown. (G) Predicted miR-203 binding sites in the ADAMDEC1 CDS. (H) Expression of miR-203, but not miR-200c, results in loss of ADAMDEC1.
Figure 7:
Figure 7:. FGFR1 induces ZEB1 and ADAMDEC1 through ERK1/2 signaling.
(A) Treatment with FGF2 induces phosphorylation of ERK1/2, p38 and STAT3 in control cells, but only ERK1/2 phosphorylation is attenuated by FGFR1 knockdown. (B) ERK1/2 inhibitor SCH772984 blocks phosphorylation concentration-dependently. (C) SCH772984 attenuates ERK1/2 phosphorylation after FGF2 treatment. (D) ERK1/2 inhibition decreases expression of ZEB1 and ADAMDEC1. (E) Diagram depicting the ADAMDEC1-FGFR1-ZEB1 feedback loop.

Similar articles

Cited by

References

    1. Stupp R, Hegi ME, Mason WP, van den Bent MJ, Taphoorn MJ, Janzer RC, et al. Effects of radiotherapy with concomitant and adjuvant temozolomide versus radiotherapy alone on survival in glioblastoma in a randomised phase III study: 5-year analysis of the EORTC-NCIC trial. Lancet Oncol 2009;10(5):459–66 10.1016/S1470-2045(09)70025-7. - DOI - PubMed
    1. Weller M, Butowski N, Tran DD, Recht LD, Lim M, Hirte H, et al. Rindopepimut with temozolomide for patients with newly diagnosed, EGFRvIII-expressing glioblastoma (ACT IV): a randomised, double-blind, international phase 3 trial. Lancet Oncol 2017;18(10):1373–85 10.1016/S1470-2045(17)30517-X. - DOI - PubMed
    1. Wick W, Gorlia T, Bendszus M, Taphoorn M, Sahm F, Harting I, et al. Lomustine and Bevacizumab in Progressive Glioblastoma. N Engl J Med 2017;377(20):1954–63 10.1056/NEJMoa1707358. - DOI - PubMed
    1. Verhaak RG, Hoadley KA, Purdom E, Wang V, Qi Y, Wilkerson MD, et al. Integrated genomic analysis identifies clinically relevant subtypes of glioblastoma characterized by abnormalities in PDGFRA, IDH1, EGFR, and NF1. Cancer Cell 2010;17(1):98–110 10.1016/j.ccr.2009.12.020. - DOI - PMC - PubMed
    1. Capper D, Jones DTW, Sill M, Hovestadt V, Schrimpf D, Sturm D, et al. DNA methylation-based classification of central nervous system tumours. Nature 2018;555(7697):469–74 10.1038/nature26000. - DOI - PMC - PubMed

Publication types