. 2019 Aug 21;10(1):3761.
doi: 10.1038/s41467-019-11696-7.

Genotoxic stress-triggered β-catenin/JDP2/PRMT5 complex facilitates reestablishing glutathione homeostasis

Affiliations

Genotoxic stress-triggered β-catenin/JDP2/PRMT5 complex facilitates reestablishing glutathione homeostasis

Lixue Cao et al. Nat Commun. .

Abstract

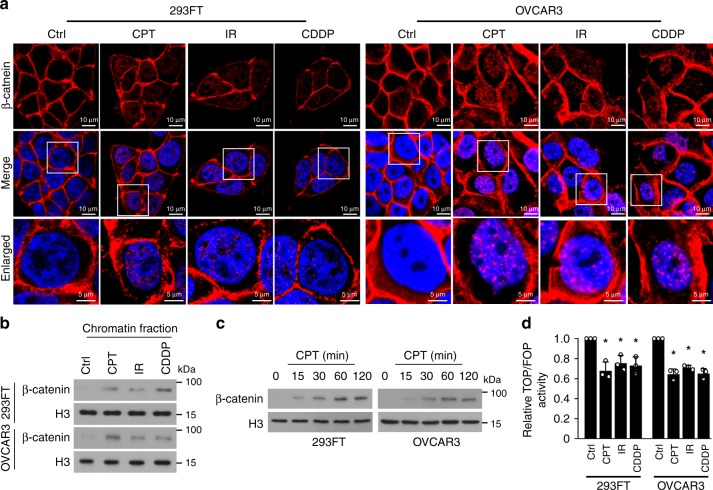
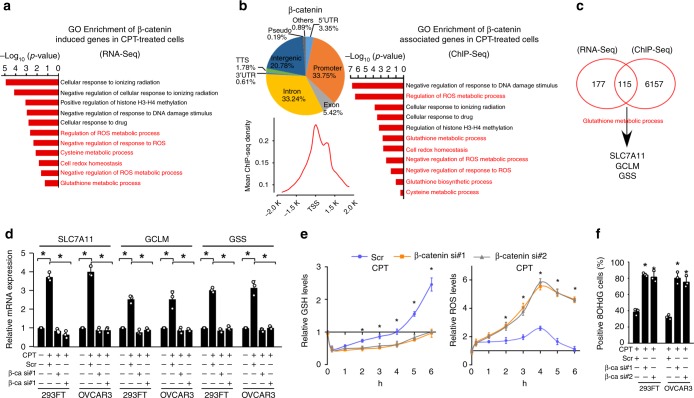
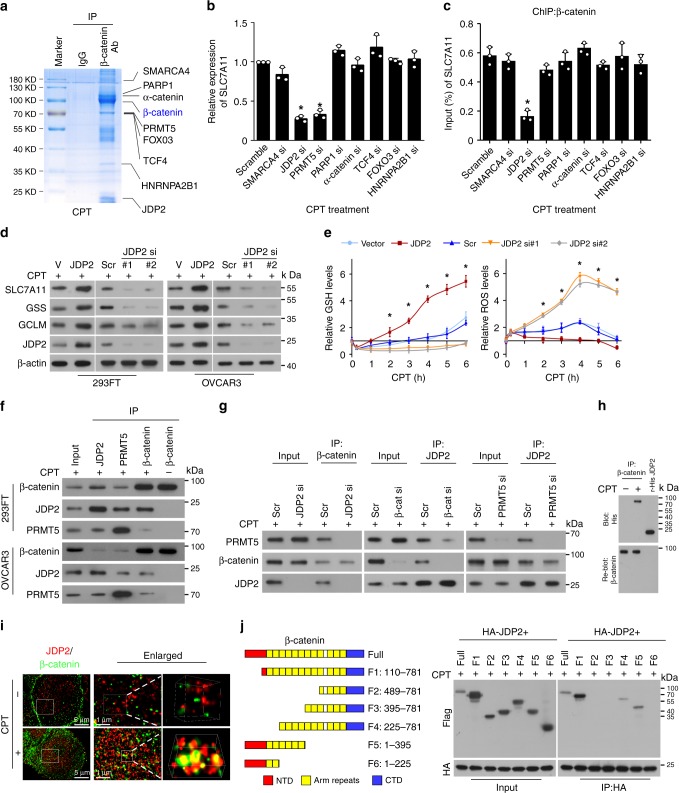
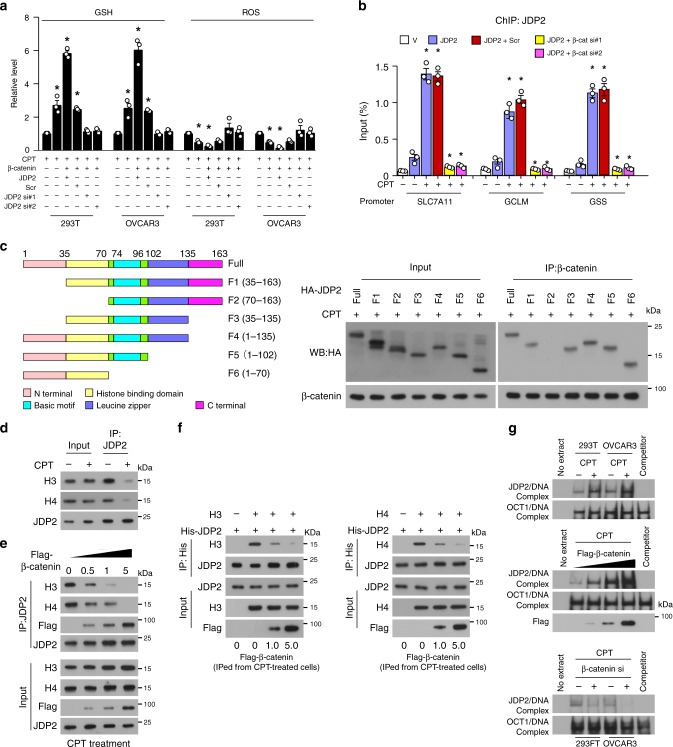
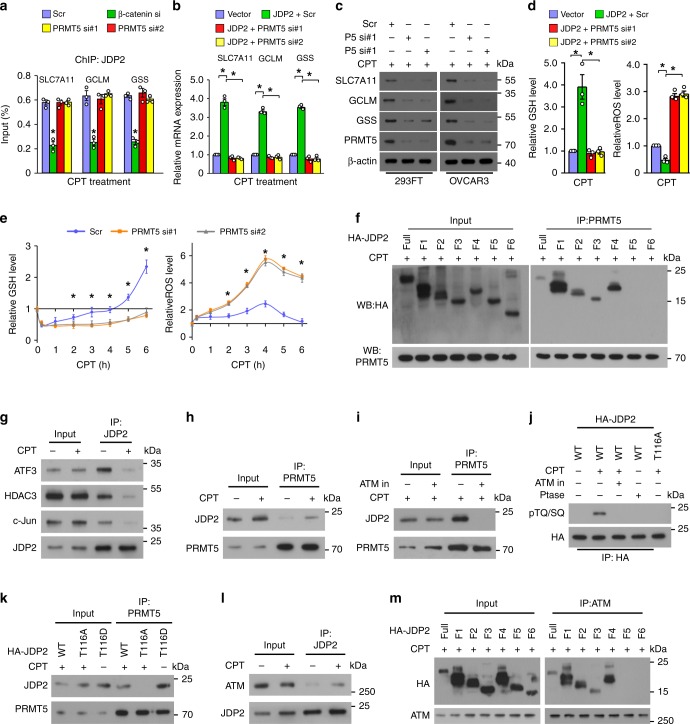
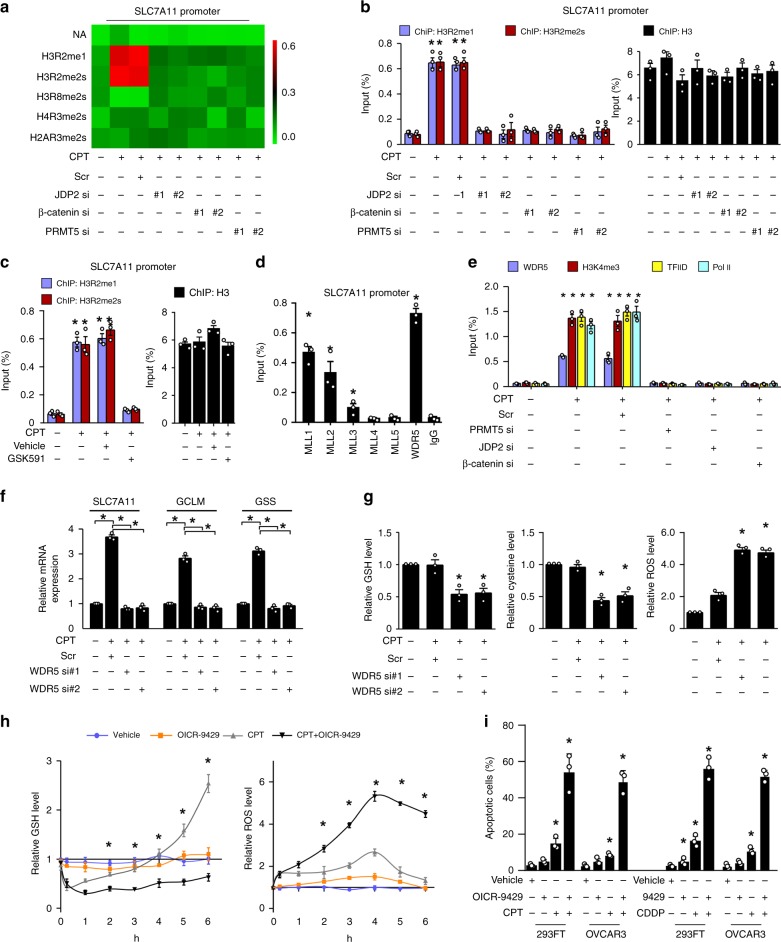
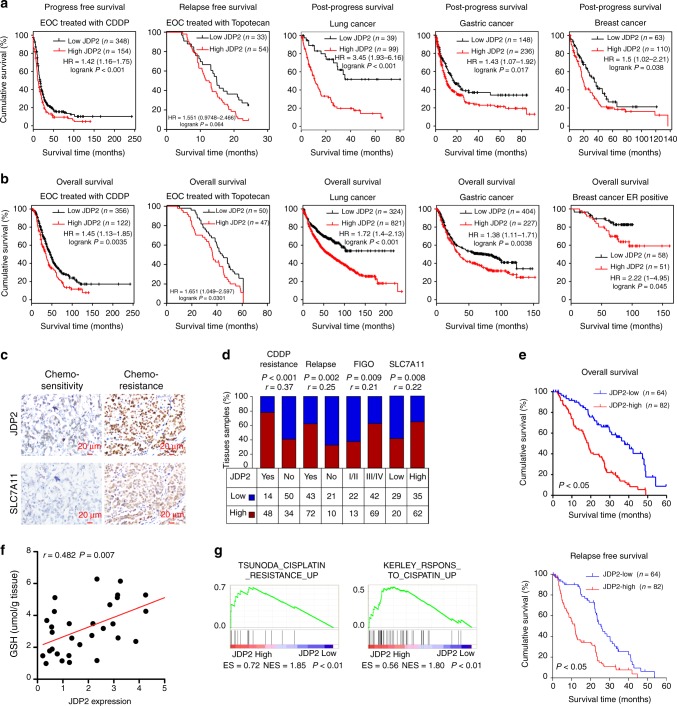
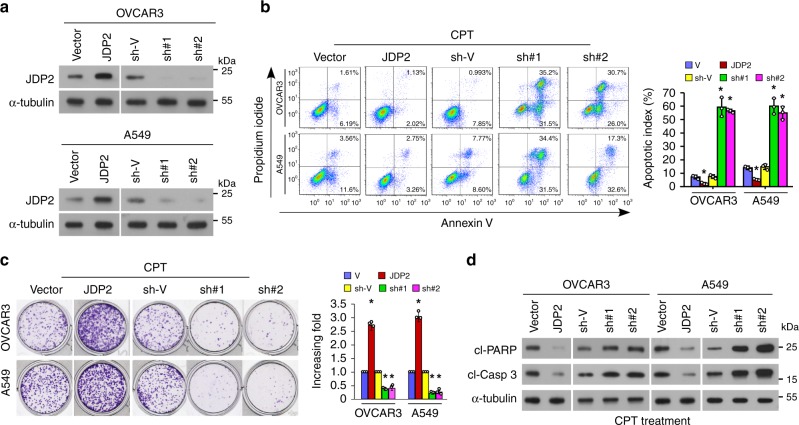
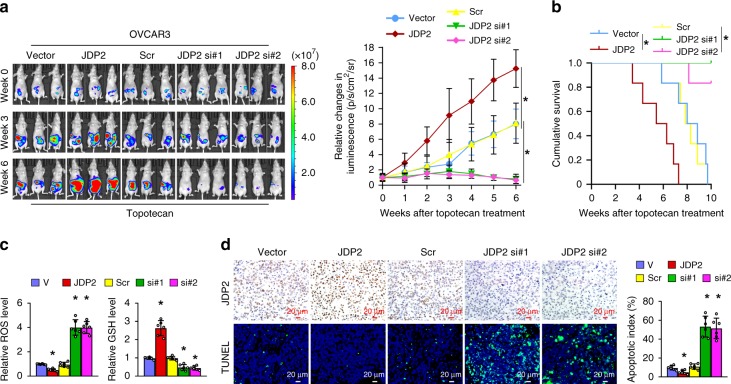
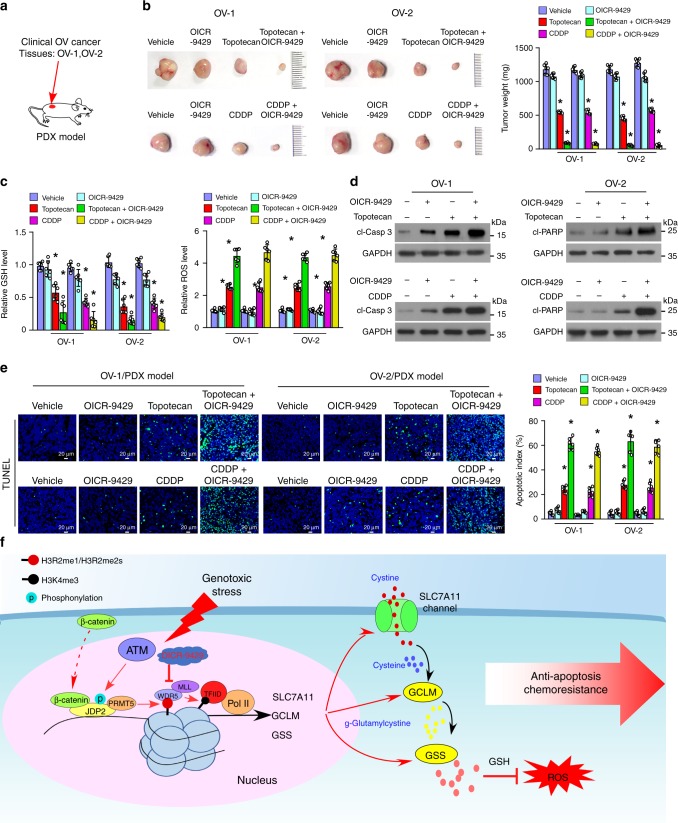
The mechanisms underlying how cells subjected to genotoxic stress reestablish reduction-oxidation (redox) homeostasis to scavenge genotoxic stress-induced reactive oxygen species (ROS), which maintains the physiological function of cellular processes and cell survival, remain unclear. Herein, we report that, via a TCF-independent mechanism, genotoxic stress induces the enrichment of β-catenin in chromatin, where it forms a complex with ATM phosphorylated-JDP2 and PRMT5. This elicits histone H3R2me1/H3R2me2s-induced transcriptional activation by the recruitment of the WDR5/MLL methyltransferase complexes and concomitant H3K4 methylation at the promoters of multiple genes in GSH-metabolic cascade. Treatment with OICR-9429, a small-molecule antagonist of the WDR5-MLL interaction, inhibits the β-catenin/JDP2/PRMT5 complex-reestablished GSH metabolism, leading to a lethal increase in the already-elevated levels of ROS in the genotoxic-agent treated cancer cells. Therefore, our results unveil a plausible role for β-catenin in reestablishing redox homeostasis upon genotoxic stress and shed light on the mechanisms of inducible chemotherapy resistance in cancer.


Conflict of interest statement

The authors declare no competing interests.

Figures

Fig. 1
Fig. 1
Genotoxic stress-induced β-catenin signaling is activated via a TCF- or FOXO-independent mechanism. a Representative images of the subcellular localization of β-catenin in the indicated cells treated with CPT (10 μM, 1 h), IR (10 Gy), and CDDP (10 μM, 1 h), as analyzed by immunofluorescence staining. Scale bar, upper and middle panel: 10 μm; lower panel: 5 μm. b IB analysis of expression of β-catenin expression in the chromatin fraction extracted from the indicated cells treated with CPT (10 μM, 1 h), IR (10 Gy), and CDDP (10 μM, 1 h). Histone 3 served as the loading control. c IB analysis of β-catenin expression in the chromatin fraction extracted from the indicated cells treated with CPT (10 μM) for 0, 15, 30, 60, and 120 min. Histone 3 served as the loading control. d Relative TOP flash or FOP flash luciferase reporter activity was analyzed in the indicated cells treated with CPT (10 μM, 1 h), IR (10 Gy), and CDDP (10 μM, 1 h). Each error bar represents the mean ± SD of three independent experiments. *P < 0.05. Student’s two-tailed t test. Source data of Fig. 1d are provided as a Source Data file
Fig. 2
Fig. 2
β-catenin contributes to genotoxic stress-activated glutathione metabolic processes. a, b GO enrichment analysis of β-catenin-regulated transcripts identified using RNA-seq (a, PRJNA543096) or ChIP-seq (b, PRJNA543097) profiling in CPT (10 μM, 1 h)-treated 293FT cells. The x-axis shows the enrichment scores as calculated by the –log10 (p-value). b (left): occupation and average ChIP-seq peak calling around the β-catenin peaks’ center. c Analysis of RNA-seq (PRJNA543096) and ChIP-seq (PRJNA543097) profiles indicated that β-catenin targeted the promoters and transcriptional upregulated the expression of SLC7A11, GCLM, and GSS in CPT (10 μM, 1 h)-treated cells. d Relative expression of SLC7A11, GCLM, and GSS in CPT (10 μM, 1 h)-treated cells as quantified by qRT-PCR analysis. + : treatment, −: untreatment. e Relative expression of GSH (left) and ROS (right) were examined in scramble or β-catenin siRNA(s) transfected-cells treated with CPT (10 μM) at the indicated time. f The percentage of 8OHdG-positive cells in CPT (10 μM, 4 h)-treated 293FT and OVCAR3 cells analyzed using an 8OHdG staining assay. + : treatment, −: untreatment. Each error bar in panels d and f represents the mean ± SD of three independent experiments. *P < 0.05. Student’s two-tailed t test. Source data of Fig. 2d–f are provided as a Source Data file
Fig. 3
Fig. 3
JDP2 is essential for β-catenin-induced GSH metabolism upon genotoxic stress. ac IP assays were performed in the chromatin fraction extracted from CPT (10 μM, 1 h)-treated β-catenin-transduced 293FT cells using anti-β-catenin antibody or anti-IgG antibody, followed by mass spectrometry analysis. b Relative expression of SLC7A11 in the indicated siRNA-transfected cells treated with CPT (10 μM, 1 h) as quantified by qRT-PCR analysis. c ChIP assay analysis of the enrichment of β-catenin on the SLC7A11 promoter in the indicated siRNA-transfected cells treated with CPT (10 μM, 1 h). d IB analysis of the expression of the indicated protein in CPT (10 μM, 4 h)-treated cells transfected with vector, JDP2, scramble, or JDP2-siRNA(s). β-actin served as the loading control. e Relative expression of GSH (left) and ROS (right) were examined in CPT (10 μM)-treated cells at the indicated times. f IP assays revealing that β-catenin formed a complex with JDP2 and PRMT5 in CPT (10 μM, 1 h)-treated cells. g IP assays were performed in CPT (10 μM)-treated cells and showed that silencing of JDP2 expression reduced the interaction between β-catenin and PRMT5 (left), whereas downregulating β-catenin had no impact on the JDP2/PRMT5 interaction (middle) and downregulating PRMT5 had no impact on the JDP2/β-catenin interaction (right). h Far-western blotting analysis was performed using anti-β-catenin antibody-immunoprecipitated proteins and detected using anti-His antibody and then reblotted with anti-β-catenin antibody. Recombinant JDP2 served as the control. i The interaction of β-catenin and JDP2 was examined in the control and CPT (10 μM, 1 h)-treated cells using STORM captured in a wide shot (left; scale bar, 5 μm), further zoomed-in (middle; scale bar, 1 μm), and 3D-rendered (right). j Schematic illustration of the wild-type and truncated β-catenin protein (left) and co-IP assays were performed using anti-JDP2 antibody in the CPT (10 μM, 1 h)-treated cells transfected with truncated β-catenin fragments (right). Each error bar in panels b, c, and e represents the mean ± SD of three independent experiments. *P < 0.05. Student’s two-tailed t test. Source data of Fig. 3b, c and 3e are provided as a Source Data file
Fig. 4
Fig. 4
β-catenin promotes the DNA-binding activity of JDP2 via inhibition of the JDP2/histone interaction. a Relative expression of GSH (left) and ROS (right) were examined in the indicated cells treated with CPT (10 μM, 4 h). + : treatment, −: untreatment. b ChIP assay analysis of the enrichment of JDP2 on the promoters of SLC7A11, GCLM, and GSS in the indicated cells treated with or without CPT (10 μM, 1 h). c Schematic illustration of the wild-type and truncated JDP2 (left); co-IP assays were performed using anti-β-catenin antibody in the CPT (10 μM, 1 h)-treated cells transfected with truncated JDP2 fragments (right). d IP assays were performed using anti-JDP2 antibody in the indicated cells treated with or without CPT (10 μM, 1 h) and IB analysis of expression of JDP2, Histone 3, and Histone 4. e IP assays were performed using anti-JDP2 antibody in CPT (10 μM, 1 h)-treated cells transfected with 0, 0.5, 1.0, and 5.0 μg of a Flag-tagged β-catenin plasmid and IB analysis of expression of JDP2, Flag-tagged β-catenin, Histone 3, and Histone 4. f In vitro binding assays were performed using anti-His antibody in the reactions mixed with recombinant His-tagged JDP2, recombinant Histone 3 (left), or Histone 4 (right), and Flag antibody-immunoprecipitated lysates from CPT (10 μM, 1 h)-treated cells transfected with 0, 1.0, and 5.0 μg of a Flag-tagged β-catenin plasmid. g JDP2 DNA-binding activity analyzed using an EMSA assay were examined in the indicated cells treated with or without CPT (10 μM, 1 h) (upper), or in CPT (10 μM, 1 h)-treated cells transfected with 0, 1.0, and 5.0 μg of a Flag-tagged β-catenin plasmid (middle), or in CPT (10 μM, 1 h)-treated cells transfected with or without β-catenin siRNA (lower). OCT-1 served as the loading control. Each error bar in panels a and b represents the mean ± SD of three independent experiments. *P < 0.05. Student’s two-tailed t test. Source data of Fig. 4a and b are provided as a Source Data file
Fig. 5
Fig. 5
PRMT5 promotes β-catenin/JDP2-activated glutathione metabolism. a, b The ChIP assay and qRT-PCR analysis of the enrichment of JDP2 on the promoters (a) and mRNA expression (b) of SLC7A11, GCLM, and GSS in CPT (10 μM, 1 h)-treated cells. c IB analysis of protein expression of SLC7A11, GCLM, and GSS in the CPT (10 μM, 4 h)-treated cells transfected with scramble or PRMT5 siRNA(s). d Relative expression levels of GSH (left) and ROS (right) in the indicated cells. e Relative expression of GSH (left) and ROS (right) were examined in the indicated cells. f Co-IP assays using anti-PRMT5 antibody were performed in the CPT (10 μM, 1 h)-treated cells transfected with truncated JDP2 fragments (right). g IP assays using anti-JDP2 antibody were performed in the indicated cells treated with or without CPT (10 μM, 1 h), and IB analysis of the expression of JDP2, AFT3, c-Jun, and HDAC3. h IP assays using anti-PRMT5 antibody were performed in the indicated cells treated with or without CPT (10 μM, 1 h), and IB analysis of expression of JDP2 and PRMT5 was performed. i IP assays using anti-PRMT5 antibody were performed in indicated cells treated with CPT (10 μM, 1 h) with or without the ATM inhibitor KU55933 (10 μM, 1 h) pretreatment, and IB analysis of the expression of JDP2 and PRMT5. j IP/IB assays analysis of HA-tagged JDP2 and phosphorylation of TQ/SQ in the indicated cells. k IP assays using anti-PRMT5 antibody were performed in the indicated cells treated with or without CPT (10 μM, 1 h), and IB analysis of JDP2 and PRMT5. l IP assays using anti-JDP2 antibody were performed in the indicated cells treated with or without CPT (10 μM, 1 h), and IB analysis of JDP2 and ATM. m co-IP assays were performed using anti-ATM antibody in the CPT (10 μM, 1 h)-treated cells transfected with truncated JDP2 fragments. Each error bar in panels a, b, d, and e represents the mean ± SD of three independent experiments. *P < 0.05. Student’s two-tailed t test. Source data of Fig. 5a, b, d–e are provided as a Source Data file
Fig. 6
Fig. 6
PRMT5-mediated histone H3R2 methylation contributes to genotoxic stress-induced GSH metabolism. a ChIP assay analysis of the enrichment of H3R2me1, H3R2me2s, H3R8me2s, H4R3me2s, and H2AR3me12s on the promoter of SLC7A11 in the indicated cells treated with CPT (10 μM, 1 h). The heatmap represented by pseudocolors was generated using the ChIP-qPCR values, arrayed from green (no enrichment) to red (maximal enrichment), to demonstrate the histone methylarginine code surrounding the promoter of SLC7A11. b, c ChIP assay analysis of the enrichment of H3R2me1 and H3R2me2s on the promoter of SLC7A11 in the indicated cells treated with CPT (10 μM, 1 h) (b) or PRMT5 inhibitor GSK591 (5 μM, 1 h) (c). ChIP-qPCR of Histone 3 served as the control. d, e ChIP assays analyses of enrichment of MLL1, MLL2, MLL3, MLL4, MLL5, and WDR5 (d) or WDR5, H3K4me3, transcriptional factor IID (TFIID), and polymerase II (e) on the promoter of SLC7A11 in CPT (10 μM, 1 h)-treated cells. Anti-IgG antibody served as the control. f Relative mRNA expression of SLC7A11, GCLM, and GSS in the scramble- or WDR5 siRNA(s)-transfected cells treated with or without CPT (10 μM, 1 h), as quantified by qRT-PCR analysis. GAPDH serve as the loading control. g Relative expression levels of GSH (left), cysteine (middle), and ROS (right) were examined in scramble- or WDR5 siRNA(s)-transfected cells treated with or without CPT (10 μM, 4 h). h Relative levels of GSH (left) and ROS (right) in vehicle-, or OICR-9429 (a WDR5 inhibitor, 5 μM, 4 h)-, or CPT (10 μM, 4 h), or OICR-9429 (10 μM, 4 h) plus CPT (10 μM, 4 h)-treated cells at the indicated times. i Quantification of the apoptotic index in the indicated cells treated with vehicle-, or OICR-9429 (10 μM)-, or CPT (10 μM), or OICR-9429 (10 μM) plus CPT (10 μM), as analyzed by an Annexin-V assay. + : treatment, −: untreatment. Each error bar in panels ai represents the mean ± SD of three independent experiments. *P < 0.05. Student's two-tailed t test. Source data of Fig. 6b–i are provided as a Source Data file
Fig. 7
Fig. 7
JDP2 level correlates with poorer survival of patients with cancer. a, b Online Kaplan–Meier plotter analysis revealed that patients with ovarian, lung, gastric, or breast cancer exhibiting high JDP2 expression had significantly shorter progression-free survival and shorter overall survival than patients with low JDP2 expression (P < 0.05, log-rank test; n = the indicated biologically independent samples). c Representative images of JDP2 and SLC7A11 in chemo-sensitive and chemo-resistant ovarian cancer tissues (n = 146). Scale bar, 20 μm. d Positive correlation of JDP2 levels with CDDP resistance (P < 0.001; r = 0.37), relapse (P = 0.002; r = 0.25), FIGO stage (P = 0.009; r = 0.21), and SLC7A11 expression (P = 0.008; r = 0.22) in ovarian cancer tissues (n = 146). Spearman rank correlation analysis. e Kaplan–Meier analysis of 5-year overall survival (upper) and 5-year disease-free survival (lower) for patients with ovarian cancer stratified by low versus high expression of JDP2 (log-rank test; P < 0.05, P < 0.05, respectively; n = 146). Quantification of IHC using the staining index (see Supplementary Materials and Methods). Samples with an SI ≥ 8 were determined as high expression, and samples with an SI < 8 were determined as low expression (n = the indicated biologically independent samples). f Positive correlation between JDP2 expression and GSH levels (P = 0.007; r = 0.482) in 30 freshly collected ovarian cancer tissues. two-tailed Spearman test. g Gene set enrichment analysis (GSEA) plot showing that JDP2 expression correlated positively with cisplatin-resistance-activated gene signatures (TSUNODA_CISPLATIN_RESISTANCE_UP) in published gene expression profiles of patients with ovarian cancer (NCBI/GEO/GSE66957, n = 69) and in gene expression profiles of patients with breast cancer (TCGA, n = 1092)
Fig. 8
Fig. 8
JDP2 confers resistance to genotoxic stress on cancer cells in vitro. a IB analysis of JDP2 expression in the indicated cells transduced with vector, JDP2, the shRNA-vector, or JDP2 shRNA(s); α-tubulin served as the loading control. b FACS analysis of annexin-V staining (left) and quantification (right) of indicated cells treated with Vehicle or CPT (10 μM) after 12 h. c Representative images (left) and quantification (right) of the colony number of the indicated cells treated with CPT (10 μM), as determined by a colony-formation assay. d IB analyses of expression of cleaved-PARP1 and cleaved-caspase 3 in the CPT (10 μM, 12 h)-treated cells. α-tubulin served as the loading control. Each error bar in panels b and c represents the mean ± SD of three independent experiments. *P < 0.05. Student’s two-tailed t test. Source data of Fig. 8b, c are provided as a Source Data file
Fig. 9
Fig. 9
JDP2 confers resistance to genotoxic stress on cancer cells in vivo. a Representative images of tumor-bearing nude mice inoculated intraperitoneally with the indicated cells in response to Topotecan chemotherapy at the indicated times (left), and the relative change in the bioluminescence signal of intraperitoneal tumors in nude mice in response to Topotecan chemotherapy (right). n = 6 animals per group. b Kaplan–Meier survival of mice inoculated intraperitoneally with the indicated cells. n = 6 animals per group. c Relative levels of GSH (left) and ROS (right) in the indicated xenograft tumors. d IHC staining of JDP2 expression and TUNNEL analysis (left) and quantification (left) of the apoptotic index in the indicated xenograft tumors. Scale bar, 20 μm. Each error bar in panels c and d represents the mean ± SD of three independent experiments. *P < 0.05. Student’s two-tailed t test. Source data of Fig. 9a–d are provided as a Source Data file
Fig. 10
Fig. 10
WDR5 inhibitor OICR-9429 enhances the sensitivity of ovarian cancer to genotoxic chemotherapeutics in vivo. a A PDX model was established by inoculating with two freshly collected clinical primary ovarian cancer tissues, OV-1 and OV-2. b Representative pictures (left) and weight (right) of xenograft tumors in response to the indicated chemotherapy. Left, upper: chemotherapy with Vehicle, OICR-9429 (3 mg/kg), Topotecan (10 mg/kg), or OICR-9429 (3 mg/kg) combined with Topotecan (10 mg/kg). Left, lower: chemotherapy with Vehicle, or OICR-9429 (3 mg/kg), CDDP (5 mg/kg), or OICR-9429 (3 mg/kg) combined with CDDP (5 mg/kg). n = 6 animals per group. c Relative levels of GSH (left) and ROS (right) in the indicated chemotherapy-treated xenograft tumors. n = 6 animals per group. d IB analysis of the level of cleaved-caspase 3 and cleaved-PARP1 in the indicated chemotherapy-treated xenograft tumors. GAPDH served as the loading control. e Representative images (left) and quantification (right) the apoptotic rate the indicated chemotherapy-treated xenograft tumors (left). Scale bar, 20 μm. n = 6 animals per group. h Hypothetical model illustrating that the genotoxic stress-triggered β-catenin/JDP2/PRMT5 complex plays a vital role in reestablishing glutathione homeostasis and eliminating chemoradiotherapy-induced ROS reduction, resulting in anti-apoptosis and chemoradioresistance, consequently leading to poor clinical prognosis of cancer. Each error bar in panels b, c, and e represents the mean ± SD of three independent experiments. *P < 0.05. Student’s two-tailed t test. Source data of Fig. 10b, c, and e are provided as a Source Data file

References

    1. Ray PD, Huang BW, Tsuji Y. Reactive oxygen species (ROS) homeostasis and redox regulation in cellular signaling. Cell. Signal. 2012;24:981–990. doi: 10.1016/j.cellsig.2012.01.008. - DOI - PMC - PubMed
    1. Locato V, Cimini S, De Gara L. ROS and redox balance as multifaceted players of cross-tolerance: epigenetic and retrograde control of gene expression. J. Exp. Bot. 2018;69:3373–3391. doi: 10.1093/jxb/ery168. - DOI - PubMed
    1. Shadel GS, Horvath TL. Mitochondrial ROS signaling in organismal homeostasis. Cell. 2015;163:560–569. doi: 10.1016/j.cell.2015.10.001. - DOI - PMC - PubMed
    1. Waris G, Ahsan H. Reactive oxygen species: role in the development of cancer and various chronic conditions. J. Carcinog. 2006;5:14. doi: 10.1186/1477-3163-5-14. - DOI - PMC - PubMed
    1. Yu BP. Cellular defenses against damage from reactive oxygen species. Physiol. Rev. 1994;74:139–162. doi: 10.1152/physrev.1994.74.1.139. - DOI - PubMed

Publication types

MeSH terms