. 2019 Aug 21;10(1):3763.
doi: 10.1038/s41467-019-11738-0.

Metabolic landscape of the tumor microenvironment at single cell resolution

Affiliations

Metabolic landscape of the tumor microenvironment at single cell resolution

Zhengtao Xiao et al. Nat Commun. .

Abstract

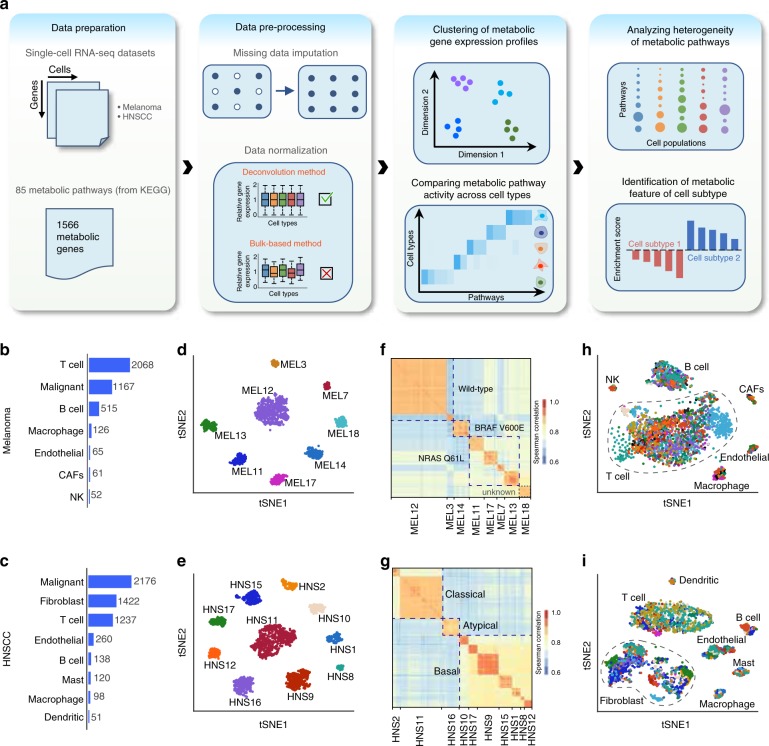
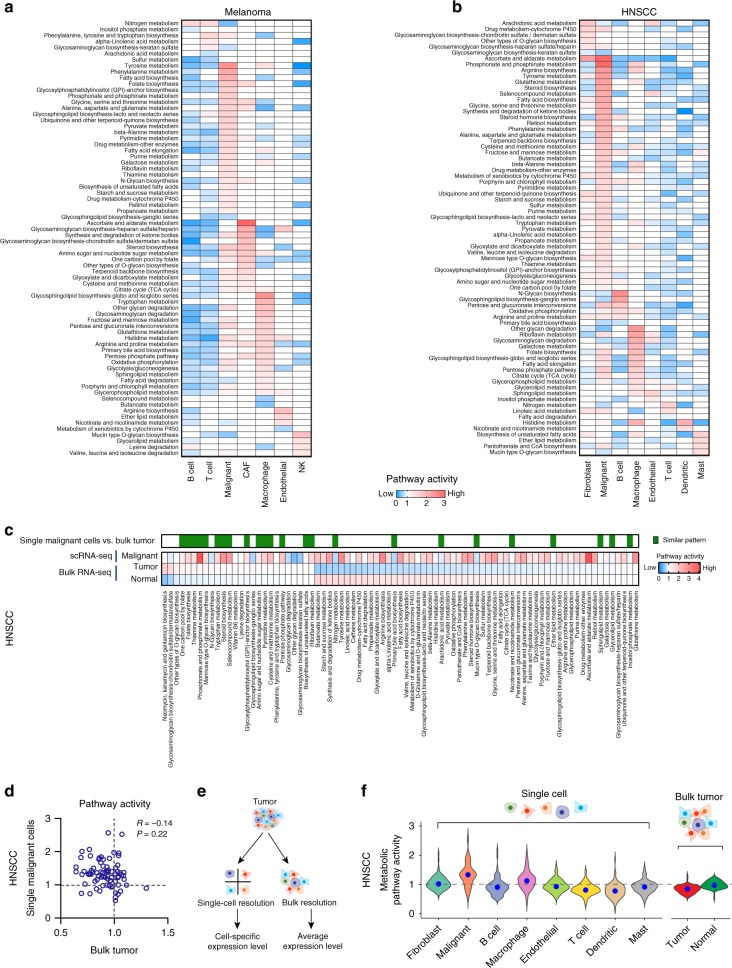
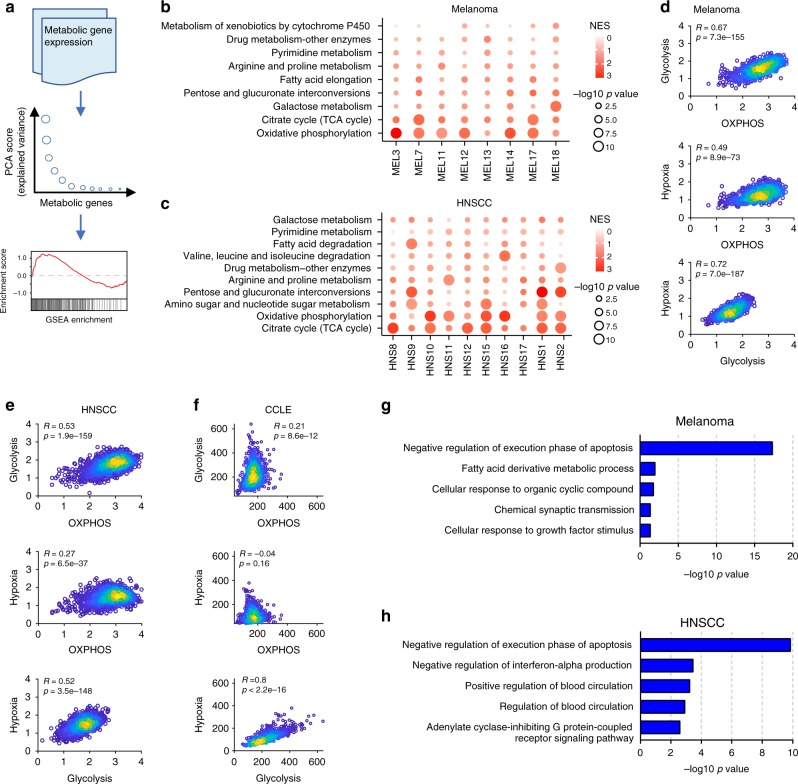
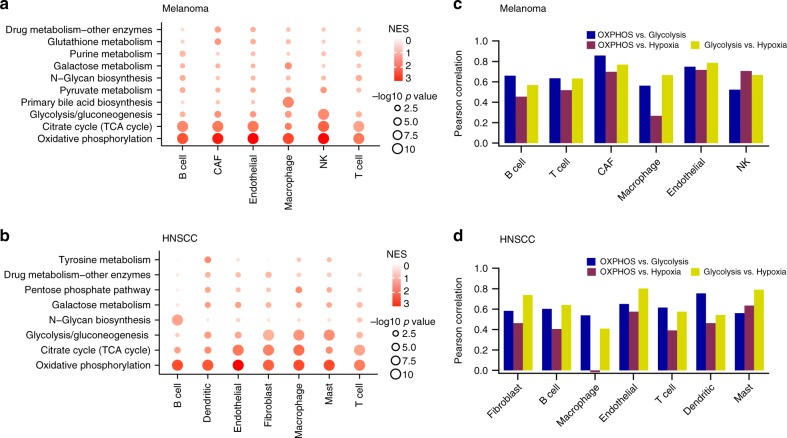
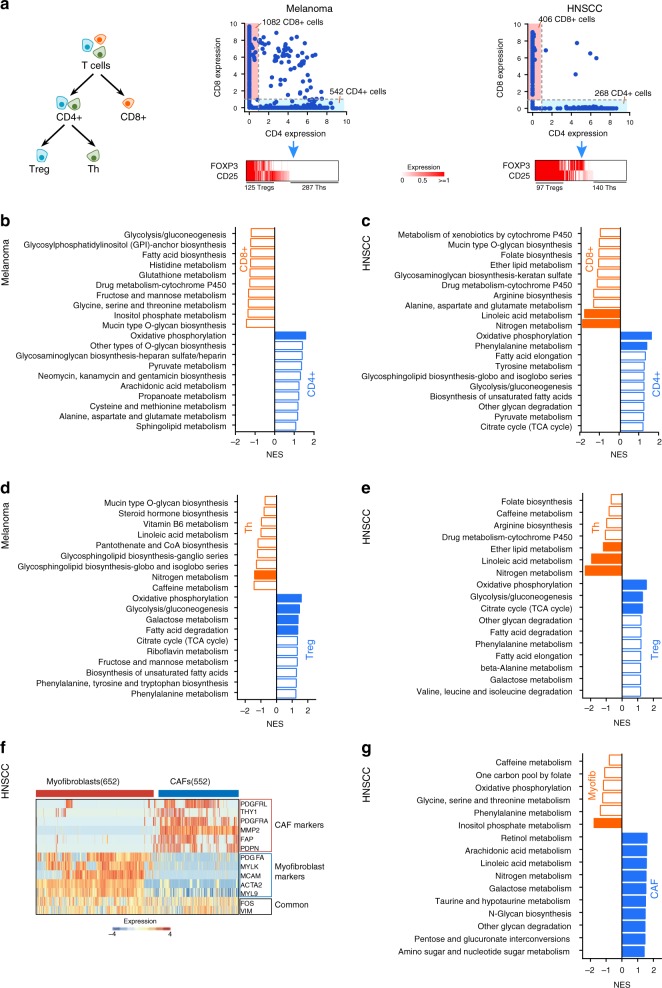
The tumor milieu consists of numerous cell types each existing in a different environment. However, a characterization of metabolic heterogeneity at single-cell resolution is not established. Here, we develop a computational pipeline to study metabolic programs in single cells. In two representative human cancers, melanoma and head and neck, we apply this algorithm to define the intratumor metabolic landscape. We report an overall discordance between analyses of single cells and those of bulk tumors with higher metabolic activity in malignant cells than previously appreciated. Variation in mitochondrial programs is found to be the major contributor to metabolic heterogeneity. Surprisingly, the expression of both glycolytic and mitochondrial programs strongly correlates with hypoxia in all cell types. Immune and stromal cells could also be distinguished by their metabolic features. Taken together this analysis establishes a computational framework for characterizing metabolism using single cell expression data and defines principles of the tumor microenvironment.


Conflict of interest statement

The authors declare no competing interests.

Figures

Fig. 1
Fig. 1
Landscape of metabolic gene expression at single-cell level. a Schematic representation of the scRNA-seq data analysis pipeline. b Numbers of each type of cells in the melanoma dataset. c Numbers of each type of cells in the head and neck squamous cell carcinoma (HNSCC) dataset. d t-SNE plot of metabolic gene expression profiles of malignant cells from the melanoma dataset. The color of each dot indicates the tumor which the cell comes from. e Same as in d but for the HNSCC dataset. f Clustered correlation matrix showing Spearman’s rank correlation coefficients of metabolic gene expression profiles between malignant cells in the melanoma dataset. g Same as in f but for the HNSCC dataset. h t-SNE plot of metabolic gene expression profiles of non-malignant cells from the melanoma dataset. The color of each dot indicates the tumor which the cell comes from. i Same as in h but for the HNSCC dataset
Fig. 2
Fig. 2
Cell type-specific metabolic reprogramming. a Metabolic pathway activities in cell types in the melanoma dataset. Statistically non-significant values (random permutation test p > 0.05) are shown as blank. b Metabolic pathway activities in cell types in the HNSCC dataset. Statistically non-significant values (random permutation test p > 0.05) are shown as blank. c Metabolic pathway activities in HNSCC tumor samples and matched adjacent normal samples from TCGA computed based on bulk RNA-seq data. The color bar on the top marks the pathways with similar activity changes in single malignant cells compared to single non-malignant cells and bulk tumors compared to normal tissue samples. d Scatter plot comparing pathway activities between bulk HNSCC tumors in TCGA and single malignant cells in the HNSCC scRNA-seq dataset. e Difference between bulk and single-cell RNA-seq in characterizing gene expression profiles in tumors. f Distributions of pathway activities in different cell types from the HNSCC scRNA-seq dataset (left) and in bulk tumors and normal samples from TCGA (right)
Fig. 3
Fig. 3
Intratumoral metabolic heterogeneity of malignant cells. a Workflow for quantitating metabolic heterogeneity of malignant cells. b Metabolic pathways enriched in genes with highest contribution to the metabolic heterogeneities among malignant cells from different tumors in the melanoma dataset. c Same as in b but for the HNSCC dataset. d Scatter plots comparing activities of glycolysis, OXPHOS and response to hypoxia in single malignant cells from the melanoma dataset. Colors of points indicate local density of points. e Same as in d but for the HNSCC dataset. f Same as in d but for cancer cell lines from CCLE. g GO terms enriched in genes up-regulated in cells with lowest expression levels of glycolysis, OXPHOS and hypoxia pathways in the melanoma dataset. h Same as in g but for the HNSCC dataset
Fig. 4
Fig. 4
Metabolic heterogeneity of non-malignant cells. a Metabolic pathways enriched in genes with highest contribution to the metabolic heterogeneities among different types of non-malignant cells from the melanoma dataset. b Pearson’s correlation coefficients between the activities of glycolysis, OXPHOS and response to hypoxia in non-malignant cells from the melanoma dataset. c Same as in a but for the HNSCC dataset. d Same as in b but for the HNSCC dataset
Fig. 5
Fig. 5
Metabolic features of non-malignant cell subtypes. a Left panel: classification of T cells into CD4+, CD8+, regulatory T cells (Tregs) and T helper cells (Ths). Middle and right: expression levels of the gene markers used for separating T cell subtypes in melanoma (middle) and HNSCC (right) datasets. b Top 10 metabolic pathways enriched in CD4+ or CD8+ T cells in the melanoma dataset. Significantly enriched pathways with GSEA p-value < 0.05 are highlighted in red (higher in CD8+) or blue (higher in CD4+). c Same as in b but for the HNSCC dataset. d Top 10 metabolic pathways enriched in Tregs or Ths in the melanoma dataset. Significantly enriched pathways with GSEA p-value < 0.05 are highlighted in red (higher in Th) or blue (higher in Treg). e Same as in d but for the HNSCC dataset. f Gene markers and their expression levels used for classifying fibroblast cells in the HNSCC dataset into CAFs and myofibroblasts. g Top 10 metabolic pathways enriched in CAFs or myofibroblasts in the HNSCC dataset. Significantly enriched pathways with GSEA p-value < 0.05 are highlighted in red (higher in myofibroblasts) or blue (higher in CAFs)

References

    1. DeBerardinis RJ, Chandel NS. Fundamentals of cancer metabolism. Sci. Adv. 2016;2:e1600200. doi: 10.1126/sciadv.1600200. - DOI - PMC - PubMed
    1. Boroughs LK, DeBerardinis RJ. Metabolic pathways promoting cancer cell survival and growth. Nat. Cell Biol. 2015;17:351–359. doi: 10.1038/ncb3124. - DOI - PMC - PubMed
    1. Pavlova NN, Thompson CB. The emerging hallmarks of cancer metabolism. Cell Metab. 2016;23:27–47. doi: 10.1016/j.cmet.2015.12.006. - DOI - PMC - PubMed
    1. Palm W, Thompson CB. Nutrient acquisition strategies of mammalian cells. Nature. 2017;546:234–242. doi: 10.1038/nature22379. - DOI - PMC - PubMed
    1. Vander Heiden MG, DeBerardinis RJ. Understanding the intersections between metabolism and cancer biology. Cell. 2017;168:657–669. doi: 10.1016/j.cell.2016.12.039. - DOI - PMC - PubMed

Publication types