. 2019 Aug 21;10(1):3756.
doi: 10.1038/s41467-019-11781-x.

Wilm's tumor 1 promotes memory flexibility

Affiliations

Wilm's tumor 1 promotes memory flexibility

Chiara Mariottini et al. Nat Commun. .

Abstract

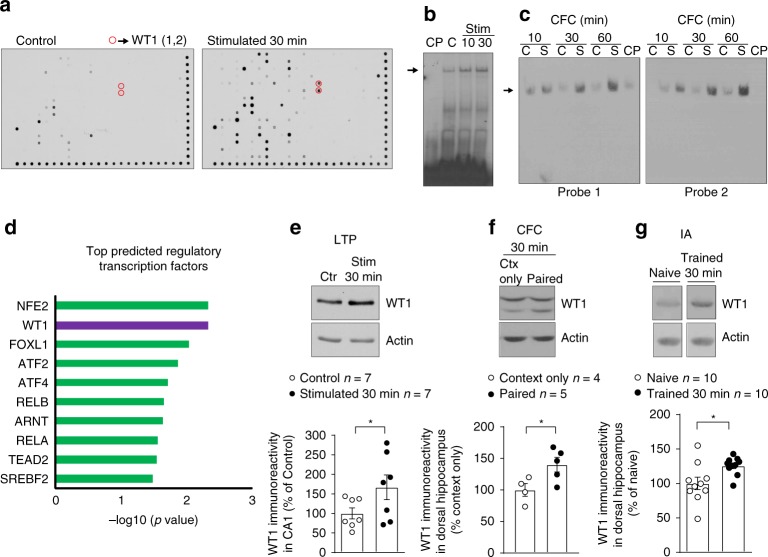
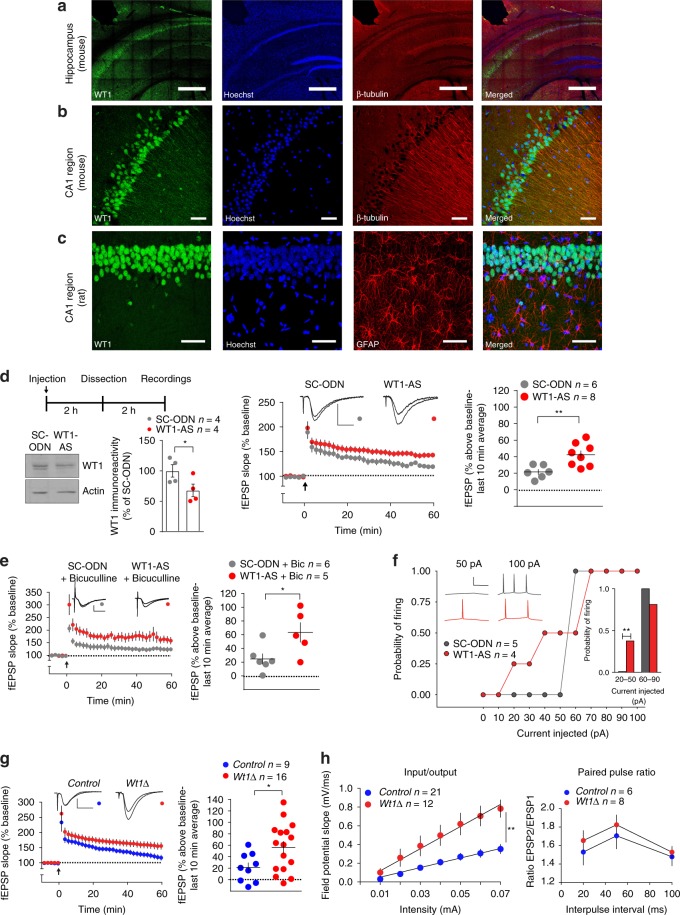
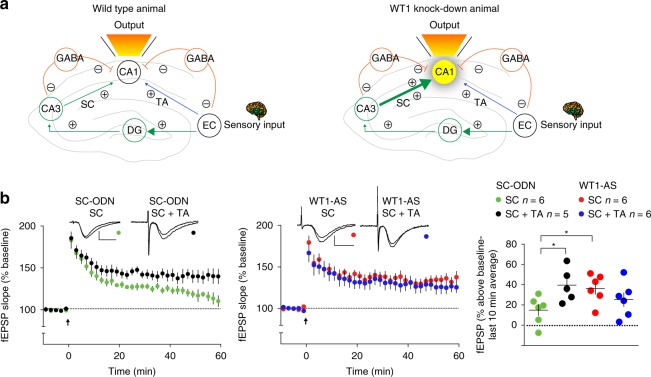
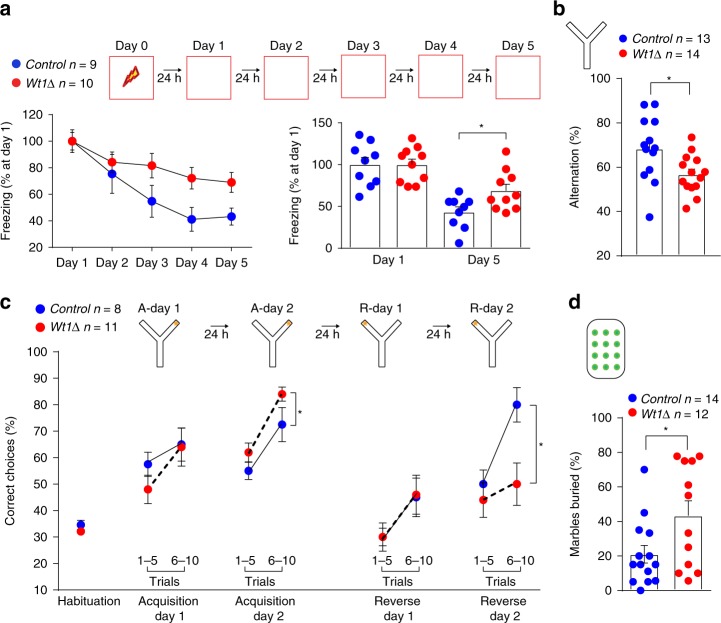
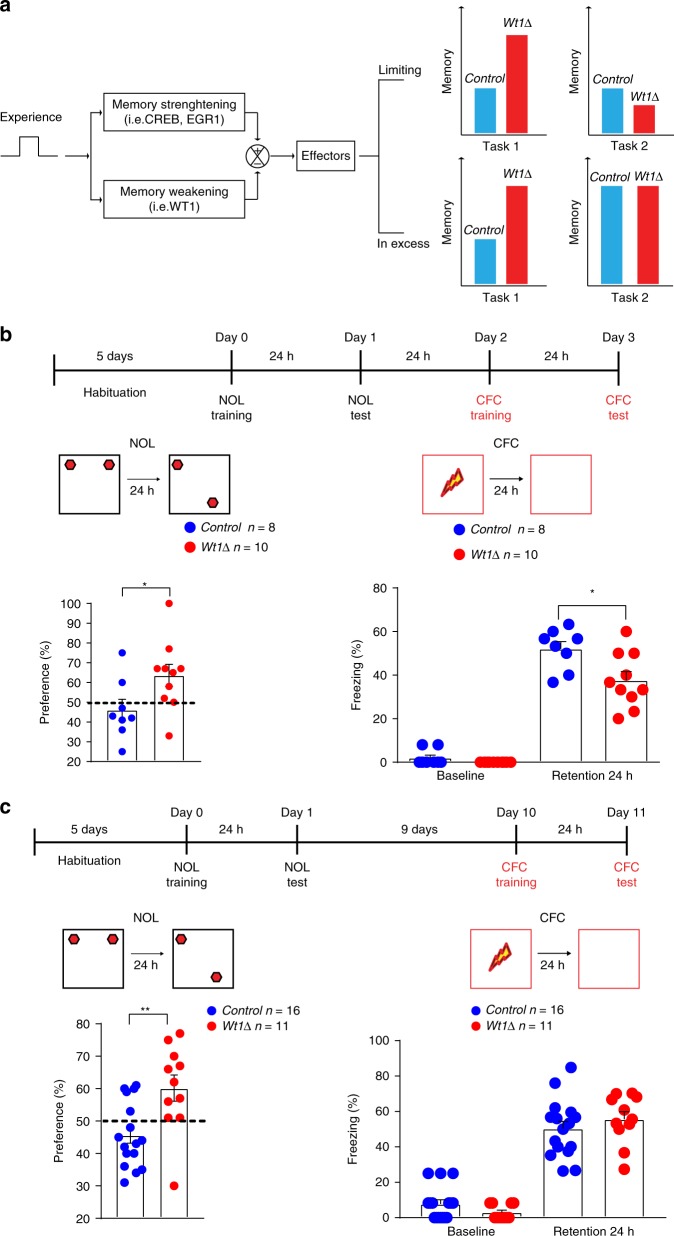
Under physiological conditions, strength and persistence of memory must be regulated in order to produce behavioral flexibility. In fact, impairments in memory flexibility are associated with pathologies such as post-traumatic stress disorder or autism; however, the underlying mechanisms that enable memory flexibility are still poorly understood. Here, we identify transcriptional repressor Wilm's Tumor 1 (WT1) as a critical synaptic plasticity regulator that decreases memory strength, promoting memory flexibility. WT1 is activated in the hippocampus following induction of long-term potentiation (LTP) or learning. WT1 knockdown enhances CA1 neuronal excitability, LTP and long-term memory whereas its overexpression weakens memory retention. Moreover, forebrain WT1-deficient mice show deficits in both reversal, sequential learning tasks and contextual fear extinction, exhibiting impaired memory flexibility. We conclude that WT1 limits memory strength or promotes memory weakening, thus enabling memory flexibility, a process that is critical for learning from new experiences.


Conflict of interest statement

The authors declare no competing interests.

Figures

Fig. 1
Fig. 1
WT1 expression and DNA-binding activity are induced by synaptic plasticity and learning. a Protein–DNA binding assay comparing rat hippocampal CA1 extracts from control tissue versus extracts obtained from tissue where LTP was induced. WT1 is circled in red; numbers in parentheses indicate two different DNA probes with WT1 consensus sites. b EMSA showing increased in vitro WT1 binding to a DNA consensus sequence (arrow indicates the WT1/DNA complex) 10 and 30 min after induction of LTP in hippocampal CA1 region (Stim) compared with unstimulated control (C). The specificity of DNA–protein binding was verified by incubation with excess unlabeled cold probe (CP). c EMSA showing increased WT1 binding to DNA (arrow indicates the WT1/DNA complex) at different time points after CFC (S, shocked group; C, context only controls). The specificity of DNA-protein binding was verified by incubation with excess unlabeled cold probe (CP). d Bar graph of the top ten transcription factors predicted to regulate gene expression profiles in rat tissue obtained 90 min after a stimulation that produced LTP. e Expression of WT1 was significantly increased in rat CA1 region 30 min after LTP induction (paired t test: *p = 0.0495). f WT1 expression in the dorsal hippocampus of rats trained in CFC (Paired) compared with non shocked rats (Ctx only) (unpaired t test: *p = 0.0385). g Expression of WT1 was significantly increased in the dorsal hippocampus of rats trained in an IA task. Protein expression was measured 30 min after training and compared with naïve rats (unpaired t test: *p = 0.0187). Data are expressed as mean ± s.e.m
Fig. 2
Fig. 2
WT1 represses long-term memory consolidation. a Left: Change in WT1 expression after double injection (2 nmoles/each, 2 h apart) of WT1-AS into CA1 (paired t test: *p = 0.0362; t = 2.687, df = 6). Right: Scheme of behavioral experiments in WT1 knockdown rats. WT1-AS-injected rats increased freezing time 24 h after training in CFC (unpaired t test **p = 0.0086). WT1 acute knockdown did not affect memory retention in NOL 1 h after training (unpaired t test p = 0.1685, n = 8–12 rats). In contrast, 24 h after training, WT1-AS-injected rats showed better memory than SC-ODN injected ones (unpaired t test: **p = 0.0011. Dashed line indicates 50% preference). b Left: Wt1∆ mice showed enhanced freezing 24 h and 30 days after training in CFC (unpaired t test: for 24 h, **p = 0.0088; for 30 days, *p = 0.0104). Right: Both Control and Wt1∆ groups showed preference for the new location when tested 1 h after training in NOL while only Wt1∆ mice showed significant preference for the new location 24 h after training (unpaired t test: **p = 0.0033; n = 8–10 rats. Dashed line indicates 50% preference). c Top: Immunostaining and immunoblot showing WT1 overexpression in rats. Bottom: Scheme of the behavioral experiments: green highlight line indicates time window for AAV-induced full expression of WT1. WT1 Overexpression reduced levels of freezing both during acquisition (unpaired t test **p = 0.0061) and 7 days after training (unpaired t test ***p = 0.0004) compared with CTR-AAV controls. d Top: Immunostaining and immunoblot showing WT1 overexpression via HSV virus in rats. Bottom: Scheme of pre- and post-training behavioral experiments. Green highlight line indicates time window for HSV-induced full expression of WT1. Pre-training: WT1-HSV group showed a significant difference in freezing compared with CTR-HSV group both during acquisition (unpaired t test **p = 0.0042) and 7 days after training (unpaired t test: **p = 0.0049). Post-training: rats were tested 4 days after HSV injection. WT1-HSV group showed significantly reduced levels of freezing compared with CTR-HSV group (unpaired t test: *p = 0.0444). Data are expressed as mean ± s.e.m
Fig. 3
Fig. 3
WT1 effect is mediated by enhanced activity and excitability of CA1 neurons. a In the mouse hippocampus WT1 localizes predominantly within the cell bodies layer. Scale bar = 500 μm. b Immunostaining of the mouse CA1 region shows WT1 expression mainly in cell bodies but also in proximal dendrites. Scale bar = 50 μm. c In the rat CA1 region WT1 is expressed in pyramidal neurons and not in GFAP positive astrocytes. Scale bar = 50 μm. d Scheme for the electrophysiology experiments. Reduction in WT1 expression after a single intrahippocampal injection of WT1-AS (paired t test: *p = 0.0202). A weak stimulus (delivered at arrow) induced LTP in WT1-AS group (two-way ANOVA RM: F(1,12) = 10.58, **p = 0.0069). Calibrations: 0.5 mV/10 ms. e, Bicuculline (10 μM) did not block WT1-AS-mediated LTP enhancement (two-way ANOVA RM: F(1,9) = 6.039, *p = 0.0363). Calibrations: 0.5 mV/10 ms. f Whole-cell patch recordings in rats CA1 pyramidal neurons. Right inset: probability of evoking at least one spike in response to a weak (20–50 pA) or a stronger (60–90 pA) current step in WT1-depleted or control groups (two-tailed Chi-square test, **p = 0.0041). Resting membrane potential and input resistance measured −63.75 ± 3.15 mV and 105.8 ± 21.76 MΩ in the WT1-AS group, and −60.80 ± 2.85 mV and 109.3 ± 20.04 MΩ in the SC-ODN group. Left inset: representative traces in cells from WT1-AS or SC-ODN. Calibration: 50 mV/100 ms. g Upon weak stimulus (delivered at arrow) LTP was induced in Wt1∆ mice but not in control group (two-way ANOVA RM: F(1,23) = 5.125, *p = 0.0333). Calibrations: 0.5 mV/10 ms. h Wt1∆ mice showed increased basal synaptic efficiency (left panel: input/output; linear regression unpaired t test, **p = 0.0077) but did not affect paired-pulse ratio (right panel; two-way ANOVA RM, p = 0.0878). Representative fEPSPs graphs show traces recorded during baseline and 60 min post-HFS. Dot blot graphs display final 10 min of fEPSP slope. Data are expressed as mean ± s.e.m
Fig. 4
Fig. 4
Circuit mechanism of WT1 action. a Scheme of WT1 depletion effect on corticohippocampal input to CA1. Left panel (wild type animal): normally, activation of both the direct temporoammonic pathway (blue) and the trisynaptic pathway (green) are required for LTP induction at the Schaffer collateral (SC) → CA1 synapse. Right panel (WT1 knock-down animal): in WT1-depleted hippocampus, enhanced basal efficiency of SC → CA1 signaling and/or CA1 excitability enable trisynaptic pathway activity alone to induce LTP. EC = entorhinal cortex; DG = dentate gyrus; TA = temporoammonic pathway. b Theta burst stimulation (TBS, delivered at arrow) of the SC induced stable LTP in slices from rats injected with SC-ODN only when combined with phase-delayed TBS at the TA pathway (left and right panels). Conversely, in slices from WT1-AS-injected hippocampi, the same TBS of SC alone induced LTP, which did not differ from that induced by dual-pathway TBS (center and right panels). Representative fEPSPs show superimposed traces recorded during baseline and 60 min post-TBS. Calibrations: 0.5 mV/10 ms. Data are expressed as mean fEPSP ± s.e.m. Statistical analysis by two-way ANOVA RM: SC stimulation comparing SC-ODN vs WT1-AS ODNs: F(1,10) = 6.931, *p = 0.0250; SC-ODN comparing SC stimulation vs SC + TA: F(1,9) = 7.112, *p = 0.0258. No significant effect was observed when comparing WT1-AS SC vs WT1-AS SC + TA: F(1,10) = 1.437, p = 0.2582
Fig. 5
Fig. 5
WT1 effects on hippocampal plasticity are mediated via IGF2. a Quantitative real time PCR showed that WT1 acute knockdown in rats significantly increases IGF2 mRNA expression (unpaired t test *p = 0.0260). b LTP induced by weak-HFS in Wt1∆ slices was abolished by bath application of IGF2 receptor antibody (IGF2-R Ab, 5μg/ml). Superimposed traces showing representative fEPSPs recorded during baseline and 60 min post-HFS. Calibrations: 0.5 mV/10 ms. Summary of the final 10 min of recording showed that LTP in hippocampal slices from Wt1∆ mice was significantly reduced by bath application of IGF2-R Ab (two-way ANOVA RM, *p = 0.0430, F(1, 13) = 5.03). For ease of comparison data for the Control and the Wt1∆ group in the bar graph are the same as in Fig. 3g. c WT1-AS-mediated LTP enhancement was blocked by bath application of IGF2 receptor antibody (IGF2-R Ab, 5 μg/ml). Representative fEPSPs show superimposed traces recorded during baseline and 60 min post-HFS. Calibrations: 0.5 mV/10 ms. Final 10 min of recording showed that LTP in WT1-AS injected slices was significantly reduced by IGF2-R Ab (two-way ANOVA RM, **p = 0.0017; F(1, 11) = 16.85). For ease of comparison data for the SC-ODN and the WT1-AS groups, in both the time course and bar graph, are the same that is shown in Fig. 3d. Data are expressed as mean ± s.e.m
Fig. 6
Fig. 6
WT1 controls memory flexibility. a Wt1∆ mice exhibited a lower rate of fear extinction than their control littermates measured at day 5 of extinction; % freezing at day 5 was normalized to freezing at day 1 (unpaired t test: *p = 0.0196). b Wt1∆ mice showed impaired spontaneous alternation (% alternation) in a Y maze test (unpaired t test: *p = 0.0178). c Wt1∆ mice compared to Control mice performed significant different during the acquisition and reversal phase of the reversal learning task in a Y maze. Data are expressed as % correct arm entry (baited arm). A-day 1 and A-day 2: acquisition sessions 1–2; R-day 1 and R-day 2: reversal sessions 1–2 (two-way ANOVA RM; *p = 0.0348; F(1,17) = 5.263 for acquisition phase; *p = 0.0120; F(1,17) = 7.916 for reversal phase). d, Wt1∆ mice exhibited an increase in repetitive behavior as indicated by the number of marbles buried in the marble burying test (unpaired t test: *p = 0.0297). Data are expressed as mean ± s.e.m
Fig. 7
Fig. 7
Consequences of WT1-mediated impaired memory flexibility. a Proposed mechanism of WT1’s effect on memory regulation. An initial experience such as Task 1 (NOL) activates both pro-memory strengthening and pro-memory weakening pathways. When the memory weakening pathways are inhibited by depletion of WT1, there is prolonged memory for Task 1. Retention of Task 1 memory may or may not interfere with the ability to remember a Task 2 (CFC) based on the availability of effectors (limiting vs in excess). b Schematic representation for short-interval sequential training in mice (top panel). Wt1∆ mice showed increased time spent exploring the new location when first trained in NOL and tested 24 h after training (left panel, unpaired t test: *p = 0.0422. Dashed line indicates 50% preference). In the next day after being tested in NOL mice were trained on CFC and Wt1∆ mice spent significantly less time freezing than Control littermates when tested 24 h after training (right panel, unpaired t test: *p = 0.0161). c Schematic representation for long-interval sequential training (top panel). Wt1∆ mice showed increased time spent exploring the new location when first trained in NOL and tested 24 h after training (left panel, unpaired t test: **p = 0.0036. Dashed line indicates 50% preference). Nine days after being tested in NOL, Wt1∆ mice were trained on CFC and compared with control group, they spent comparable amount of time freezing when tested 24 h after training (right panel, unpaired t test: p = 0.3816). Data are expressed as mean ± s.e.m

References

    1. McGaugh JL. Memory—a century of consolidation. Science. 2000;287:248–251. doi: 10.1126/science.287.5451.248. - DOI - PubMed
    1. Alberini CM, Kandel ER. The regulation of transcription in memory consolidation. Cold Spring Harb. Perspect. Biol. 2014;7:a021741. doi: 10.1101/cshperspect.a021741. - DOI - PMC - PubMed
    1. Davis RL, Zhong Y. The biology of forgetting—a perspective. Neuron. 2017;95:490–503. doi: 10.1016/j.neuron.2017.05.039. - DOI - PMC - PubMed
    1. Abel T, Kandel E. Positive and negative regulatory mechanisms that mediate long-term memory storage. Brain Res. Brain Res. Rev. 1998;26:360–378. doi: 10.1016/S0165-0173(97)00050-7. - DOI - PubMed
    1. Kandel ER. The molecular biology of memory: cAMP, PKA, CRE, CREB-1, CREB-2, and CPEB. Mol. Brain. 2012;5:14. doi: 10.1186/1756-6606-5-14. - DOI - PMC - PubMed

Publication types