

Simulation Analyses of tDCS Montages for the Investigation of Dorsal and Ventral Pathways
- PMID: 31434911
- PMCID: PMC6704077
- DOI: 10.1038/s41598-019-47654-y
Simulation Analyses of tDCS Montages for the Investigation of Dorsal and Ventral Pathways
Abstract
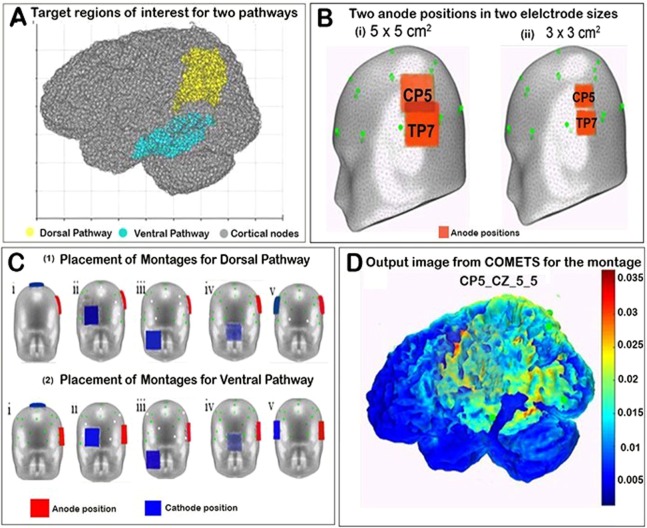
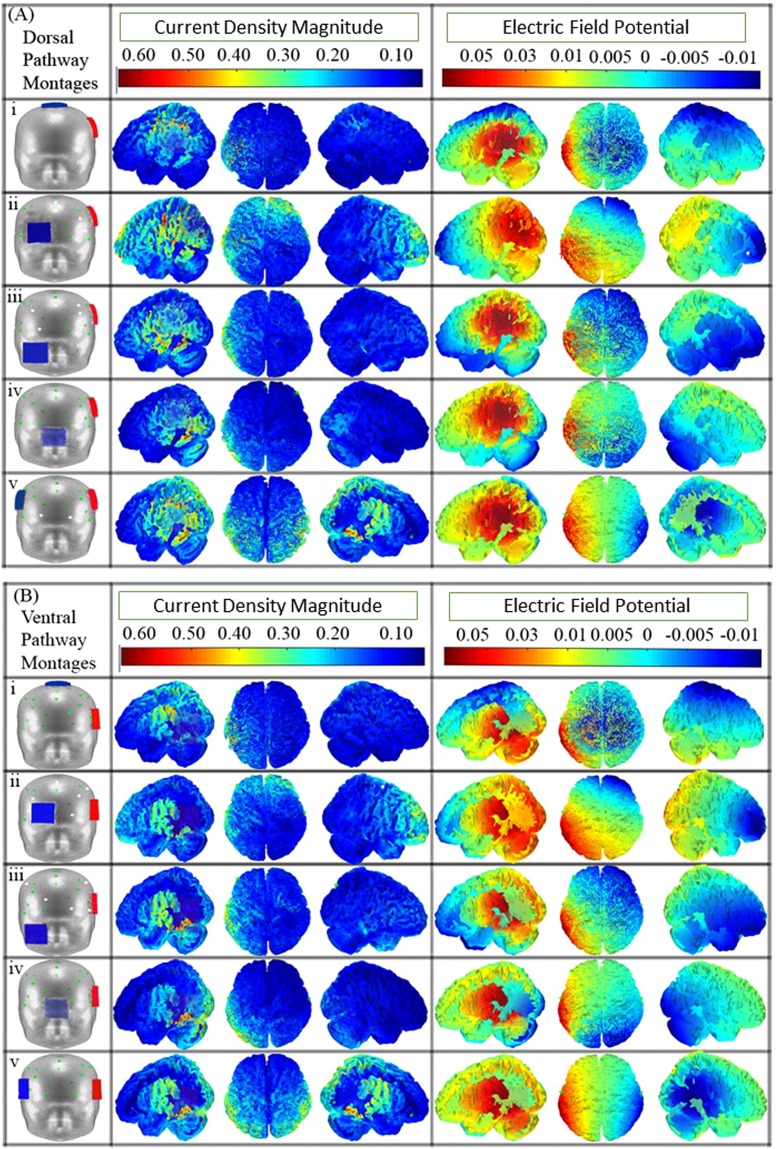
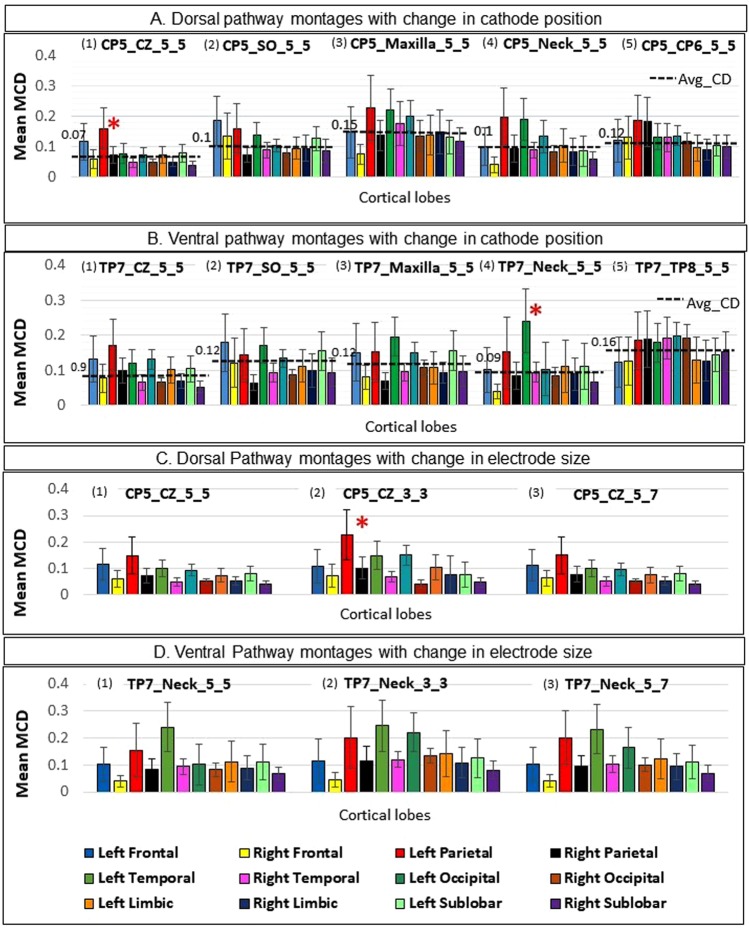
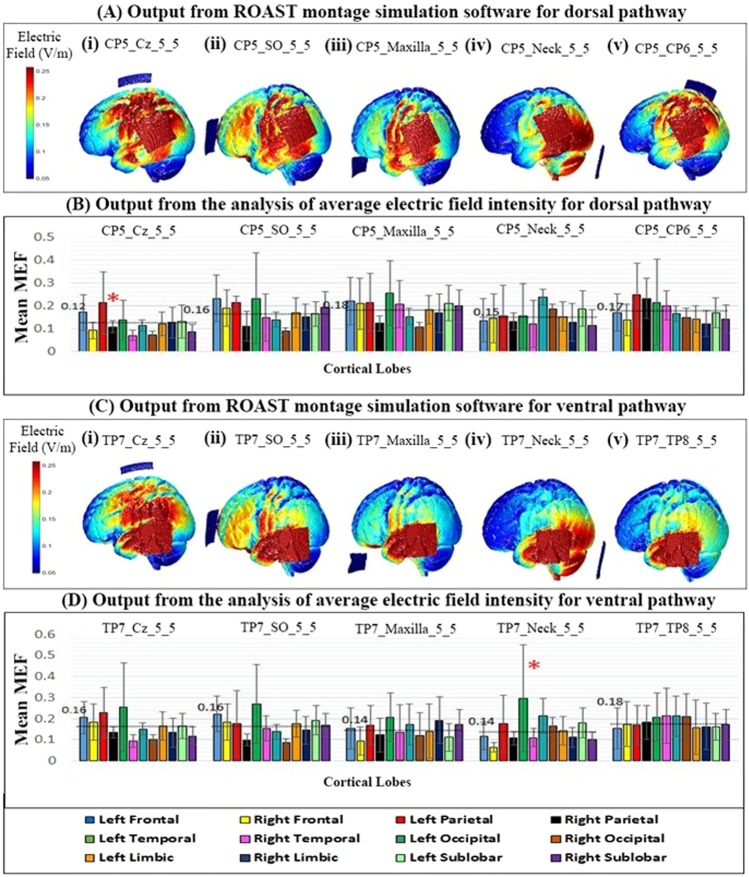
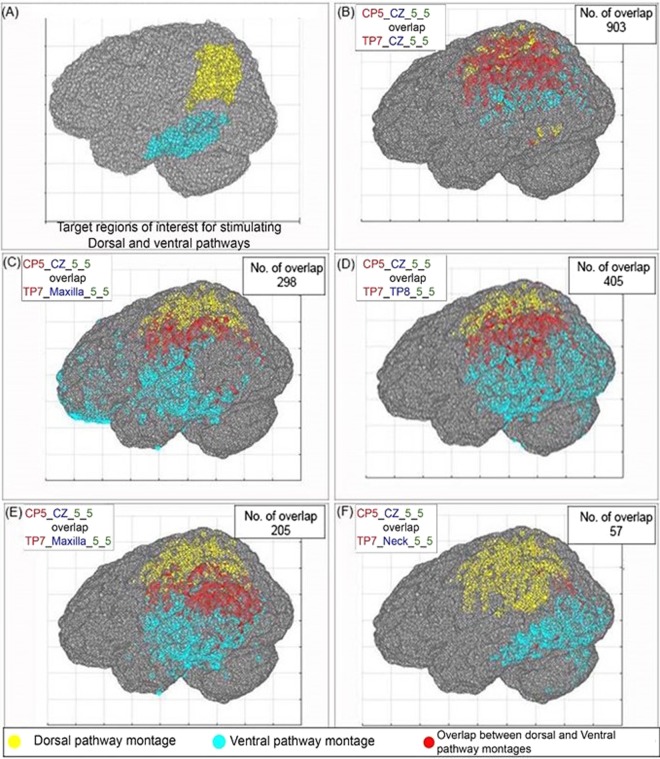
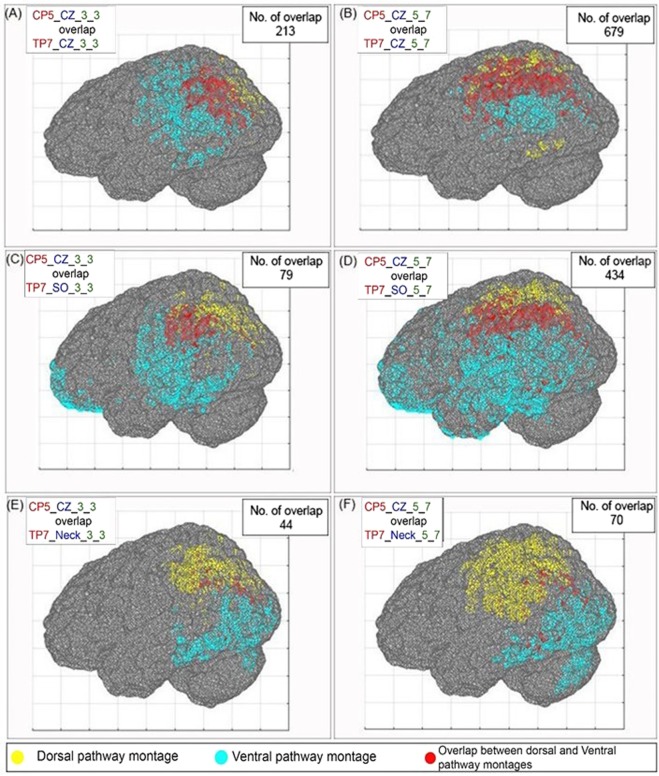
Modulating higher cognitive functions like reading with transcranial direct current stimulation (tDCS) can be challenging as reading involves regions in the dorsal and ventral cortical areas that lie in close proximity. If the two pathways are stimulated simultaneously, the function of dorsal pathway (predominantly used for graphophonological conversion) might interfere with the function of the ventral pathway (used for semantics), and vice-versa. To achieve functional specificity in tDCS for investigating the two pathways of reading, it is important to stimulate each pathway per session such that the spread of current across the cortical areas due to the two montages has minimal overlap. The present study intends to achieve this by introducing a systematic approach for tDCS analysis. We employed the COMETS2 software to simulate 10 montage configurations (5 for each pathway) for three electrode sizes: 5 × 5, 3 × 3, and 5 × 7 cm2. This diversity in montage configuration is chosen since previous studies found the position and the size of anode and cathode to play an important role. The values of the magnitude of current density (MCD) obtained from the configuration were used to calculate: (i) average MCD in each cortical lobe, (ii) number of overlapping coordinates, and (iii) cortical areas with high MCD. The measures (i) and (iii) ascertained the current spread by each montage within a cortical lobe, and (ii) verified the overlap of the spread of current between a pair of montages. The analyses show that a montage using the electrode size of 5 × 5 cm2 with the anode at CP5 and cathode at CZ, and another with anode at TP7 and cathode at nape of the neck are optimal choices for dorsal and ventral pathways, respectively. To verify, we cross-validated the results with ROAST. This systematic approach was helpful in reducing the ambiguity of montage selection prior to conducting a tDCS study.
Conflict of interest statement
The authors declare no competing interests.
Figures

Similar articles
-
Reading proficiency influences the effects of transcranial direct current stimulation: Evidence from selective modulation of dorsal and ventral pathways of reading in bilinguals.Brain Lang. 2020 Nov;210:104850. doi: 10.1016/j.bandl.2020.104850. Epub 2020 Sep 2. Brain Lang. 2020. PMID: 32890855 Free PMC article. Clinical Trial.
-
Use of Computational Modeling to Inform tDCS Electrode Montages for the Promotion of Language Recovery in Post-stroke Aphasia.Brain Stimul. 2015 Nov-Dec;8(6):1108-15. doi: 10.1016/j.brs.2015.06.018. Epub 2015 Jul 2. Brain Stimul. 2015. PMID: 26198364
-
Modelling the effect of electrode displacement on transcranial direct current stimulation (tDCS).J Neural Eng. 2018 Feb;15(1):016019. doi: 10.1088/1741-2552/aa8d8a. J Neural Eng. 2018. PMID: 28925375
-
Transcranial direct current stimulation in obsessive-compulsive disorder: an update in electric field modeling and investigations for optimal electrode montage.Expert Rev Neurother. 2019 Oct;19(10):1025-1035. doi: 10.1080/14737175.2019.1637257. Epub 2019 Jul 8. Expert Rev Neurother. 2019. PMID: 31244347 Review.
-
Effects and potential mechanisms of transcranial direct current stimulation (tDCS) on auditory hallucinations: A meta-analysis.Psychiatry Res. 2019 Mar;273:343-349. doi: 10.1016/j.psychres.2019.01.059. Epub 2019 Jan 15. Psychiatry Res. 2019. PMID: 30682555 Review.
Cited by
-
Sex difference in tDCS current mediated by changes in cortical anatomy: A study across young, middle and older adults.Brain Stimul. 2022 Jan-Feb;15(1):125-140. doi: 10.1016/j.brs.2021.11.018. Epub 2021 Nov 23. Brain Stimul. 2022. PMID: 34826627 Free PMC article.
-
i-SATA: A MATLAB based toolbox to estimate current density generated by transcranial direct current stimulation in an individual brain.J Neural Eng. 2020 Oct 14;17(5):056034. doi: 10.1088/1741-2552/aba6dc. J Neural Eng. 2020. PMID: 32674087 Free PMC article.
-
Personalized Dose Selection for Treatment of Patients with Neuropsychiatric Disorders Using tDCS.Brain Sci. 2024 Nov 21;14(12):1162. doi: 10.3390/brainsci14121162. Brain Sci. 2024. PMID: 39766361 Free PMC article.
-
Personalized Transcranial Direct Current Stimulation for Behavioral and Neurophysiologic Outcomes.JAMA Netw Open. 2025 Aug 1;8(8):e2526148. doi: 10.1001/jamanetworkopen.2025.26148. JAMA Netw Open. 2025. PMID: 40853662 Free PMC article.
-
Variation of cerebrospinal fluid in specific regions regulates focality in transcranial direct current stimulation.Front Hum Neurosci. 2022 Sep 2;16:952602. doi: 10.3389/fnhum.2022.952602. eCollection 2022. Front Hum Neurosci. 2022. PMID: 36118967 Free PMC article.
References
Publication types
MeSH terms
Grants and funding
LinkOut - more resources
Full Text Sources
Other Literature Sources
