. 2019 Aug 21;9(1):12154.
doi: 10.1038/s41598-019-48520-7.

BTLA suppress acute rejection via regulating TCR downstream signals and cytokines production in kidney transplantation and prolonged allografts survival

Affiliations

BTLA suppress acute rejection via regulating TCR downstream signals and cytokines production in kidney transplantation and prolonged allografts survival

Jiayi Zhang et al. Sci Rep. .

Erratum in

Abstract

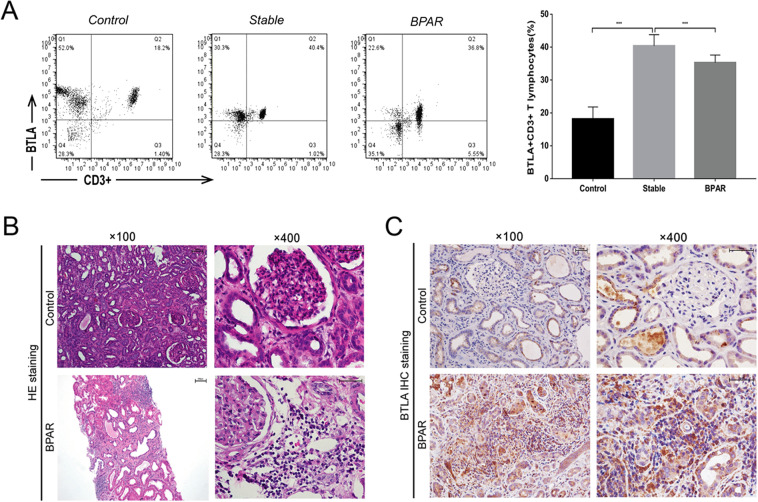
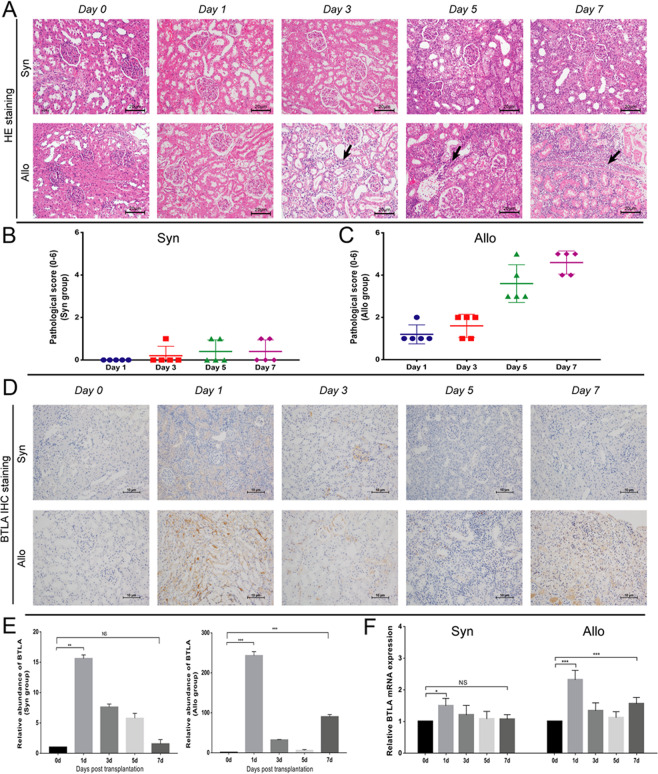
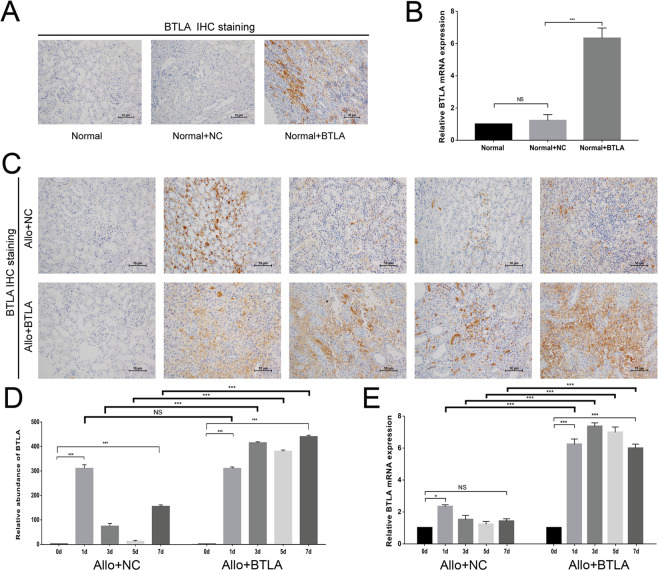
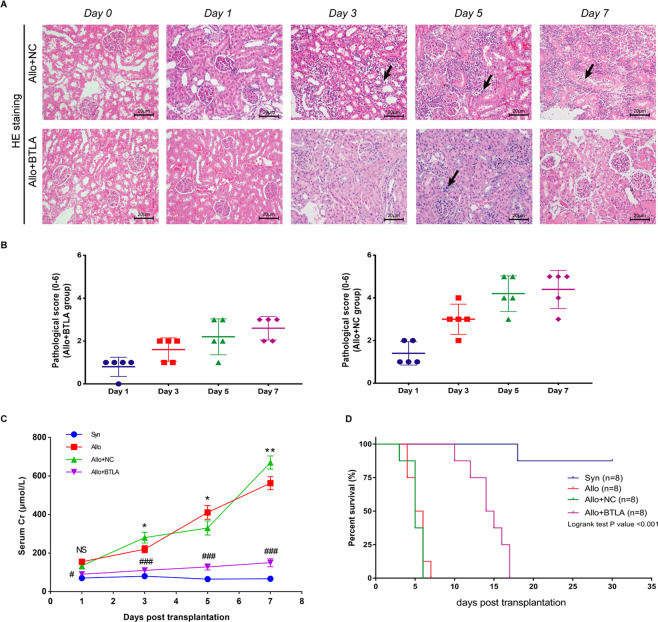
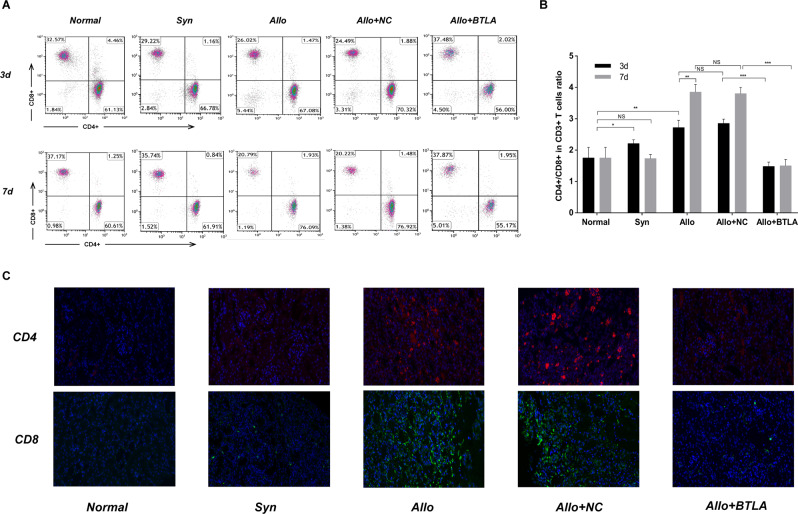
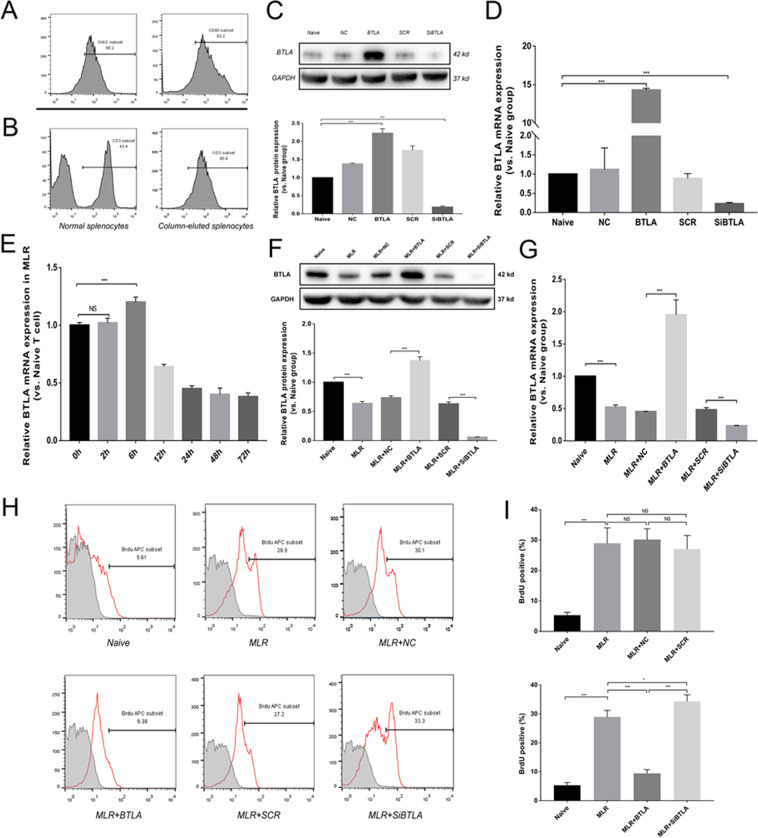
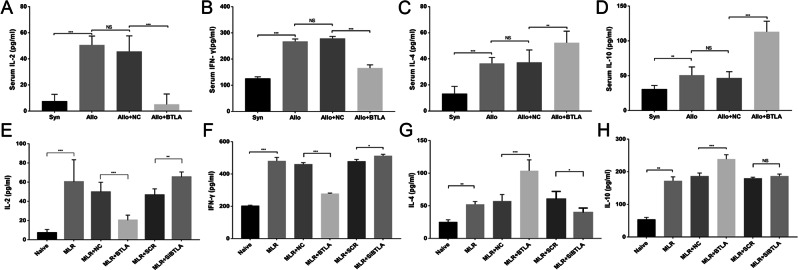
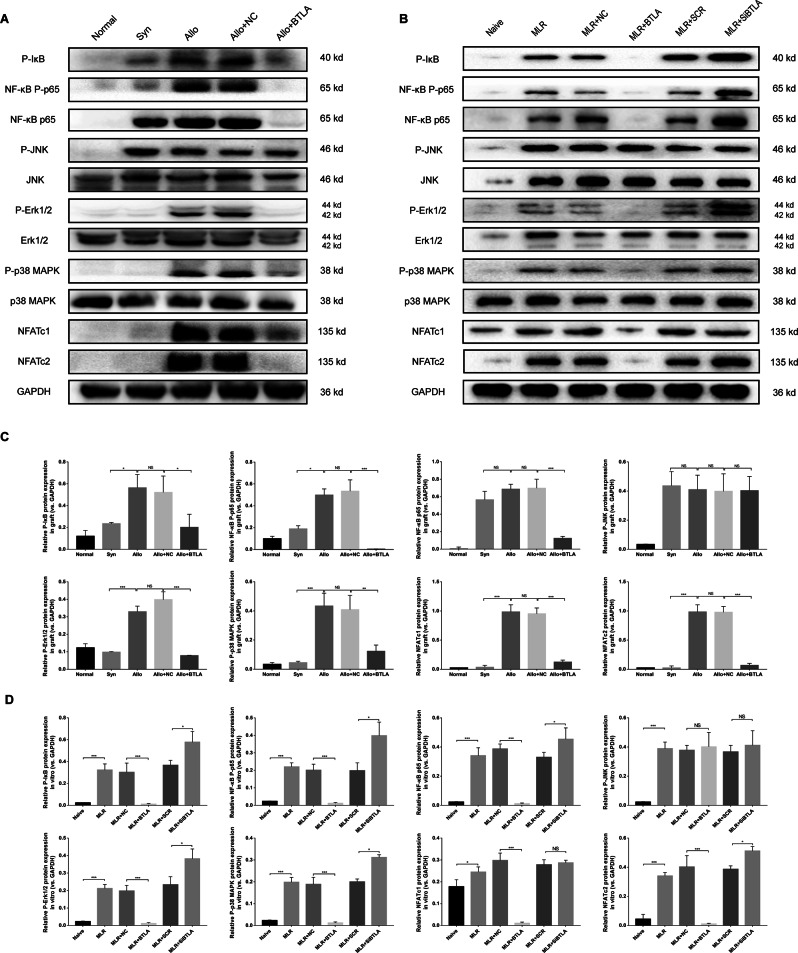
Acute rejection is a major risk for renal transplant failure. During this adverse process, activated T cells are considered the main effectors. Recently, B and T lymphocyte attenuator (BTLA), a member of the CD28 family receptor, was reported to be a novel inhibitory regulator of T cell activation in heart and pancreatic allograft rejection. Due to the similarity of acute rejection pathways among different organs, we hypothesized that BTLA might play a role in acute rejection of kidney transplant. In renal transplant patients, we observed that BTLA expression was significantly decreased in peripheral CD3+ T lymphocytes of biopsy-proven acute rejection (BPAR) recipients compared with control patients with stable transplanted kidney functions. Remarkably, overexpression of BTLA in the rat model was found to significantly inhibit the process of acute rejection, regulate the postoperative immune status, and prolong allograft survival. BTLA overexpression significantly suppressed IL-2 and IFN-γ production and increased IL-4 and IL-10 production both in vivo and in vitro. Moreover, vital factors in T-cell signaling pathways, including mitogen-associated protein kinases (MAPK), nuclear factor-kappa B (NF-κB) and nuclear factor of activated T cells (NFAT), were also significantly repressed by BTLA overexpression. Therefore, BTLA can suppress acute rejection and regulate allogeneic responses of kidney transplant by regulating TCR downstream signals and inflammatory cytokines production to improve allografts outcomes.


Conflict of interest statement

The authors declare no competing interests.

Figures

Figure 1
Figure 1
BTLA expression in human recipients among the Control, BPAR and Stable groups. (A) Flow cytometry was used to compare BLTA expression on the surface of CD3+ T cells in peripheral blood mononuclear cells (PBMCs) obtained from the BPAR and Stable groups, and the percentage of BTLA+ cells among CD3+ T cells. Data are means ± SD. **P < 0.01. (B) HE staining showing the histological features of allograft tissue among the Control and BPAR groups following transplantation (magnifications: 100X and 400X). (C) BTLA protein expression by immunohistochemical staining (IHC) in the BPAR and control groups.
Figure 2
Figure 2
Establishment of the rat renal allograft acute rejection model and expression of BTLA in grafts. (A) HE staining of the histological features of renal tissue between the Syn and Allo groups at Day 0, 1, 3, 5, and 7 following transplantation (magnification: 200x). Arrow: monocyte infiltration. (B,C) Semi-quantitative assessment of graft tissues from the Syn and Allo groups based on the Banff 2017 classification at Day 0, 1, 3, 5, and 7 after kidney transplantation (n = 5 for each time point). (D) Postoperative BTLA protein expression of kidney grafts by IHC in the Syn and Allo groups (magnification: 200x). (E) Integrated optical density (IOD) value used to express the relative quantity of BTLA protein. (F) Postoperative mRNA expression of BTLA in kidney grafts by qRT-PCR in the Syn and Allo groups. The control was a non-treated SD rat (Day 0 among each groups). Data are expressed as the means ± SD. NS, not significant, *P < 0.05, **P < 0.01 and ***P < 0.001 versus the no-treated rat.
Figure 3
Figure 3
Expression of BTLA in rat allografts in the Allo + NC and Allo + BTLA groups. (A) IHC staining showed significantly upregulated BTLA expression in the kidney tissue of the SD rat by BTLA-overexpression adenovirus (Normal + BTLA) compared with the negative control vector (Normal + NC) and normal SD rat (Normal). (B) qRT-PCR showed upregulated mRNA expression of BTLA induced by the BTLA-overexpression adenovirus. (C) Postoperative BTLA expression of the kidney graft by IHC staining between the Allo + NC and Allo + BTLA groups (magnification: 200×). (D) Integrated optical density (IOD) value for quantifying BTLA protein. (E) mRNA expression of BTLA in the kidney graft by qRT-PCR among the Allo + NC and Allo + BTLA groups. Data are expressed as the means ± SD. NS, not significant, *P < 0.05, **P < 0.01 and ***P < 0.001.
Figure 4
Figure 4
Overexpression of BTLA significantly attenuates graft acute rejection and improves graft survival. (A) HE staining of the histological features of renal tissue between the Allo + NC and Allo + BTLA groups at Day 0, 1, 3, 5, and 7 following transplantation (magnification: 200×). Arrow: monocyte infiltration. (B) Semi-quantitative assessment of graft tissues based on the Banff classification at Day 1, 3, 5, and 7 after kidney transplantation (n = 5 for each time point). (C) Serum creatinine (SCr) among the four groups on Day 0, 1, 3, 5, and 7 after surgery. Data are presented as the means ± SD. For the Allo group vs the Allo + NC group: NS, not significant, *P < 0.05, **P < 0.01 and ***P < 0.001. For the Allo + NC group vs the Allo + BTLA group: #P < 0.05 and ###P < 0.001. (D) Rat graft survival among the four groups after renal transplantation.
Figure 5
Figure 5
Postoperative immune status of rat recipients. (A) Flow cytometry analysis of CD4+ and CD8+ T cells in CD3+ T cells of peripheral blood cells of SD recipients at D3 and D7 following kidney transplantation (n = 5 in each group at each time point). (B) The ratio of postoperative CD4+ and CD8+ T cells in CD3+ T cells of SD recipients at D3 and D7 following kidney transplantation. Data are presented as the means ± SD. NS, not significant, *P < 0.05, **P < 0.01 and ***P < 0.001. (C) Immunofluorescence assay of graft tissue sections stained with CD4 and CD8 antibodies among the different groups at D7 following kidney transplantation. Magnification: 40× for CD4 and CD8.
Figure 6
Figure 6
Effect of BTLA in the mixed lymphocyte reaction. (A) Flow cytometry analyses of OX62 and CD80 on primary mature DCs from the Wistar rat. (B) Flow cytometry analysis of CD3 on splenic lymphocytes from the naive SD rat and purified splenic lymphocytes from the SD rat. (C) Relative BTLA protein expression in splenic lymphocytes among different transfected groups by western blot analysis. (D) Relative BTLA mRNA expression in splenic lymphocytes from different transfected groups by qRT-PCR. (E) Relative BTLA mRNA expression in the MLR group at 0 h, 2 h, 6 h, 12 h, 24 h, 48 h and 72 h by qRT-PCR. (F) Protein level of BTLA among different transfected MLR groups by western blot analysis. (G) Relative BTLA mRNA expression among different transfected MLR groups by qRT-PCR. (H,I) BrdU-positive cell percentage among different transfected MLR groups by flow cytometry analysis. The results are presented as the means ± SD of three independent experiments. NS, not significant, *P < 0.05, **P < 0.01 and ***P < 0.001.
Figure 7
Figure 7
Secretion of cytokines in the acute renal transplant rejection rat model and in the MLR. (AD) Rat serum cytokines, including (A) IL-2, (B) IFN-γ, (C) IL-4, and (among the different groups at D7 follow) IL-10, were measured on D7 in the different transfected groups by ELISA. (EH) The cytokines (A) IL-2, (B) IFN-γ, (C) IL-4, and (D) IL-10 at 72 h of MLR were assayed by ELISA in the different transfected MLR groups.
Figure 8
Figure 8
Expression of downstream factors during TCR signaling activation in the acute renal transplant rejection rat model and in MLR. Protein expression levels of P-IκB, NF-κB P-P65, NF-κB P65, P-Erk1/2, Erk1/2, JNK, P-JNK, P-p38 MAPK, p38 MAPK, NFATc1 and NFATc2 among the groups in vivo (A,C) and in vitro (B,D). The grouping of gels/blots cropped from different parts of the same gel or from different gels. The results are representative of three independent experiments.

References

    1. Rana A, et al. Survival benefit of solid-organ transplant in the United States. JAMA surgery. 2015;150:252–259. doi: 10.1001/jamasurg.2014.2038. - DOI - PubMed
    1. Wong G, et al. Time on dialysis and cancer risk after kidney transplantation. Transplantation. 2013;95:114–121. doi: 10.1097/TP.0b013e31827743b4. - DOI - PubMed
    1. Nickel P, Bestard O, Volk HD, Reinke P. Diagnostic value of T-cell monitoring assays in kidney transplantation. Current opinion in organ transplantation. 2009;14:426–431. doi: 10.1097/MOT.0b013e32832c5999. - DOI - PubMed
    1. Hariharan Sundaram, Stablein Donald E. Improvements in Long‐term Renal Transplant Graft Survival. American Journal of Transplantation. 2005;5(3):630–631. doi: 10.1111/j.1600-6143.2005.00746.x. - DOI - PubMed
    1. Acott P, Babel N. BK virus replication following kidney transplant: does the choice of immunosuppressive regimen influence outcomes? Annals of transplantation. 2012;17:86–99. doi: 10.12659/AOT.882640. - DOI - PubMed

Publication types

MeSH terms