. 2019 Sep;573(7772):69-74.
doi: 10.1038/s41586-019-1485-8. Epub 2019 Aug 21.

Mechanosensation of cyclical force by PIEZO1 is essential for innate immunity

Affiliations

Mechanosensation of cyclical force by PIEZO1 is essential for innate immunity

Angel G Solis et al. Nature. 2019 Sep.

Erratum in

Abstract

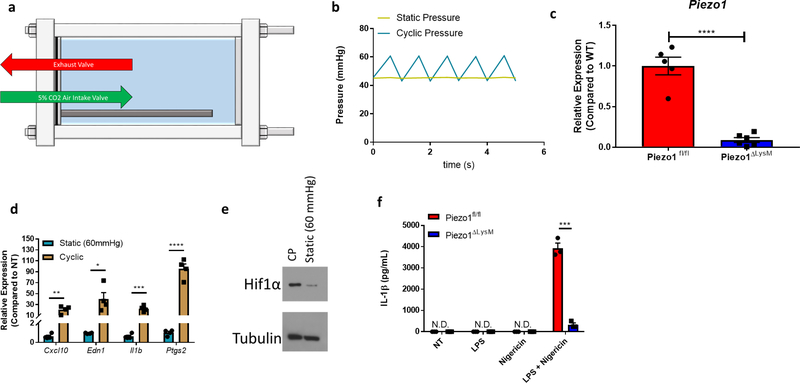
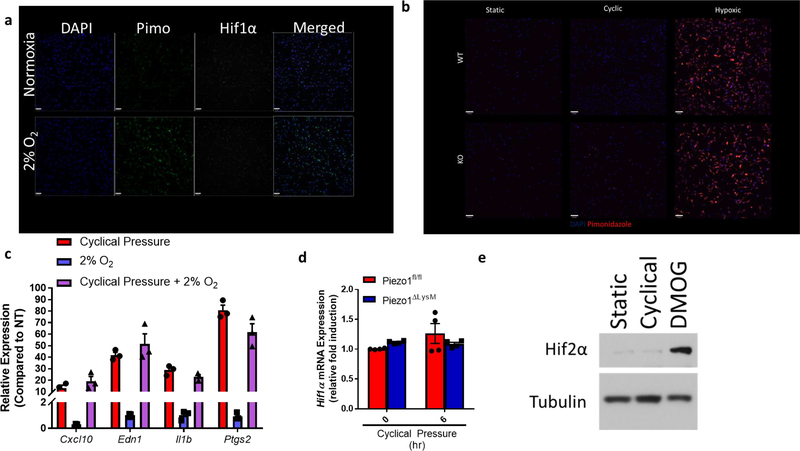
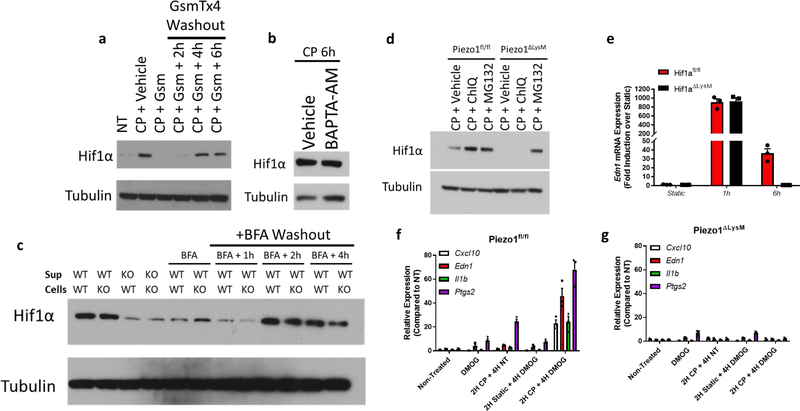
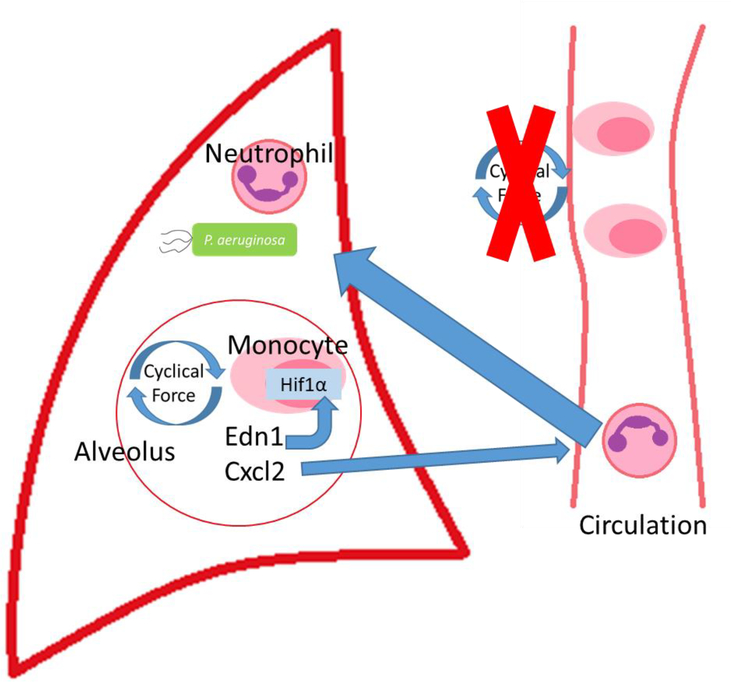
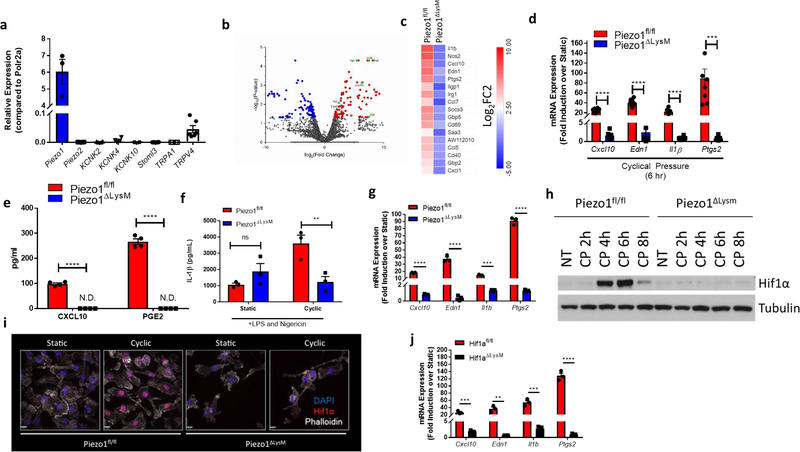
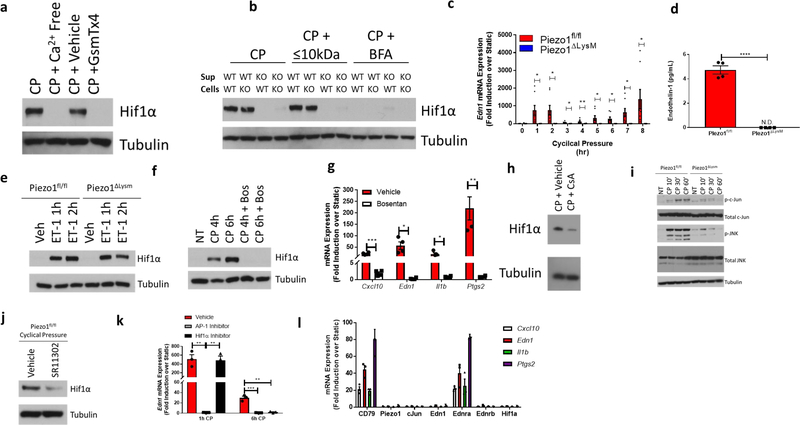
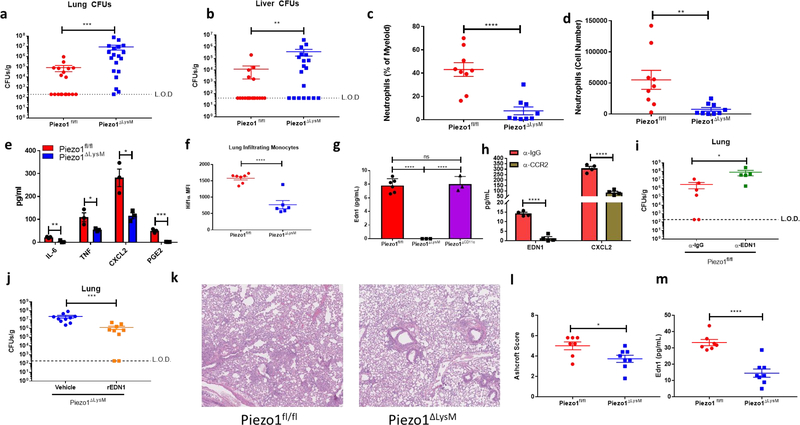
Direct recognition of invading pathogens by innate immune cells is a critical driver of the inflammatory response. However, cells of the innate immune system can also sense their local microenvironment and respond to physiological fluctuations in temperature, pH, oxygen and nutrient availability, which are altered during inflammation. Although cells of the immune system experience force and pressure throughout their life cycle, little is known about how these mechanical processes regulate the immune response. Here we show that cyclical hydrostatic pressure, similar to that experienced by immune cells in the lung, initiates an inflammatory response via the mechanically activated ion channel PIEZO1. Mice lacking PIEZO1 in innate immune cells showed ablated pulmonary inflammation in the context of bacterial infection or fibrotic autoinflammation. Our results reveal an environmental sensory axis that stimulates innate immune cells to mount an inflammatory response, and demonstrate a physiological role for PIEZO1 and mechanosensation in immunity.


Figures

Extended Data Figure 1:
Extended Data Figure 1:. Pressure Chamber Schematic and PIEZO1 Knockout Validation
a, Schematic of cyclical hydrostatic pressure bioreactor showing side view. b, Graph of pressure regimes used within the pressure chamber. c, qPCR analysis of Piezo1 transcript in unstimulated BMDMs from Piezo1fl/fl (WT) and Piezo1ΔLysM mice. Data is presented as 5 biological replicates from two independent experiments. d, qPCR analysis of Piezo1fl/fl BMDMs treated with static pressure at the indicated magnitude, or with cyclical hydrostatic pressure for 6 hours. Data is presented as 4 biological replicates from two independent experiments. e, Representative immunoblot analysis of HIF1α and β-tubulin from Piezo1fl/fl BMDMs treated with static pressure at the indicated magnitude, or with cyclical hydrostatic pressure for 6 hours. Data is representative of 2 independent experiments. f, ELISA analysis of IL-1β from Piezo1fl/fl and Piezo1ΔLysM BMDMs treated with cyclical hydrostatic pressure alone (NT), LPS (10 ng/mL) for 5h in cyclical hydrostatic pressure followed by 1h cyclical hydrostatic pressure, 5h cyclical hydrostatic pressure followed by 1h nigericin (10 μM) in cyclical hydrostatic pressure, or LPS (10 ng/mL) for 5h followed by 1h nigericin (10 μM) with cyclical hydrostatic pressure. Data is presented as 3 biological replicates. c,d,f SEM of replicates is present and significance is determined by unpaired two-tailed T test (*p<0.05, **p<0.01, ***p<0.001, ****p<0.0001).
Extended Data Figure 2:
Extended Data Figure 2:. HIF1α Stabilization is Hypoxia Independent During Cyclical Hydrostatic Pressure Stimulation
a, Representative confocal microscopy of BMDMs treated for 6 hours in either normoxic conditions or in a hypoxic chamber (2% O2). Cells were treated with pimonidazole (20 μM) 1 hour prior to completion of treatment. Upon completion, cells were fixed, permeabilized, and stained with monoclonal antibody against pimonidazole. Data is representative of 2 independent experiments. b, Confocal microscopy of BMDMs treated for 6 hours in either static pressure, cyclical pressure, or hypoxic chamber (0.5% O2). Cells were treated with pimonidazole (20 μM) 1 hour prior to completion of treatment. Upon completion, cells were fixed, permeabilized, and stained with monoclonal antibody against pimonidazole. Data is representative of 2 independent experiments. c, qPCR analysis of BMDMs treated with cyclical hydrostatic pressure, 2% O2, or cyclical hydrostatic pressure with 2% O2 for 6 hours. Data is presented as 3 biological replicates. d, qPCR analysis of Hif1a-mRNA in BMDMs following cyclical hydrostatic pressure. Data is presented as 4 biological replicates. Data is from 2 independent experiments. e, Representative immunoblot analysis of HIF2α and β-tubulin from BMDMs treated with static pressure, cyclical hydrostatic pressure, or DMOG (200 μM) for 6 hours. b,c, SEM of replicates is shown, and significance is determined by unpaired two-tailed t-test.
Extended Data Figure 3:
Extended Data Figure 3:. Cyclical Hydrostatic Pressure Induced HIF1α Protein is Stabilized Independent of Acidity
a, Intracellular pH measurements using pHrodo intracellular pH indicator dye for final 30 minutes of treatment. Cells were treated with cyclical hydrostatic pressure for the indicated periods or with low pH cell medium for 6 hours. a,b, SEM of replicates is shown, and significance is determined by unpaired two-tailed t-test. b, pH measurements of supernatant taken with a pH electrode from BMDM culture treated with cyclical hydrostatic pressure for the indicated periods.
Extended Data Figure 4:
Extended Data Figure 4:. Kinetics and Sufficiency of Cyclical Hydrostatic Pressure Induced HIF1α Stabilization and Transcriptional Response
a, Representative immunoblot analysis of HIF1α and β-tubulin from BMDMs in cyclical hydrostatic pressure with GsmT×4 (Gsm) (5 μM) for 6 hours, then washed three times in DMEM prior to further cyclical hydrostatic pressure stimulation. b, Representative immunoblot analysis of HIF1α and β-tubulin from BMDMs in cyclical hydrostatic pressure for 6 hours pretreated with BAPTA-AM (10 μM) for 30 minutes. Data is representative of 2 independent experiments. c, Representative immunoblot analysis of HIF1α and β-tubulin in BMDMs. Piezo1fl/fl (WT) or Piezo1ΔLysM (KO) were cultured in cyclical hydrostatic pressure for 6 hours along with BFA (3 μg/mL). Cells were then washed with DMEM three times and further subjected to additional cyclical hydrostatic pressure stimulation. Supernatant (sup) was then clarified and transferred to WT or KO BMDMs cultured in static pressure for 2 additional hours. d, Representative immunoblot analysis of HIF1α and β-tubulin from cyclical hydrostatic pressure stimulated BMDMs treated with chloroquine (ChlQ, 100 μM) or MG132 (50 μM) for 6 hours with cyclical hydrostatic pressure. e, qPCR analysis of Edn1 from Hif1afl/fl and Piezo1ΔLysM BMDMs treated with cyclical hydrostatic pressure for 1 and 6 hours. Data is presented as 3 biological replicates. f-g, qPCR analysis of (f) Piezo1fl/fl or (g) Piezo1ΔLysM BMDMs cultured in 6 hours of DMOG treatment (200 μM), 6 hours of cyclical hydrostatic pressure (CP), 2 hours of cyclical hydrostatic pressure followed by 4 hours of no treatment (NT), 2 hours of static pressure followed by 4 hours DMOG (200 μM), or 2 hours cyclical hydrostatic pressure followed by 4 hours DMOG (200 μM). Data is representative of 3 biological replicates. SEM of replicates is shown.
Extended Data Figure 5:
Extended Data Figure 5:. Bacterial Infection Has No Effect on MSIC Expression
a-c, qPCR analysis of known mammalian mechanosensory ion channels from (a) monocytes, (b) alveolar macrophages, or (c) neutrophils sorted sorted from lung of mice infected with P. aeruginosa or PBS for 6 hours. Data is represented as fold increase over neutrophil expression for each gene. Data is representative of 4 biological replicates. SEM of replicates is shown.
Extended Data Figure 6:
Extended Data Figure 6:. PIEZO1-Dependent Cyclical Hydrostatic Pressure Stabilizes HIF1α in the Lung
a, Representative flow cytometry of lungs from Piezo1fl/fl (top) (n=9) or Piezo1ΔLysM (bottom) (n=9) mice infected intranasally with P. aeruginosa for 6 hours. Lymphoid lineage consists of TCRβ, NK1.1, B220, CD19, CD90.2, and TCRγδ. Data is representative of 2 independent experiments. b-c, Infiltrating monocyte quantification in terms of (b) percentage and (c) total numbers following 6 hours of intranasal P. aeruginosa infection. Data is representative of 2 independent experiments. d, Representative intracellular flow cytometry histograms of HIF1α from total lung interstitial monocytes of Piezo1fl/fl and Piezo1ΔLysM mice infected intranasally with P. aeruginosa for 6 hours. Data is from 2 independent experiments. e, Mean fluorescent intensity of HIF1α from in vivo labeled CD45.2+ circulatory monocytes from mice infected with P aeruginosa for 6 hours. Data is from 2 independent experiments. f, Mean fluorescent intensity of HIF1α from tissue-infiltrated and circulatory monocytes from mice infected with P aeruginosa intranasally or intraperitoneally for 6 hours. Data is from 2 independent experiments. g, qPCR analysis from BMDMs treated with oscillatory shear stress for 6 hours. Data is representative of 3 biological replicates. c-g, SEM of replicates is present and significance is determined by unpaired two-tailed T test (****p<0.0001).
Extended Data Figure 7:
Extended Data Figure 7:. Endothelin-1 Signaling Confers Protection to P aeruginosa Infection
a, CFUs from liver of Piezo1fl/fl mice infected intranasally with P. aeruginosa for 24 hours treated with α-EDN1 (ENDO20–2101.70, ThermoFisher) (25 μg) or isotype control intranasally 6 hours prior to infection. Data is from 2 independent experiments. b, CFUs from liver of Piezo1ΔLysM mice infected intranasally with P. aeruginosa for 24 hours treated with vehicle (PBS) or Endothelin-1 (rEDN1)(10ug) at the time of infection. Data is from 2 independent experiments. c-d, CFUs from (c) lung or (d) liver of Piezo1fl/fl mice infected intranasally with P. aeruginosa for 24 hours treated with vehicle (DMSO) or bosentan (100 mg/kg) intraperitoneally 3 hours prior to infection. Data is from 2 independent experiments. SEM of replicates is shown, and significance is determined by unpaired Mann-Whitney U Test (*p<0.05,**p<0.01).
Extended Data Figure 8:
Extended Data Figure 8:. PIEZO1 Recognition of Cyclical Force Drives a HIF1α Proinflammatory Program
Cyclical force signals via PIEZO1 in myeloid cells, resulting in Ca2+ influx and AP-1 induced EDN1 expression. Ednrb signaling then drives HIF1α stabilization and proinflammatory transcriptional upregulation.
Extended Data Figure 9:
Extended Data Figure 9:. Infiltrating Monocytes Recognize Cyclical Hydrostatic Pressure in the Lung Via PIEZO1 to Trigger Neutrophil Mediated Bacterial Clearance
Recruited monocytes recognize cyclical force via PIEZO1 in the lung and secrete EDN1 to drive HIF1α stabilization and CXCL2 expression to induce neutrophilia and bacterial clearance.
Figure 1:
Figure 1:. PIEZO1 Signaling in Macrophages Induces Transcriptional Reprogramming Via HIF1α
a, qPCR analysis of known mammalian mechanosensory ion channels from unstimulated BMDMs. Data is presented as 3 biological replicates from 2 independent experiments. b, Volcano plots showing differentially expressed genes comparing 6 hours of cyclic hydrostatic pressure and 6 hours static stimulated treated Piezo1fl/fl BMDMs c, HeatMap showing top genes upregulated by PIEZO1 signaling. Data is shown as Log2 fold change of cyclical hydrostatic pressure over static pressure treated Piezo1fl/fl or Piezo1ΔLysM BMDMs 6 hours post mechanostimulation d, qPCR analysis of top upregulated genes from BMDMs treated with 6 hours of cyclic hydrostatic pressure. Data is presented as 8 biological replicates from 3 independent experiments. e, ELISA of CXCL10 and PGE2 from supernatant of BMDMs cultured in cyclical hydrostatic pressure or static pressure for 6 hours. Data is presented as 4 biological replicates from 2 independent experiments. f, IL-1β levels from BMDMs treated with 5 hours of LPS (10 ng/mL) and 1 hour of nigericin (10 μM) in cyclic hydrostatic pressure or static pressure as measured by ELISA. Data is presented as 3 biological replicates. g, qPCR validation of top upregulated genes from purified mouse monocytes treated with 6 hours of cyclic hydrostatic pressure. Data is presented as 3 biological replicates. h, Representative immunoblot analysis of HIF1α and β-tubulin in BMDMs cultured in cyclical hydrostatic pressure. Blots are representative of 5 independent experiments. i, Confocal microscopy detection of HIF1α from BMDMs cultured in static or cyclical hydrostatic pressure for 6 hours. Data is representative of 2 independent experiments. j, qPCR analysis of Hif1afl/fl and Hif1aΔLysM BMDMs treated with 6 hours of cyclical hydrostatic pressure. Data is presented as 3 biological replicates. a,d-g,j, SEM of replicates is present for qPCR and ELISA data, and significance is determined by unpaired two-tailed t test (**p<0.01, ***p<0.001, ****p<0.0001).
Figure 2:
Figure 2:. PIEZO1 Signaling Stabilizes HIF1α via EDN1
a, Representative immunoblot analysis of HIF1α and β-tubulin in BMDMs cultured in cyclical hydrostatic pressure for 6 hours with calcium-free media or with PIEZO1-inhibitor GsmT×4 (5 μM). Blots were representative of 2 independent experiments. b, Representative immunoblot analysis of HIF1α and β-tubulin in BMDMs. Supernatant from Piezo1fl/fl (WT) or Piezo1ΔLysM (KO) cultured in cyclical hydrostatic pressure for 6 hours were transferred to WT or KO BMDMs cultured in static pressure for 2 additional hours. Molecules larger than 10 kDa were removed using a size-exclusion spin column. Secretion was inhibited using Brefeldin A (BFA) (3 μg/mL). Blots were representative of 2 independent experiments. c, qPCR analysis of Edn1 from cyclical hydrostatic pressure treated BMDMs. Data is presented as 8 biological replicates from 3 independent experiments. d, EDN1 ELISA of supernatants from BMDMs treated in 6 hours of cyclical hydrostatic pressure. Data is presented as 4 biological replicates from 2 independent experiments. e, Representative immunoblot analysis of HIF1α and β-tubulin in BMDMs treated with recombinant endothelin-1 (ET-1, 10 nM). Blots were representative of 3 independent experiments. f, Representative immunoblot analysis of HIF1α and β-tubulin in cyclical hydrostatic pressure treated BMDMs in the presence of Bosentan (10 μM). Blots were representative of 3 independent experiments. g, qPCR analysis of Piezo1fl/fl BMDMs pretreated with Bosentan (10 μM) for 30 minutes prior to 6 hours of cyclical hydrostatic pressure. Data is presented as 4 biological replicates. h, Representative immunoblot analysis of HIF1α and β-tubulin in BMDMs pretreated with cyclosporine A (10 μM) for 30 minutes prior to 6 hours of cyclical hydrostatic pressure. Blots were representative of 2 independent experiments. i, Representative immunoblot analysis of phospho-c-JUN (p-c-JUN), phosphor-JNK (p-JNK), total c-JUN, total JNK, and β-tubulin in BMDMs cultured in cyclical hydrostatic pressure. Blots were representative of 3 independent experiments. j, Representative immunoblot analysis of HIF1α and β-tubulin in BMDMs pretreated with AP-1 inhibitor SR 11302 (10 μM) for 30 minutes prior to 6 hours of cyclical hydrostatic pressure. Blots were representative of 2 independent experiments. k, qPCR analysis of Edn1 from BMDMs pretreated with either AP-1 inhibitor SR 11302 (10 μM) or with echinomycin (5 nm) for 30 minutes prior to cyclical hydrostatic pressure treatment for 6 hours. Data is presented as 3 biological replicates. l, qPCR analysis of Cas9-KI BMDMs transduced with sgRNAs targeting the indicated gene of interest and treated with cyclical hydrostatic pressure for 6 hours. Data is presented as 3 biological replicates. c,d,g,k,l, SEM of replicates is present for qPCR and ELISA data, and significance is determined by unpaired two-tailed t test (*p<0.05, **p<0.01, ***p<0.001, ****p<0.0001).
Figure 3:
Figure 3:. PIEZO1 Recognition of the Cyclical Hydrostatic Pressure Microenvironment in the Lung Drives Inflammation Via EDN1
a-b, Colony forming units (CFUs) from (a) lung and (b) liver of Piezo1fl/fl (n=19) or Piezo1ΔLysM (n=19) mice infected intransally with P. aeruginosa for 24 hours. Data is from 4 independent experiments. c-d, Neutrophil quantification in terms of (c) percentage of myeloid and (d) total numbers from Piezo1fl/fl or Piezo1ΔLysM lungs infected intranasally with P. aeruginosa for 6 hours. Data is from 2 independent experiments. e, ELISA quantification of indicated cytokines and PGE2 from BALF of Piezo1fl/fl and Piezo1ΔLysM mice infected intranasally with P. aeruginosa for 2 hours. Data is presented as 3 biological replicates from 2 independent experiments. f, Mean fluorescent intensity (MFI) of HIF1α from total lung interstitial monocytes of Piezo1fl/fl (n=7) and Piezo1ΔLysM (n=6) mice infected intranasally with P. aeruginosa for 6 hours. Data is from 2 independent experiments. g, Quantification of EDN1 by ELISA from BALF of Piezo1fl/fl, Piezo1ΔLysM, or Piezo1ΔCD11c vehicle-treated mice or infected intranasally with P. aeruginosa for 2 hours. Data is presented as 6 (Piezo1fl/fl) or 3 (Piezo1ΔLysM and Piezo1ΔCD11c) biological replicates. h, Quantification of EDN1 and CXCL2 by ELISA from BALF of mice depleted of monocytes with intraperitoneal α-CCR2 antibody (20 μg) or with isotype control 24 hours prior to infection. Data is presented as 4 biological replicates. i, CFUs from lung of Piezo1fl/fl mice infected intranasally with P. aeruginosa for 24 hours treated with α-EDN1 (ENDO20–2101.70, ThermoFisher) (25 μg) or isotype control intranasally 6 hours prior to infection. Data is from 2 independent experiments. j, CFUs from lung of Piezo1ΔLysM mice infected intranasally with P. aeruginosa for 24 hours treated with vehicle (PBS) (n=10) or recombinant Endothelin-1 (rEDN1)(10ug) (n=9) intranasally at the time of infection. Data is from 2 independent experiments. k, Representative H&E staining of lung sections 14 days following intratracheal bleomycin treatment at 10× magnification. l, Average blinded Ashcroft score of 5 fields of view from fixed lung tissue H&E stained 14 days following intratracheal bleomycin treatment at 10× magnification. Data is representative of 2 independent experiments. m, ELISA analysis of EDN1 levels from BALF 14 days following intratracheal bleomycin treatment. Data is representative of 2 independent experiments. a,b,i,j, SEM of replicates is present and significance is determined by Mann-Whitney U Test (**p<0.01,***p<0.001). c-h,l,m, SEM of replicates is present and significance is determined by unpaired two-tailed T test (*p<0.05, **p<0.01, ***p<0.001, ****p<0.0001).

Comment in

  • Pressure regulates immune-cell function.
    Walmsley SR. Walmsley SR. Nature. 2019 Sep;573(7772):41-42. doi: 10.1038/d41586-019-02339-4. Nature. 2019. PMID: 31481766 No abstract available.
  • Monocytes feel the pressure.
    Bird L. Bird L. Nat Rev Immunol. 2019 Oct;19(10):595. doi: 10.1038/s41577-019-0220-x. Nat Rev Immunol. 2019. PMID: 31485035 No abstract available.

References

    1. Huse M Mechanical forces in the immune system. Nat. Rev. Immunol 17, 679–690 (2017). - PMC - PubMed
    1. McWhorter FY, Davis CT & Liu WF Physical and mechanical regulation of macrophage phenotype and function. Cell. Mol. Life Sci 72, 1303–1316 (2015). - PMC - PubMed
    1. Coste B et al. Piezo1 and Piezo2 are essential components of distinct mechanically activated cation channels. Science 330, 55–60 (2010). - PMC - PubMed
    1. Murthy SE et al. The mechanosensitive ion channel Piezo2 mediates sensitivity to mechanical pain in mice. Sci. Transl. Med 10, eaat9897 (2018). - PMC - PubMed
    1. Gudipaty SA et al. Mechanical stretch triggers rapid epithelial cell division through Piezo1. Nature 543, 118–121 (2017). - PMC - PubMed

MeSH terms