Comparative Study
. 2019 Sep;573(7772):61-68.
doi: 10.1038/s41586-019-1506-7. Epub 2019 Aug 21.

Conserved cell types with divergent features in human versus mouse cortex

Affiliations
Comparative Study

Conserved cell types with divergent features in human versus mouse cortex

Rebecca D Hodge et al. Nature. 2019 Sep.

Abstract

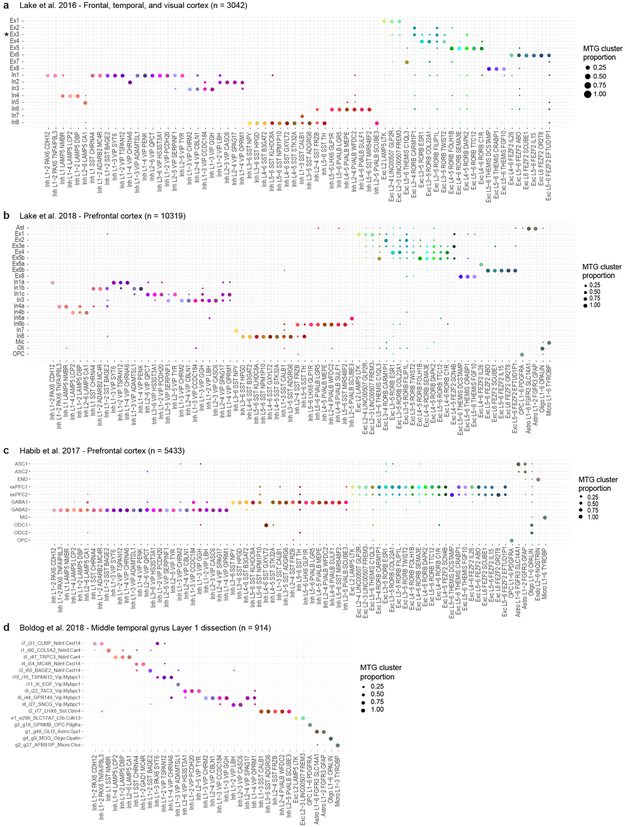
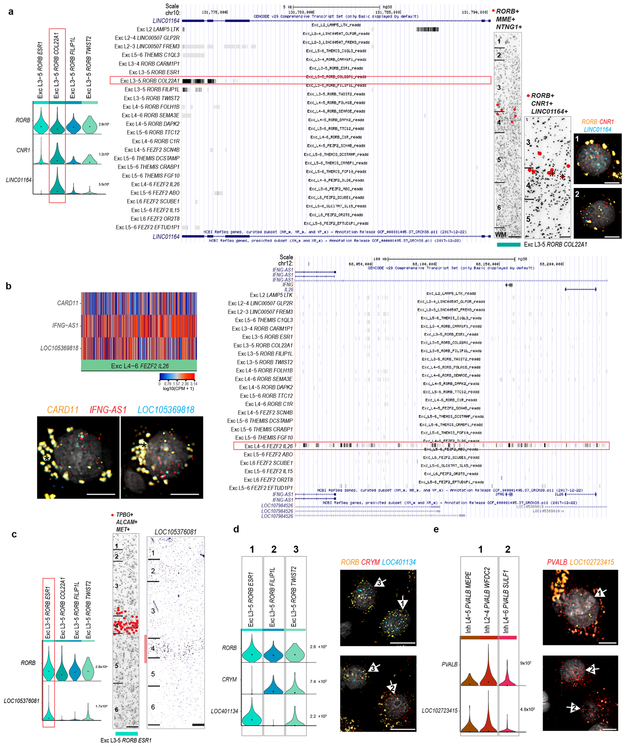
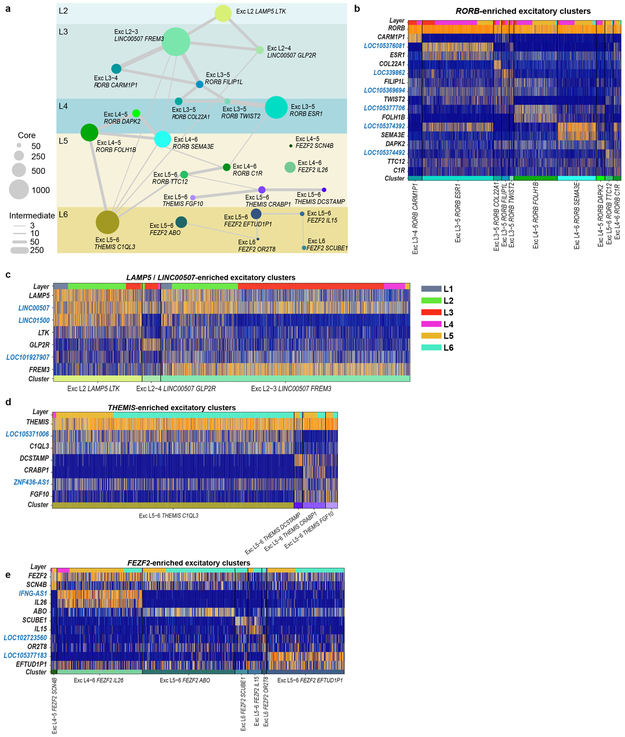
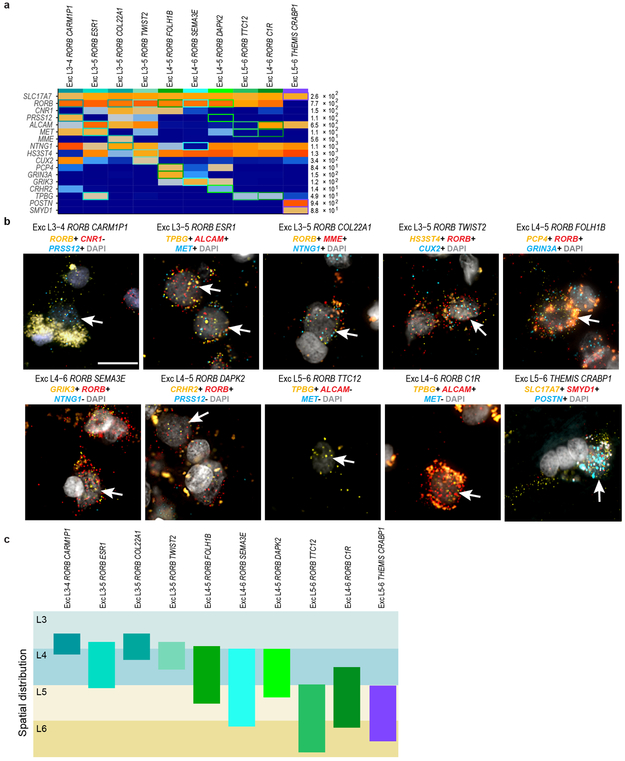
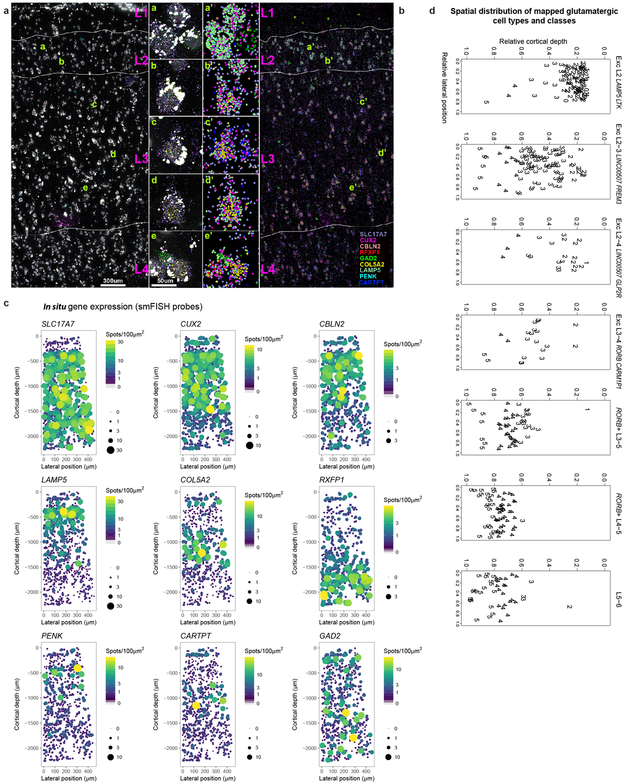
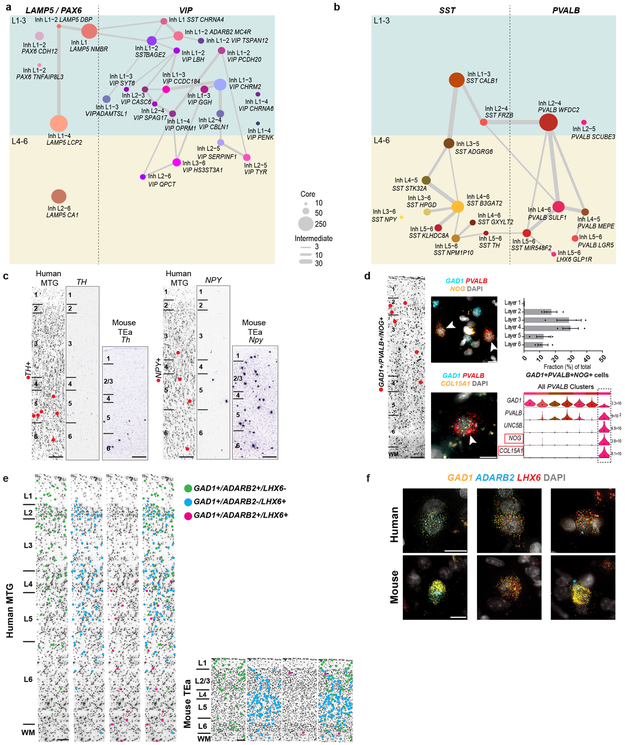
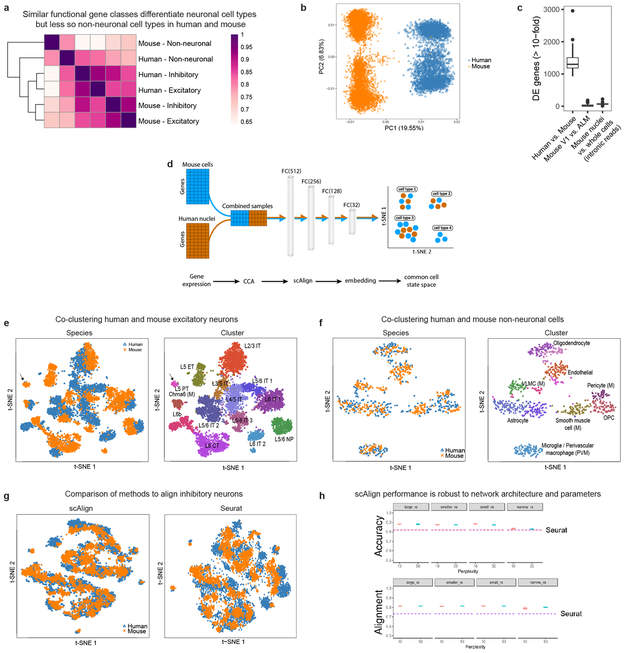
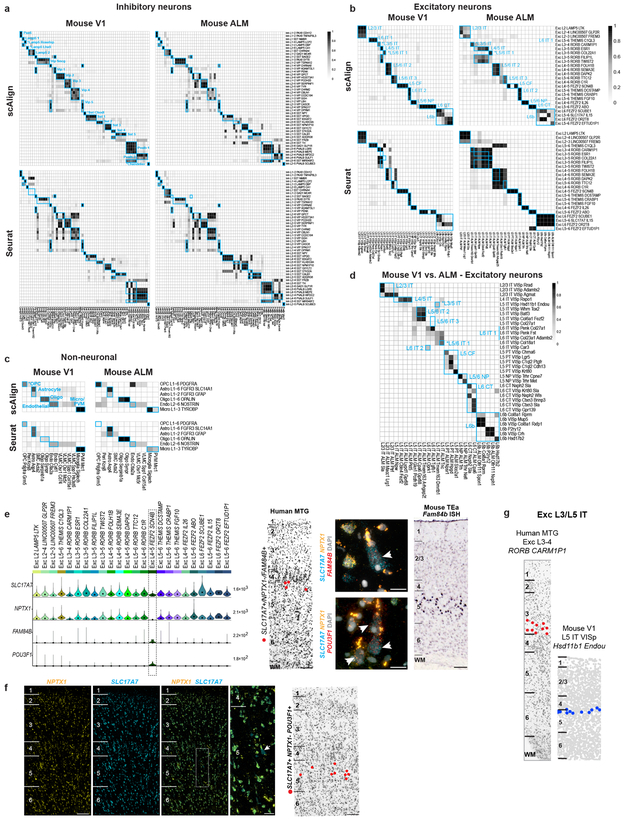
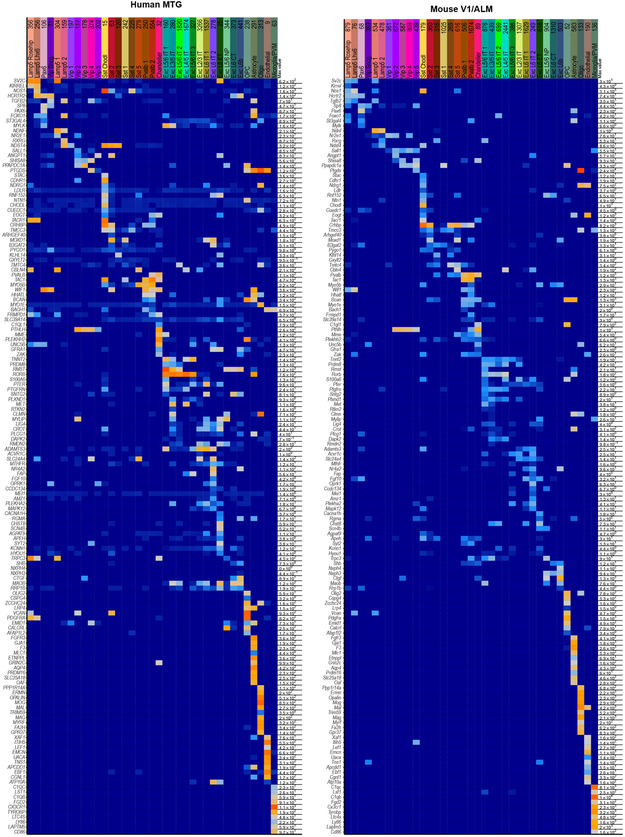
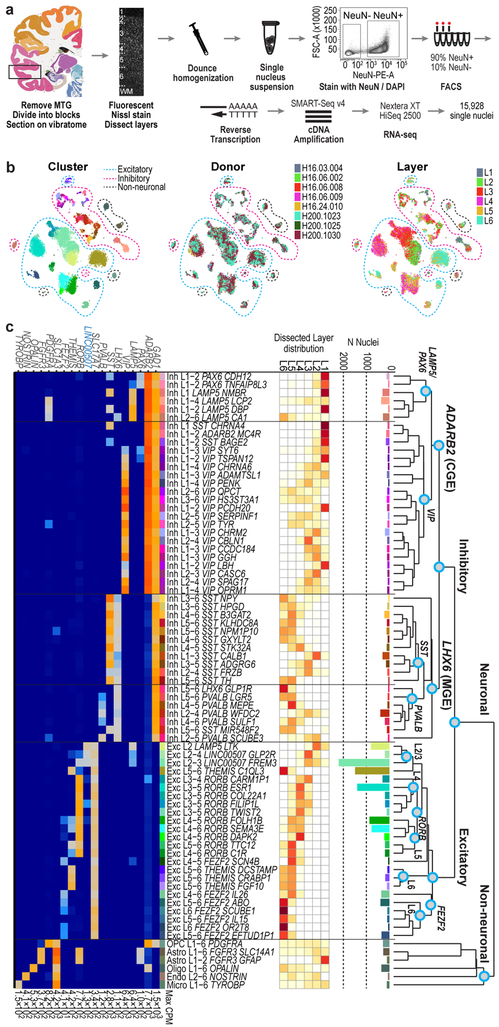
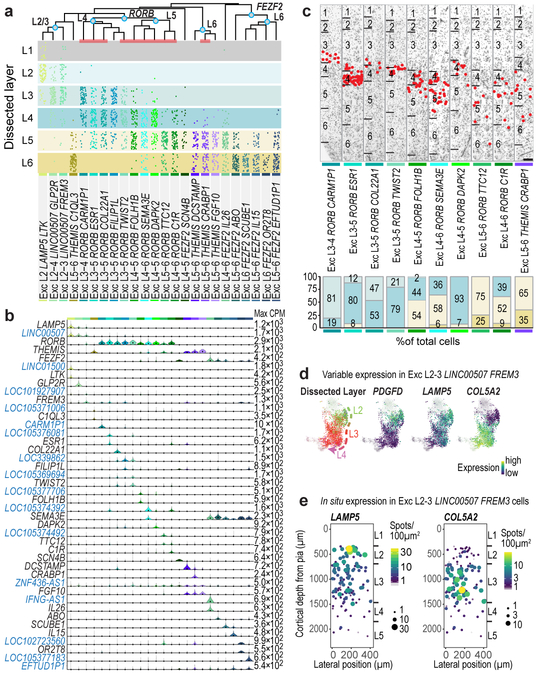
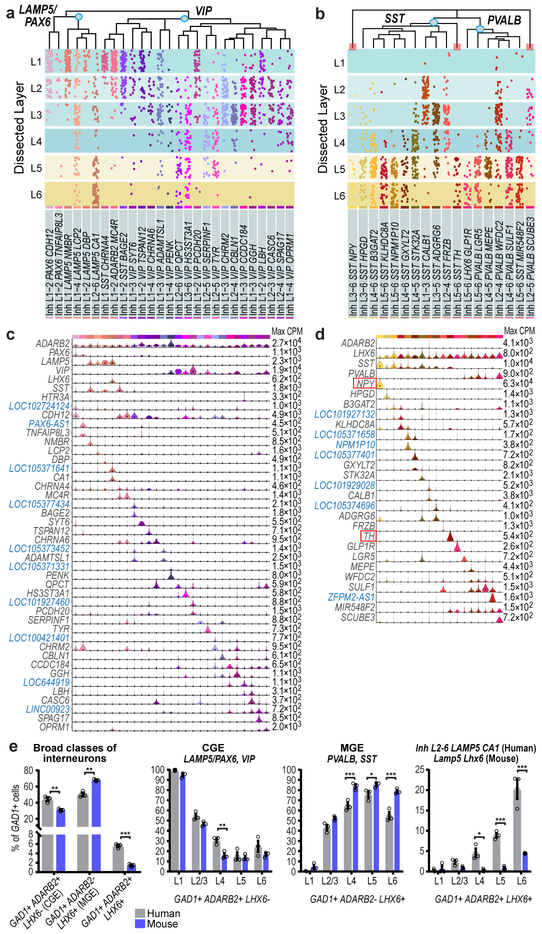
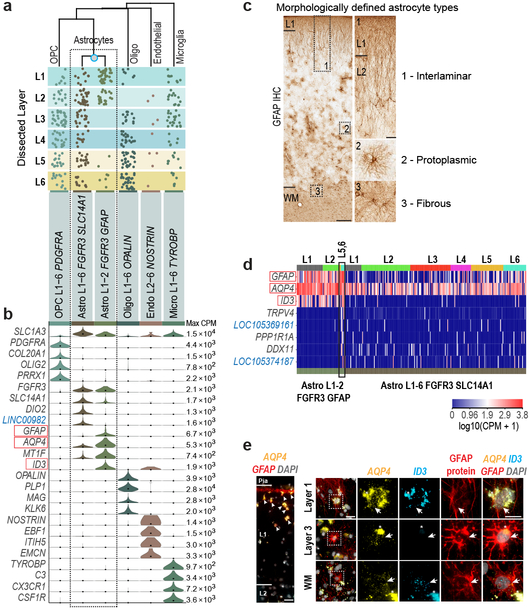
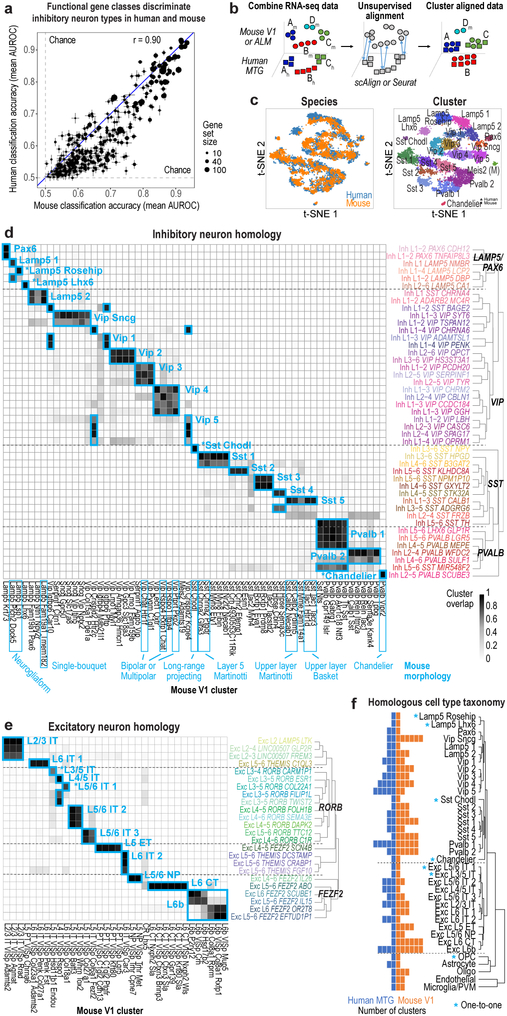
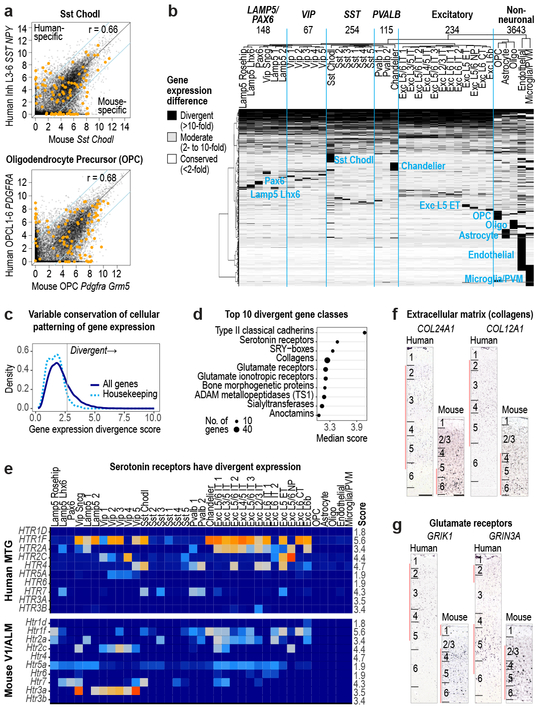
Elucidating the cellular architecture of the human cerebral cortex is central to understanding our cognitive abilities and susceptibility to disease. Here we used single-nucleus RNA-sequencing analysis to perform a comprehensive study of cell types in the middle temporal gyrus of human cortex. We identified a highly diverse set of excitatory and inhibitory neuron types that are mostly sparse, with excitatory types being less layer-restricted than expected. Comparison to similar mouse cortex single-cell RNA-sequencing datasets revealed a surprisingly well-conserved cellular architecture that enables matching of homologous types and predictions of properties of human cell types. Despite this general conservation, we also found extensive differences between homologous human and mouse cell types, including marked alterations in proportions, laminar distributions, gene expression and morphology. These species-specific features emphasize the importance of directly studying human brain.


Figures

Extended Data Figure 1.
Extended Data Figure 1.. Nuclei metadata summarized by cluster.
a, FACS gating scheme for nuclei sorts. b, FACS metadata for index sorted single nuclei (n=571) shows significant variability in NeuN fluoresence intensity (NeuN-PE-A), size (forward-scatter area, FSC-A), and granularity (side-scatter area, SSC-A) across clusters. As expected, non-neuronal nuclei have almost no NeuN staining and are smaller (as inferred by lower FSC values). Error bars represent 95% bootstrapped confidence intervals on mean values (points). c-d, Scatter plots of single nuclei from all clusters (n=15,928) plus median and interquartile interval of three QC metrics grouped and colored by cluster. c, Median total reads were approximately 2.6 million for all cell types, although slightly lower for non-neuronal nuclei. d, Median gene detection was highest among excitatory neuron types in layers 5 and 6 and a subset of types in layer 3, lower among inhibitory neuron types, and significantly lower among non-neuronal types.
Extended Data Figure 2.
Extended Data Figure 2.. Small but consistent expression signature of donor tissue source.
a, mRNA quality was only slightly higher for nuclei isolated from neurosurgical (n=722) versus post-mortem (n=15,206) donors (~3% more uniquely aligned reads and ~350 more genes detected). All nuclei were dissected from cortical layer 5 and sorted based on NeuN-positive staining, and transcripts were sequenced to a median depth of approximately 2.5 million reads per nucleus. Median values (red points) and interquartile interval as indicated. b, Dot plot showing the proportion of nuclei isolated from neurosurgical and postmortem donors among human MTG clusters. Note that most nuclei from neurosurgical donors were isolated only from layer 5 so clusters enriched in other layers, such as layer 1 interneurons, have low representation of these donors. c, Highly correlated (Pearson’s) expression between nuclei from postmortem and neurosurgical donors among two subclasses of excitatory neurons and one subclass of inhibitory neurons. Nuclei were pooled and compared within these subclasses due to the low sampling of individual clusters from neurosurgical donors. Average expression of n=2,180, 1,636, and 815 postmortem nuclei and 127, 38, and 114 neurosurgical nuclei were included for the L5a excitatory, L4 excitatory, and SST+ interneuron comparisons, respectively. d, Expression (log10(CPM + 1)) heatmaps of the top 10 up-regulated genes in nuclei from post-mortem or neurosurgical donors including ribosomal genes and activity-dependent genes, respectively.
Extended Data Figure 3.
Extended Data Figure 3.. Cluster robustness.
a, Cluster separability (mean co-clustering within a cluster minus the maximum co-clustering between clusters) varied substantially among cell types (n=15,928 nuclei), with a subset of neuronal types and all non-neuronal types being highly discrete. b, Scatter plots quantifying the separation of each cluster from its nearest neighbor. Left: Cluster separability based on rounds of iterative clustering using all variable genes are correlated with the number of binary marker genes. Middle: All clusters express at least 30 genes with >2-fold increased expression, but only a subset are binary markers. Right: A substantial fraction of markers of many clusters are unannotated. c, River plots of clusters that merge with more binary markers required for separation. Note that clusters that appear distinct based on layer position (excitatory neurons in layers 2 and 3), morphology (interlaminar astroctyes in layer 1), or homology with mouse (SST+ interneuron subtypes) can have few binary markers. Marker genes for clusters defined by 4 markers (are listed in Supplementary Table 2. d, Confusion plots comparing cluster membership of single nuclei (n=15,928) in reference MTG clusters and clusters generated using a different iterative clustering pipeline. Above each plot are listed the parameter settings and total number of clusters detected. Point size is proportional to the number of nuclei and point color corresponds to the Jaccard index (JI) with darker colors corresponding to a higher JI and greater consistency between clustering. e, Box plots summarizing consistency of cluster membership of single nuclei (n=15,928) across the four iterative clustering runs shown in c. Boxplots show median, interquartile interval, and full range of values. Top: The number of clusters that overlap each reference cluster. A cluster count of 1 indicates a one-to-one match, 0 indicates that a reference cluster was not detected and was merged with a related cluster, and >1 indicates that a reference cluster was split into sub-clusters. *The Exc L2−3 LINC00507 FREM3 reference cluster was consistently divided into subclusters. Bottom: Reference clusters with higher JI values have more consistent membership of nuclei and therefore more distinct borders with related clusters. f, Violin plots of marker gene expression for FREM3 subclusters (n=2,284 nuclei) identified in one clustering run show relatively binary expression. In the violin plot, rows are genes and black dots correspond to median expression. Expression values are on a linear scale.
Extended Data Figure 4.
Extended Data Figure 4.. Expression of cell type specific markers.
a, b, Heatmaps of the top cell type markers for (a) inhibitory neurons and (b) excitatory neurons and non-neuronal cell types. Markers include many non-coding and unannotated genes (blue symbols). Median expression values are shown on a logarithmic scale, with maximum expression values shown on the right side of each row. Up to 5 marker genes are shown for each cell type. Note that LOC genes were excluded from cluster names, and the best non-LOC marker genes were used instead. Dendrograms and cluster names are reproduced from Figure 1. Marker genes for broad classes, as defined manually and using NS forest, are also shown in the top rows of each heatmap.
Extended Data Figure 5.
Extended Data Figure 5.. Clusters in this study capture reported human cortical cell types and additional subtype diversity.
a-c, Dot plots showing the proportion of each MTG cluster that matches reported clusters based on a centroid expression classifier. a, 3 of 16 neuronal clusters reported by Lake et al. (n=3,042 nuclei) match human MTG clusters one-to-one, while the remaining clusters map to multiple MTG clusters. *Ex3 was highly enriched in visual cortex and not detected in temporal cortex by Lake et al. b, 4 of 18 neuronal clusters and 3 of 4 non-neuronal clusters reported by Lake et al. (n=10,319 nuclei) match human MTG clusters one-to-one, including two rare, but distinct interneuron types (Inh L3-6 SST NPY and Inh L2-5 PVALB SCUBE3) and one rare, but distinct excitatory type (Exc L4-5 FEZF2 SCN4B). c, 4 neuronal clusters reported by Habib et al. (n=5,433 nuclei) correspond to broad classes of inhibitory and excitatory neurons. Seven non-neuronal clusters include two astrocyte types that correspond to the types reported in this study, and one additional oligodendrocyte subtype. d, 16 clusters detected in layer 1 of human temporal cortex (n=914 nuclei) are captured at finer subtype resolution in this study.
Extended Data Figure 6.
Extended Data Figure 6.. Excitatory neuron types express marker genes across multiple cortical layers.
a, Constellation diagram showing cluster relationships, relative frequencies, and average layer position. b-e, Heatmaps of log-transformed expression in individual nuclei ordered by cluster and then layer. Clusters are grouped based on their dominant class marker gene, which corresponds to position in superficial (LAMP5/LINC00507, a; RORB, b) and deep (THEMIS, c; FEZF2, d) layers.
Extended Data Figure 7.
Extended Data Figure 7.. RNAscope mFISH validation of 10 excitatory neuron types.
a, Heatmap summarizing combinatoral 3-gene panels used for multiplex fluorescent in situ hybridization assays to explore the spatial distribution of 10 excitatory clusters. Gene combinations for each cluster are indicated by colored boxes on the heatmap. Maximum expression values for each gene are listed on the right of the heatmap and gene expression values are displayed on a log10 scale. Experiments were repeated on at least 2 donors for each probe combination with similar results. b, Gene combinations probed are listed above each image. Labeled cells are indicated by white arrows. Scale bar, 20 μm. c, Schematic representing the laminar distribution of clusters based on the observed positions of labeled cells across at least 3 at sections from at least 2 donors per cell type.
Extended Data Figure 8.
Extended Data Figure 8.. In situ validation of LOC, lncRNA, and antisense transcripts as cell type specific markers.
a, LINC01164 specifically labels the Exc L3-5 RORB COL22A1 cluster (n=160 nuclei). Left: Violin plot showing expression of genes used for cluster validation by multiplex fluorescent in situ hybridization (mFISH). Middle - read pile-ups for shown for LINC01164 across all excitatory clusters (n=24), viewed in UCSC genome browser. Red box indicates Exc L3-5 RORB COL22A1 cluster. Right: mFISH validation of cluster specific marker genes. Laminar distribution of the Exc L3-5 RORB COL22A1 cluster marked by LINC01164 is consistent with the distribution shown using protein coding marker genes (left panel from Fig. 2). Scale bars 100 μm (low mag DAPI-stained columns), 5 μm (mFISH images). Experiments were repeated on 2 donors with similar results. b, The Exc L4-6 FEZF2 IL26 cluster (n=344 nuclei) is specifically marked by INFG-AS1 and LOC105369818. Top - heatmap showing expression of these genes along with protein coding marker gene CARD11. Bottom - mFISH validation of cluster specific marker genes. Experiments were repeated on 3 donors with similar results. Scale bars, 5 μm. Right: read pile-ups for shown for INFG-AS1 across all excitatory clusters, viewed in UCSC genome browser. Red box indicates Exc L4-6 FEZF2 IL26 cluster. c, Violin plot showing expression of LOC105376081 in the Exc L3-5 RORB ESR1 cluster (n=1,428 nuclei). Right: in situ hybridization for LOC105376081 shows expression in layer 4 (red bar), consistent with the anatomical location of Exc L3-5 RORB ESR1 (left panel shows laminar distribution from Fig. 2). Scale bars, 100 μm. d, Violin plot showing expression of LOC401134 and the protein coding gene CRYM in 3 L3-5 RORB-expressing clusters (n=1,674 nuclei). mFISH showing 3 possible combinations for the genes assayed as indicated by labeled arrows. Scale bars, 10 μm. Experiments were repeated on 2 donors with similar results. e, LOC102723415 labels a subset of PVALB clusters (n=618 nuclei) as shown in the violin plot on the left and mFISH images on the right (clusters indicated by labeled arrows). Scale bars, 5 μm. Experiments were repeated on 2 donors with similar results. For all violin plots, rows are genes, black dots correspond to median expression, and maximum expression (CPM) is listed on the far right. Expression values are on a linear scale. Asterisks indicate lipofuscin in mFISH images.
Extended Data Figure 9.
Extended Data Figure 9.. Laminar distribution of superficial excitatory neuron types validated by single molecule (sm)FISH.
a, smFISH (image, 100x) was performed with probes against SLC17A7, CUX2, CBLN2, RFXP1, GAD2, COL5A2, LAMP5, PENK, and CARTPT mRNA. Spots for each gene are pseudo-colored as indicated in the bottom right legend. Layer demarcations are indicated in magenta. Scale bar = 300 μm. b, Spot indications for each gene, pseudo-colored as indicated in the bottom right legend, as in a. a,a’) Superficial layer 2 cells express SLC17A7(lavender), CUX2 (magenta), and LAMP5 (mint). b,b’) At deeper locations in layer 2, an example of an SLC17A7-expressing cell with CUX2, LAMP5 and COL5A2 expression. Note that LAMP5 expression (mint) decreases in CUX2/SLC17A7-expressing cells, while COL5A2/CUX2-expressing cells increase with depth along Layers 2 and 3 (see, c,c’; d,d’; e,e’). c, Probe density (spots per 100 μm2) for 9 genes assayed across layers 1-4 (and partially layer 5) of human MTG. The cortical slice was approximately 0.5mm wide and 2mm deep. Points correspond to cellular locations in situ where the y-axis is the cortical depth from the pial surface and the x-axis is the lateral position. Point size and color correspond to probe density. Cells that lack probe expression are shown as small grey points. Experiments were repeated on 3 donors with similar results. d, In situ location of cells mapped to indicated cell types and classes (different panels) based on expression levels of 9 genes shown in (a). Numbers indicate qualitative calls of the layer to which each cell belongs based on cytoarchitecture, and 0 indicates that the cell was not annotated.
Extended Data Figure 10.
Extended Data Figure 10.. Layer distributions and frequencies of inhibitory neuron types.
a, b Constellation diagram showing cluster relationships, relative frequencies, and average layer position for LAMP5/PAX6 (n=2,320 nuclei) (a) and SST/PVALB (n=1,844 nuclei) (b) classes of inhibitory neurons. c, Chromogenic ISH for TH, a marker of Inh L5−6 SST TH, and NPY, a marker of Inh L3−6 SST NPY, from the Allen Human Brain Atlas. Left columns show grayscale images of the Nissl section nearest the ISH section shown in the right panel for each gene. Red dots show cells positive for the gene assayed by ISH. Experiments were repeated 9 (NPY) and 40 (TH) times with similar results. Chromogenic ISH for Th and Npy in mouse temporal association cortex (TEa) from the Allen Mouse Brain Atlas are to the right of the human images. Experiments were repeated 6 (Npy) and 2 (Th) times with similar results. Scale bars: human (250 μm), mouse (100 μm). d, RNAscope mutiplex fluorescent ISH for markers of Inh L2−5 PVALB SCUBE3. Left - inverted DAPI-stained cortical column with red dots marking cells positive for the genes GAD1, PVALB, and NOG (scale bar, 250 μm). Middle - cells positive for GAD1, PVALB, and the specific marker genes NOG (top, scale bar 10 μm) and COL15A1 (bottom, scale bar 10 μm). White arrows mark triple positive cells. Experiments were repeated on 3 donors with similar results. Right: counts of GAD1+, PVALB+, NOG+ cells across layers (expressed as percentage of total triple positive cells). Bars show the mean, error bars the standard deviation, and dots the data points for individual specimens (n=3 subjects). Violin plot shows gene expression distributions across clusters in the PVALB subclass (n=802 nuclei) for the chandelier cell marker UNC5B and the Inh L2−5 PVALB SCUBE3 cluster markers NOG and COL15A1. Rows are genes, black dots correspond to median expression, and maximum expression (CPM) is listed on the far right. Expression values are on a linear scale. e, Inverted DAPI-stained cortical column illustrating laminar positions of cells labeled with interneuron class markers. Green dots mark GAD1+/Gad1+, ADARB2+/Adarb2+, and LHX6−/Lhx6− (i.e. ADARB2 branch interneurons) cells; blue dots mark GAD1+/Gad1+, ADARB2−/adarb2−, and LHX6+/Lhx6+ (i.e. LHX6 branch interneurons) cells; pink dots mark GAD1+/Gad1+, ADARB2+/Adarb2+, LHX6+/Lhx6+ (i.e. Inh L2-6 LAMP5 CA1 cells in human or Lamp5 Lhx6 cells in mouse) cells. f, Representative images of cells labeled with the GAD1, ADARB2, and LHX6 gene panel for human (top) and mouse (bottom). Left to right: cells double positive for GAD1 and ADARB2; cells double positive for GAD1 and LHX6; GAD1, ADARB2, and LHX6 triple positive cells. Scale bars, 15 μm (human), 10 μm (mouse). Experiments were repeated on 3 donors and 3 mice with similar results.
Extended Data Figure 11.
Extended Data Figure 11.. Aligning single nucleus and single cell RNA-seq data from human and mouse cortex.
a, Heatmap of Pearson’s correlations between average MetaNeighbor AUROC scores (n=384 gene sets) for three broad classes of human and mouse cortical cell types. Rows and columns are ordered by average-linkage hierarchical clustering. b, Human (blue; n=3,594 nuclei) and mouse (orange; n=6,595 cells) inhibitory neurons projected on the first two principal components of a PCA combining expression data from both species. Almost 20% of expression differences are explained by species, while 6% are explained by major classes of interneurons. c, Number of highly differentially expressed (>10-fold change) genes (out of 14,551 orthologous genes) between homologous cell types matched between species (n = 37 types), mouse cortical area (n = 103 types), and sample type (n = 11 types). Boxplots show median, interquartile interval, range, and outlier values. d, Schematic of scAlign analysis to align RNA-seq data from human nuclei and mouse cells. e, t-SNE plots of human (blue; n=3,503 nuclei) and mouse (orange; n=4,127 cells) excitatory neurons after alignment with scAlign and colored by species and cluster. Arrow highlights two human nuclei that cluster with the mouse-specific (M) L5 PT Chrna6 cluster. f, t-SNE plots of human (blue; n=670 nuclei) and mouse (orange; n=671 cells) non-neuronal cells colored by species and cluster. g, t-SNE plots of human (blue; n=3,594 nuclei) and mouse (orange; n=6,595 cells) inhibitory neurons after alignment with scAlign (as in Fig. 5c) and Seurat and colored by species. h, Consistently higher accuracy and alignment of inhibitory neurons using scAlign versus Seurat with several neural network architectures and parameter settings. Boxplots show median and interquartile interval of values.
Extended Data Figure 12.
Extended Data Figure 12.. Quantifying human and mouse cell type homology and comparing cell type frequencies between species.
a-d, Heatmaps with inferred cell type homologies highlighted in blue boxes. For each pair of clusters, the shade of grey indicates the minimum proportion of samples that co-cluster. Homologies for human and mouse inhibitory neurons (a), excitatory neurons (b), and non-neuronal cells (c) were predicted based on shared cluster membership using mouse cells from two cortical areas (V1 and ALM) and two unsupervised alignment algorithms (scAlign and Seurat). d, Mouse V1 and mouse ALM excitatory neurons were aligned with scAlign. Blue boxes indicate V1 and ALM clusters that align to the same human clusters in b and are members of homologous cell types. Note that cell types can be matched at higher resolution within than between species, as expected. e, Left to right: violin plot (n=10,525 nuclei) showing expression of specific markers of the putative extratelencephalic (ET) EXC L4-5 FEZF2 SCN4B cluster (black box) and NPTX1, a gene expressed by all non-PT excitatory neurons. Each row represents a gene, the black dots in each violin represent median gene expression within clusters, and the maximum expression value for each gene is shown on the right-hand side of each row. Expression values are shown on a linear scale. Representative inverted DAPI-stained cortical column (scale bar, 200 μm) with red dots marking the position of cells positive for the genes SLC17A7 and FAM84B and negative for NPTX1 illustrates the relative abundance of the EXC L4-5 FEZF2 SCN4B type in human MTG. Representative examples (arrows) of FAM84B (scale bar, 25 μm) and POU3F1-expressing cells (scale bar, 25 μm). Expression of Fam84b in mouse TEa (scale bar, 75 μm) is shown in the adjacent panel. panel. f, mFISH for NPTX1, a marker of non-PT excitatory types and SLC17A7, shows that NPTX1 labels most SLC17A7+ cells across all cortical layers. Boxed region Boxed region shown at higher the magnification to the right. One SLC17A7+ cell (white arrow) cell (white arrow) is NPTX1−, but all other all other SLC17A7+ cells are NPTX1+. Scale bars, left (200 μm), right (50 μm). Right: representative inverted DAPI-stained cortical column with red dots that represent SLC17A7+, NPTX1−, and POU3F1+ cells. Scale bar, 200 μm. e, f, Experiments were repeated on 3 donors (human) and 2 mice with similar results. g, ISH validation of layer distributions in human MTG and mouse primary visual cortex (data from Tasic et al.). Cells are labeled by cluster marker genes in human (RORB+/CNR1−/PRSS12+) and mouse (Scnn1a+/Hsd11b1+). ISH was performed on 3 human donors with similar results. For mouse, 1 experiment was performed.
Extended Data Figure 13.
Extended Data Figure 13.. Marker genes with relatively conserved expression in homologous cell types between human and mouse.
Expression heatmaps of homologous cell type markers in human cortical nuclei and mouse cortical cells. Rows: Median expression based on intronic and exonic reads and log-transformed (log10CPM + 1). Values listed on the right side of each heatmap indicate the maximum expression level (CPM) for each gene. Columns: Single nuclei (human) or cells (mouse) grouped by homologous types identified in this study. For each homologous type, up to 10 marker genes were identified based on relatively specific expression (median CPM > 1 in six or fewer clusters and ordered by tau score) in both species. Note that many more genes support individual homologies but may not be cell type specific markers.
Figure 1.
Figure 1.. Cell type taxonomy in human middle temporal gyrus (MTG).
a, Schematic of RNA-sequencing of neuronal (NeuN+) and non-neuronal (NeuN-) nuclei isolated from human MTG. Human brain atlas image from http://human.brain-map.org/ b, t-SNE visualization of 15,928 nuclei grouped by expression similarity and colored by cluster, donor, and dissected layer. c, Taxonomy of 69 neuronal and 6 non-neuronal cell types based on median cluster expression. Branches are labeled with major cell classes. Cluster sizes and estimated laminar distributions (white, low; red, high) are shown below. d, Median log-transformed expression of marker genes (blue, non-coding) across clusters with maximum expression (CPM) on the right.
Figure 2.
Figure 2.. Excitatory neuron diversity and marker gene expression.
a, Estimated layer distributions of cell types based on dissected layer of nuclei (dots). Layer 1 dissections included some excitatory neurons from layer 2. b, Violin plots of marker gene (blue, non-coding) expression distributions across clusters (n=10,525 nuclei). Rows are genes, black dots are median expression, and maximum expression (CPM) is on the right. c, Representative inverted images of DAPI-stained cortical columns with cells (red dots) in each cluster (red bars in a) identified using listed marker genes. Experiments repeated on ≥2 donors per cell type. Scale bar, 250 μm. Bar plots summarize layer distributions for at least n=2 donors per cell type. d, t-SNE maps of superficial excitatory neurons with nuclei in the Exc L2-3 LINC00507 FREM3 cluster (n=2,284) colored by dissected layer and expression of PDGFD, LAMP5, and COL5A2. e, Single molecule fluorescent in situ hybridization (smFISH) quantification of LAMP5 and COL5A2 expression.
Figure 3.
Figure 3.. Inhibitory neuron diversity and layer distribution.
a, b Layer distributions of cell types estimated based on dissected layer of nuclei (n=4,164) (dots) and validated in situ for three clusters (red bars, Extended Data Fig. 10a, b). c, d Violin plots of marker gene (blue, non-coding) expression distributions across clusters (c, n=2,320 nuclei; d, n=1,844 nuclei). Rows are genes, black dots are median expression, and maximum expression (CPM) is on the right. e, Relative proportions and layer distributions of interneuron classes in human MTG and mouse temporal association area (TEa) quantified by in situ labeling of marker genes with mFISH. Bars show the mean, error bars the standard deviation, and circles represent n=3 specimens for human and mouse. Two-tailed t-test with Holm-Sidak correction for multiple comparisons, df=20, *p<0.05 **p<0.01, ***p<0.001.
Figure 4.
Figure 4.. Non-neuronal cell type diversity and marker gene expression.
a, Layer distributions of cell types estimated based on dissected layer of nuclei (n=914) (dots). b, Violin plots of marker gene (blue, non-coding) expression distributions across clusters. Rows are genes, black dots are median expression, and maximum expression (CPM) is listed on the far right. c, Immunohistochemistry (IHC) for GFAP demonstrates morphologically-defined human astrocyte types. Boxed regions shown at higher magnification on the right. Scale bars: low magnification (250 μm), high magnification (50 μm). d, Heatmap of marker gene expression with nuclei (columns) ordered by dissected layer. Several nuclei in deep layers (black box) express distinct markers. e, mFISH and immunohistochemistry of astrocyte subtype markers highlighted (red boxes) in b, d. Experiments repeated on n=2 human donors. Left: Cells with high expression of AQP4 and GFAP in layer 1 (white arrowheads). Scale bar, 25 μm. Right: Top row: Cell in layer 1 co-expresses AQP4 and ID3 and has long, GFAP-labeled processes. Middle row: Protoplasmic astrocyte in layer 3 lacks expression of ID3. Bottom row: Fibrous astrocyte at the white matter (WM)-layer 6 boundary expresses AQP4, ID3, and GFAP protein. Asterisks mark lipofuscin. Boxed areas are magnified to the right. Scale bars: low magnification (25 μm), high magnification (15 μm).
Figure 5.
Figure 5.. Evolutionary conservation of cell types between human and mouse.
a, Similar functional gene families (n=384 gene sets) discriminate inhibitory neuron types in human and mouse. Error bars correspond to the SD of mean MetaNeighbor AUROC scores across 10 sub-samples of cells. b, Schematic of unsupervised alignment and clustering of combined human and mouse cortical samples using scAlign or Seurat. c, t-SNE visualization of human (n=3,594 nuclei) and mouse (n=6595 cells) inhibitory neuron clusters after alignment with scAlign. d-e, Human and mouse cell type homologies for inhibitory neurons (d) and excitatory neurons from mouse V1 (e) predicted based on shared cluster membership. Grey shade corresponds to the minimum proportion of human nuclei or mouse cells that co-cluster. Rows are human clusters and columns are mouse clusters. Homologous clusters were labeled based on human and mouse cluster membership and include excitatory neuron projection targets (IT, intratelencephalic; ET, extratelencephalic/pyramidal tract; NP, near-projecting; CT, corticothalamic). Known morphologies indicated for mouse inhibitory types. f, Taxonomy of 32 neuronal and 5 non-neuronal homologous cell types and cell classes. Asterisks mark one-to-one matches.
Figure 6.
Figure 6.. Divergent cell type expression between human and mouse.
a, Comparison of expression levels of 14,553 orthologous genes between human and mouse for Sst Chodl and OPCs. Genes outside the blue lines have highly divergent expression (>10-fold change) and include cluster specific markers (orange dots). Benjamini & Hochberg Pearson correlation (r). b, Patterns of expression change between human and mouse for 9748 divergent genes (67% of orthologous genes). Groups of genes with similar patterns are labeled by the affected cell class. Top row: number of genes with expression divergence restricted to each broad class of cell types. c, Distribution of scores (Methods) that measures the magnitude of expression change across homologous cell types for all genes (dark blue) and housekeeping genes (light blue). d, Gene families (n > 10 genes) with the most divergent expression patterns (highest score) include neurotransmitter receptors, ion channels, and cell adhesion molecules. e, Expression (trimmed average CPM) of most serotonin receptors has changed in homologous cell types. Scores listed on far right. f, g, ISH of divergent genes show shifts in laminar expression consistent with different cell type expression in human and mouse. Red bars show layers with enriched expression. Scale bars: human (250 μm), mouse (100 μm).

Comment in

  • A recipe book for cell types in the human brain.
    Keefe MG, Nowakowski TJ. Keefe MG, et al. Nature. 2019 Sep;573(7772):36-37. doi: 10.1038/d41586-019-02343-8. Nature. 2019. PMID: 31481767 No abstract available.
  • Delving into diversity.
    Lewis S. Lewis S. Nat Rev Neurosci. 2019 Nov;20(11):646-647. doi: 10.1038/s41583-019-0228-z. Nat Rev Neurosci. 2019. PMID: 31548715 No abstract available.
  • Species-specific cortex features.
    Weber C. Weber C. Nat Cell Biol. 2021 Nov;23(11):1108. doi: 10.1038/s41556-021-00777-9. Nat Cell Biol. 2021. PMID: 34750576 No abstract available.

References

    1. Glasser MF et al. A multi-modal parcellation of human cerebral cortex. Nature 536, 171–178 (2016). - PMC - PubMed
    1. Azevedo FAC et al. Equal numbers of neuronal and nonneuronal cells make the human brain an isometrically scaled-up primate brain. The Journal of Comparative Neurology 513, 532–541 (2009). - PubMed
    1. Herculano-Houzel S, Mota B & Lent R Cellular scaling rules for rodent brains. Proc Natl Acad Sci U S A 103, 12138–43 (2006). - PMC - PubMed
    1. DeFelipe J The evolution of the brain, the human nature of cortical circuits, and intellectual creativity. Front Neuroanat 5, 29 (2011). - PMC - PubMed
    1. Poorthuis RB et al. Rapid neuromodulation of layer 1 interneurons in human neocortex. Cell Rep 23, 951–958 (2018). - PMC - PubMed

Methods References

    1. DeFelipe J, Alonso-Nanclares L & Arellano JI Microstructure of the neocortex: comparative aspects. J Neurocytol 31, 299–316 (2002). - PubMed
    1. Aronesty E Comparison of sequencing utility programs. The Open Bioinformatics Journal 7, 1–8 (2013).
    1. Dobin A et al. STAR: ultrafast universal RNA-seq aligner. Bioinformatics 29, 15–21 (2012). - PMC - PubMed
    1. Lawrence M et al. Software for computing and annotating genomic ranges. PLoS Computational Biology 9, e1003118 (2013). - PMC - PubMed
    1. Calvo SE, Clauser KR & Mootha VK MitoCarta2.0: an updated inventory of mammalian mitochondrial proteins. Nucleic Acids Res 44, D1251–7 (2016). - PMC - PubMed

Publication types

MeSH terms