Review
. 2020 Mar 21;41(12):1286-1297.
doi: 10.1093/eurheartj/ehz552.

Invasive left ventricle pressure-volume analysis: overview and practical clinical implications

Affiliations
Review

Invasive left ventricle pressure-volume analysis: overview and practical clinical implications

Marcelo B Bastos et al. Eur Heart J. .

Abstract

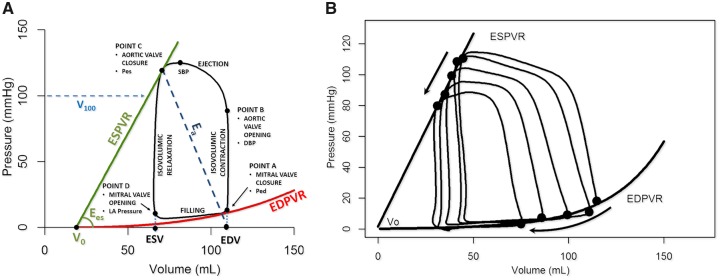
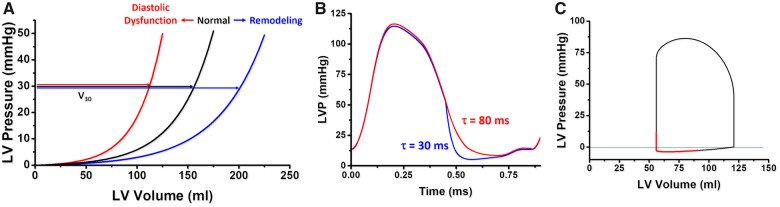
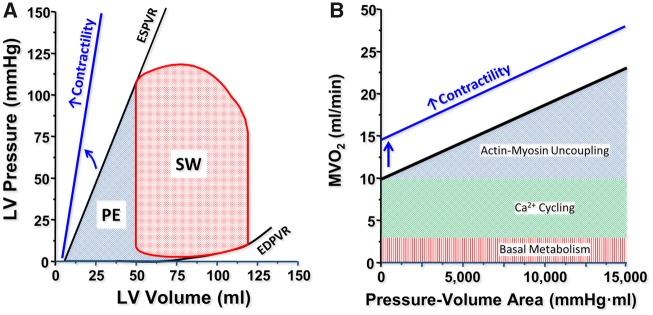
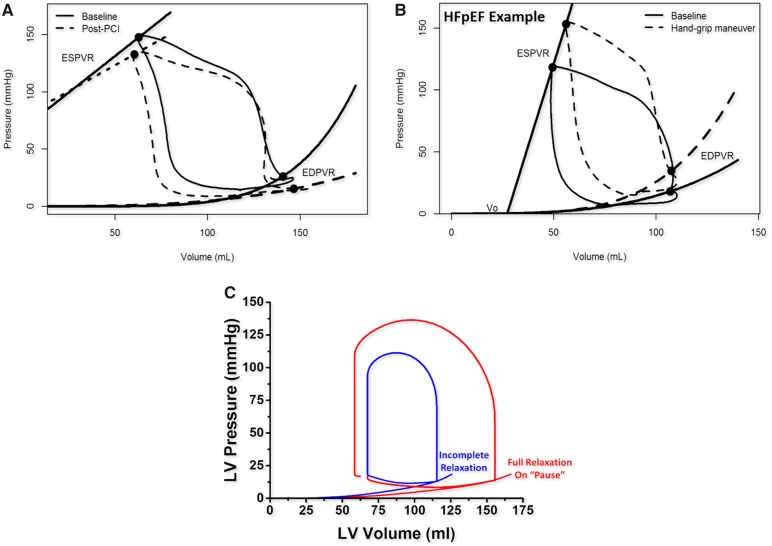
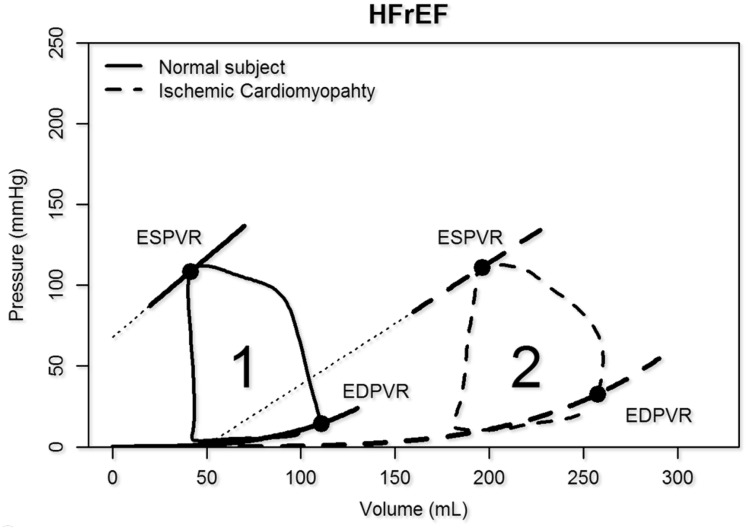
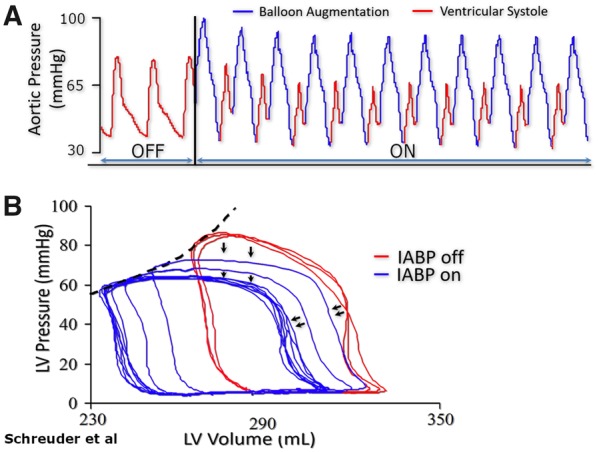
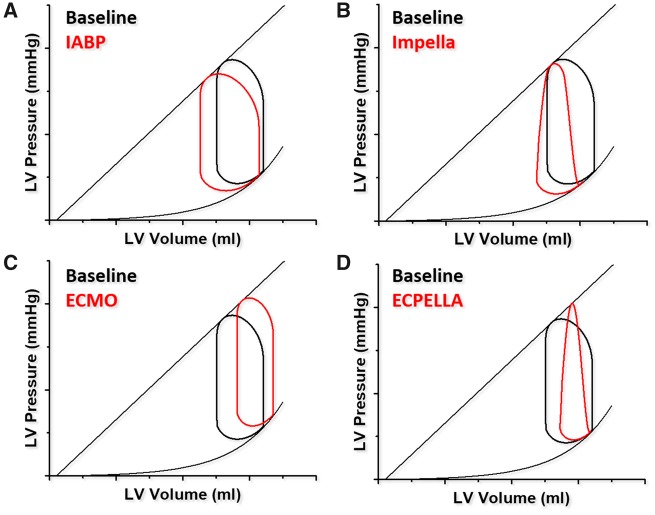
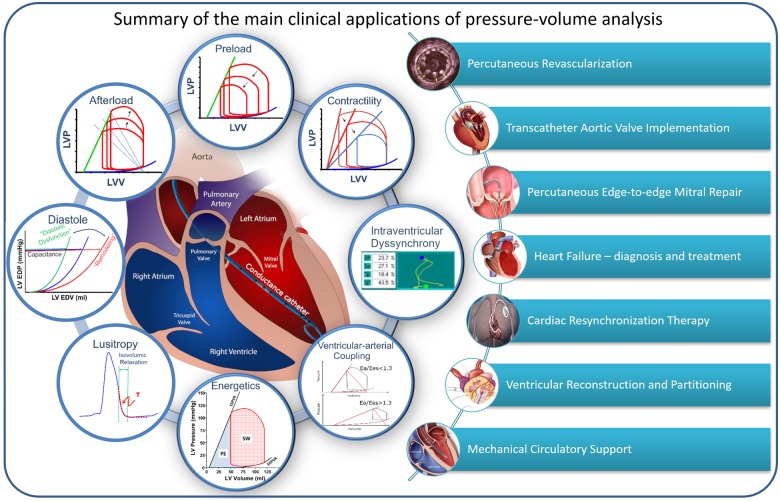
Ventricular pressure-volume (PV) analysis is the reference method for the study of cardiac mechanics. Advances in calibration algorithms and measuring techniques brought new perspectives for its application in different research and clinical settings. Simultaneous PV measurement in the heart chambers offers unique insights into mechanical cardiac efficiency. Beat to beat invasive PV monitoring can be instrumental in the understanding and management of heart failure, valvular heart disease, and mechanical cardiac support. This review focuses on intra cardiac left ventricular PV analysis principles, interpretation of signals, and potential clinical applications.

Keywords: Left ventricular haemodynamics; Myocardial energetics; Pressure-volume loop.


Figures

Figure 1
Figure 1
The conductance catheter principle. Ventricular positioning of the pressure–volume catheter with segmental pressure–volume loops from apex (segment 1) to basis (segment 7). Segments 1 to 6 have an upright rectangular shape with time progressing in counter-clockwise manner. In contrast, segment 7 is partially in the aorta with a ‘figure-of-8’configuration. Accordingly, the calculation of total volume includes summation only of segments 1 through 6.
Figure 2
Figure 2
Essential principles of the left ventricular pressure–volume relationship. (A) DBP, diastolic blood pressure; Ea, effective arterial elastance; EDPVR, end-diastolic pressure–volume relationship; Ees, end-systolic elastance; ESPVR, end-systolic pressure–volume relationship; PE, potential energy; Ped, end-diastolic pressure; Pes, end-systolic pressure; SBP, systolic blood pressure; SW, stroke work; V0, volume at a Pes of 0 mmHg. Stroke volume (SV) is EDV − ESV. (B) Vena cava occlusion to change/reduce preload (arrow) and determine the end-systolic and end-diastolic relationships by linear regression.
Figure 3
Figure 3
End-diastolic pressure–volume relationship concepts. (A) V30 is the left ventricular (LV) volume at a pressure of 30 mmHg and reflects compliance. A shift to the left suggests diastolic dysfunction (red), to the right ventricular remodelling (blue). (B) In coronary ischaemia, impaired active relaxation delays the pressure decay (red) increasing τ in early diastole. (C) Early diastolic suction in a simulated pressure–volume loop.
Figure 4
Figure 4
Myocardial energetics. (A) The pressure–volume area (PVA) is the sum of stroke work (SW) and potential energy (PE). (B) Pressure–volume area correlates linearly with myocardial oxygen consumption per beat. The relation is shifted upwards by increased contractile (e.g. inotropic agents).
Figure 5
Figure 5
Mechanical dyssynchrony. Segmental and global pressure–volume (PV) loops before and after cardiac resynchronization therapy. Distorted segmental pressure–volume loops out of sync before cardiac resynchronization therapy and more in sync after cardiac resynchronization therapy.
Figure 6
Figure 6
Effects of chronic ischaemia and incomplete relaxation on the pressure–volume loop. (A) Effect of percutaneous coronary revascularization with more vertical isovolumetric contraction and flatter end-diastolic pressure–volume relationship (dashed line). (B) Heart failure with preserved ejection fraction with increased Pes, elevated end-diastolic pressure–volume relationship and decreased stroke volume after handgrip manoeuvre (dashed line). (C) Incomplete relaxation (blue) unmasked by the occurrence of full relaxation during the refractory pause following an ectopic beat (red).
Figure 7
Figure 7
Pressure–volume loops in mitral and aortic regurgitation. (A) Chronic mitral regurgitation: right shifting with flatter end-systolic pressure–volume relationship, absent isovolumetric contraction and increased global stroke volume. (B) Chronic aortic regurgitation: right shifting with flatter end-systolic pressure–volume relationship and blunted isovolumetric phases (contraction and relaxation).
Figure 8
Figure 8
Pressure–volume loops with transcatheter valve interventions. (A) Edge-to-edge repair corrects mitral regurgitation partially restoring isovolumetric contraction and relaxation, increasing afterload and end-systolic volume while decreasing stroke volume. (B) Transcatheter aortic valve implantation (TAVI) reduces afterload, increases stroke volume and reduces the pressure–volume area (hatched area). (C) Balloon aortic valvuloplasty decreases afterload. Note the reduced isovolumetric phases and early diastolic filling that suggest aortic regurgitation (dashed line).
Figure 9
Figure 9
Pressure–volume relationship before (blue) and after (red) transcatheter aortic valve implantation in a patient with moderate aortic stenosis and depressed left ventricular systolic function. Contractility increases and the left ventricular is unloaded as characterized by a left shift of the pressure–volume loop.
Figure 10
Figure 10
Heart failure with reduced ejection fraction (HFrEF). The pressure–volume diagram and the end-systolic pressure–volume relationship shift to the right while compliance is increased (remodelling).
Figure 11
Figure 11
(A) Immediate effect of intra-aortic balloon pumping in a patient with 14% ejection fraction. (B) Pressure waveform showing characteristic diastolic augmentation when support is initiated. (B) Corresponding pressure–volume loops showing left shift with reduction in systolic pressures, and increased stroke volume.
Figure 12
Figure 12
Pressure–volume effects of different mechanical circulatory support devices. (A) Intra-aortic balloon pump: left shifted and mildly increased stroke volume. (B) Impella: left shifted triangular loop with blunted isovolumetric phases. (C) Venous-arterial Extracorporeal Membrane Oxygenation (V-A ECMO): right shifted, increased afterload and reduced stroke volume. (D) Venous-arterial Extracorporeal Membrane Oxygenation vented by Impella (ECPELLA). Partial shift to the left with venting (in red) as compared to (C).
Take home figure
Take home figure
Fundamental concepts of pressure–volume analysis and an overview of (potential) clinical applications.
None

References

    1. Kuhtz-Buschbeck JP, Drake-Holland A, Noble MIM, Lohff B, Schaefer J.. Rediscovery of Otto Frank's contribution to science. J Mol Cell Cardiol 2018;119:96–103. - PubMed
    1. Suga H. Ventricular energetics. Physiol Rev 1990;70:247–277. - PubMed
    1. Baan J, van der Velde ET, Steendijk P.. Ventricular pressure-volume relations in vivo. Eur Heart J 1992;13 Suppl E:2–6. - PubMed
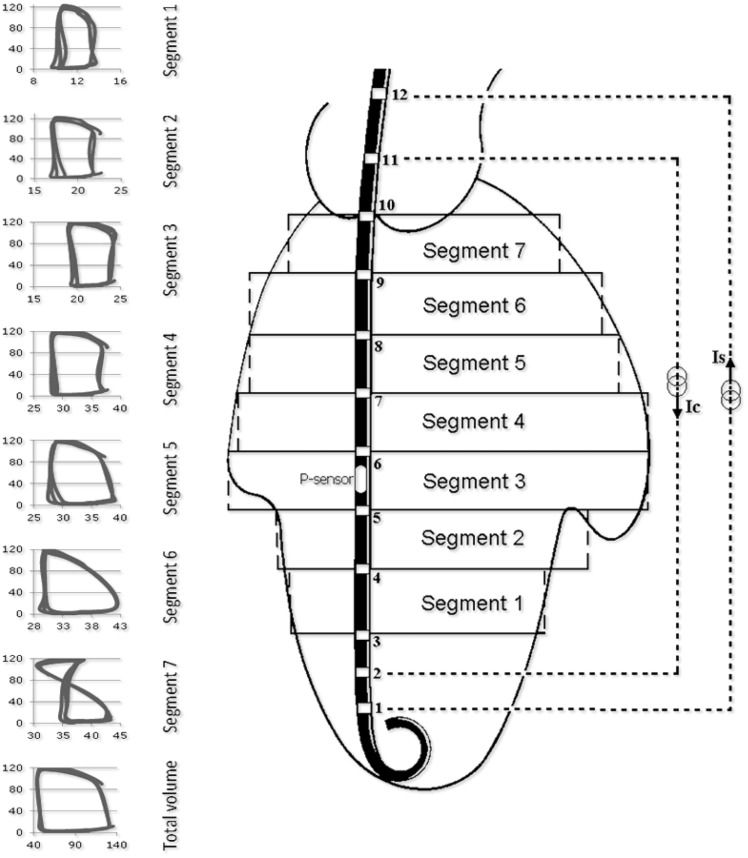
    1. van der Velde ET, van Dijk AD, Steendijk P, Diethelm L, Chagas T, Lipton MJ, Glanz SA, Baan J.. Left ventricular segmental volume by conductance catheter and Cine-CT. Eur Heart J 1992;13 Suppl E:15–21. - PubMed
    1. Steendijk P, Tulner SA, Schreuder JJ, Bax JJ, van Erven L, van der Wall EE, Dion RA, Schalij MJ, Baan J.. Quantification of left ventricular mechanical dyssynchrony by conductance catheter in heart failure patients. Am J Physiol Heart Circ Physiol 2004;286:H723–30. - PubMed

Publication types