

Structural connectivity profile supports laterality of the salience network
- PMID: 31436006
- PMCID: PMC6864895
- DOI: 10.1002/hbm.24769
Structural connectivity profile supports laterality of the salience network
Abstract
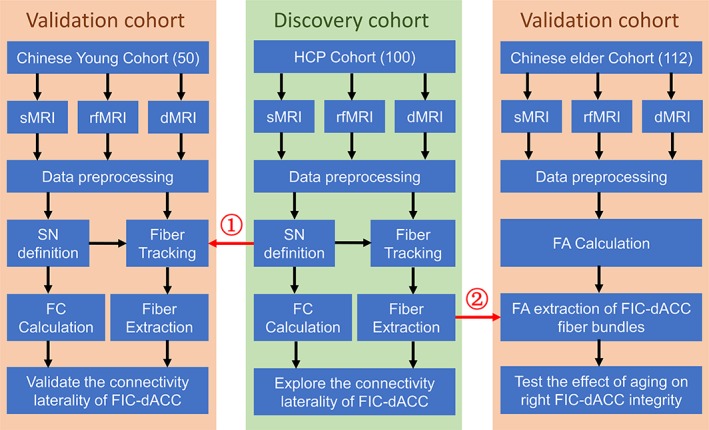
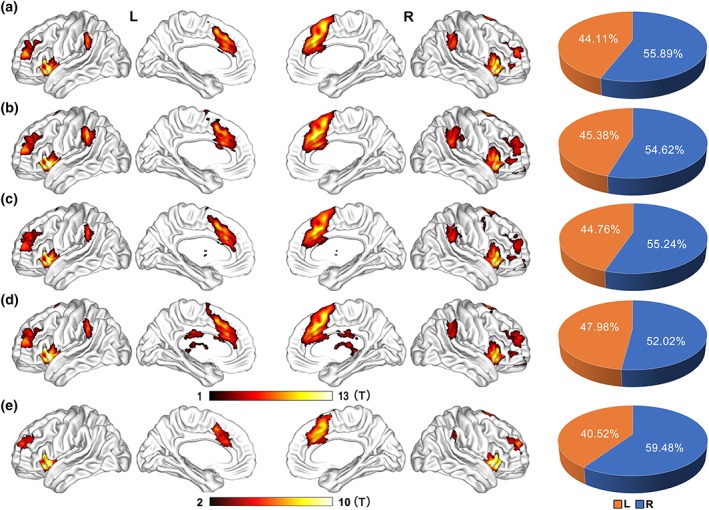
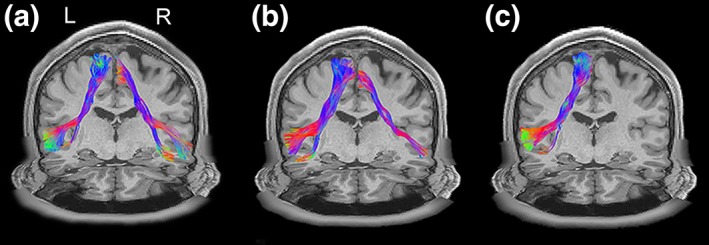
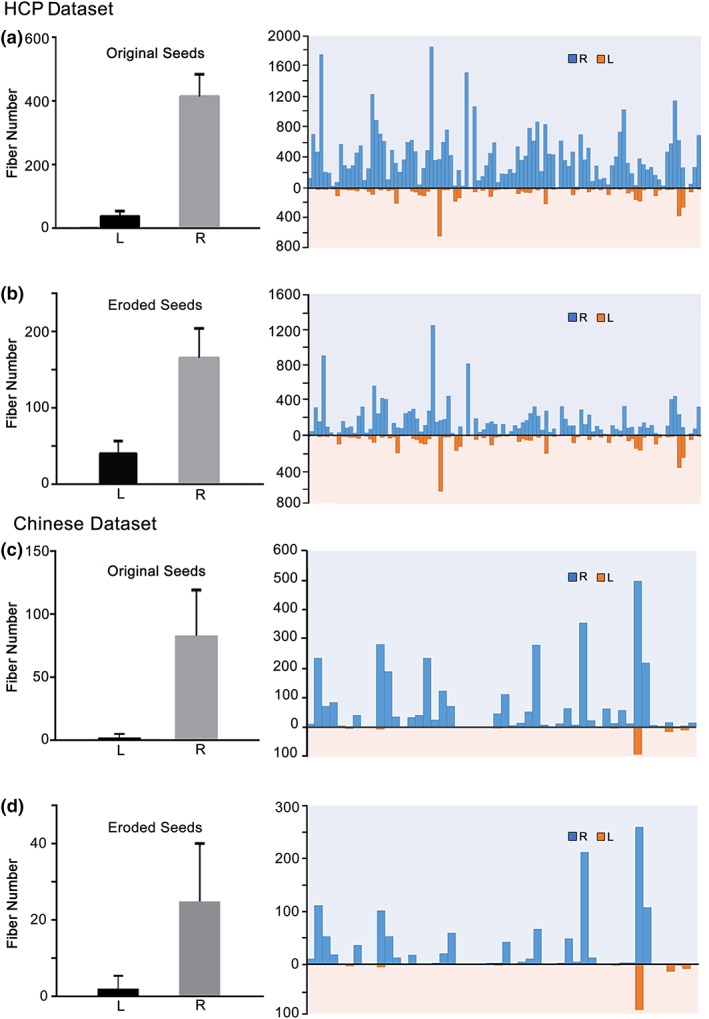
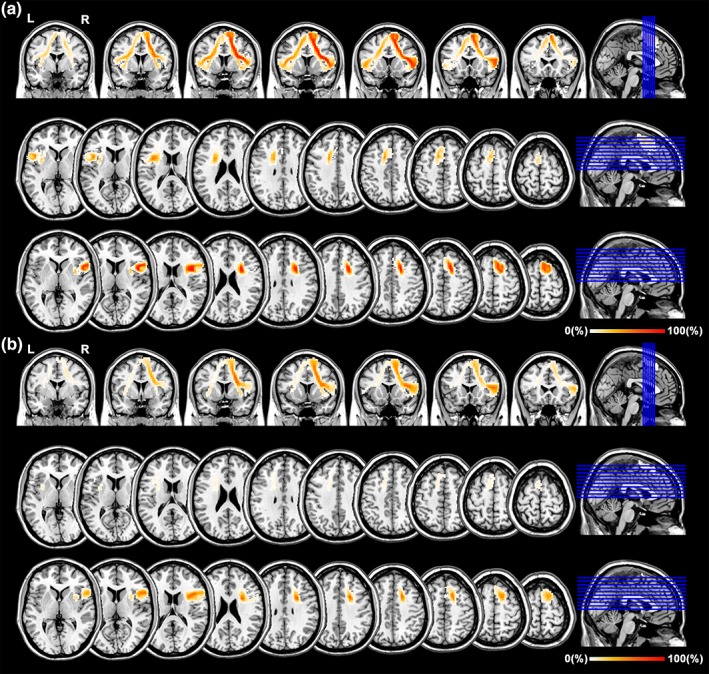
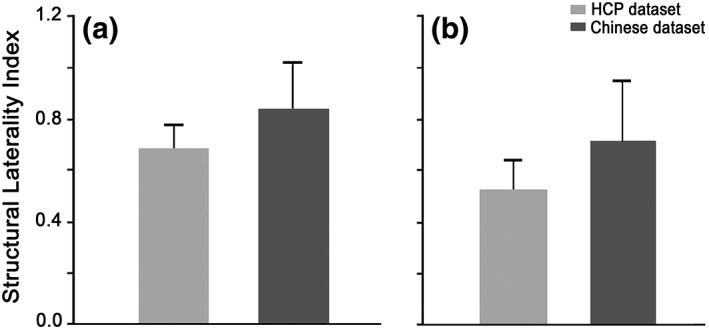
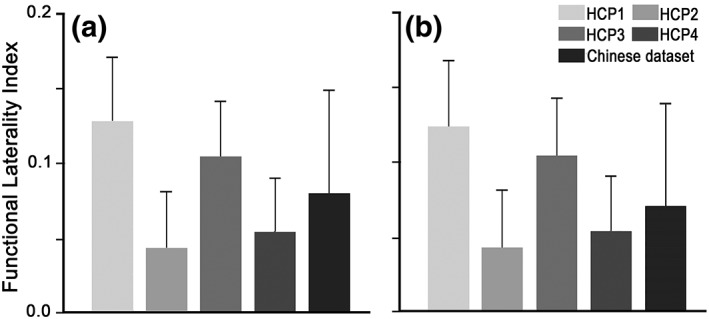
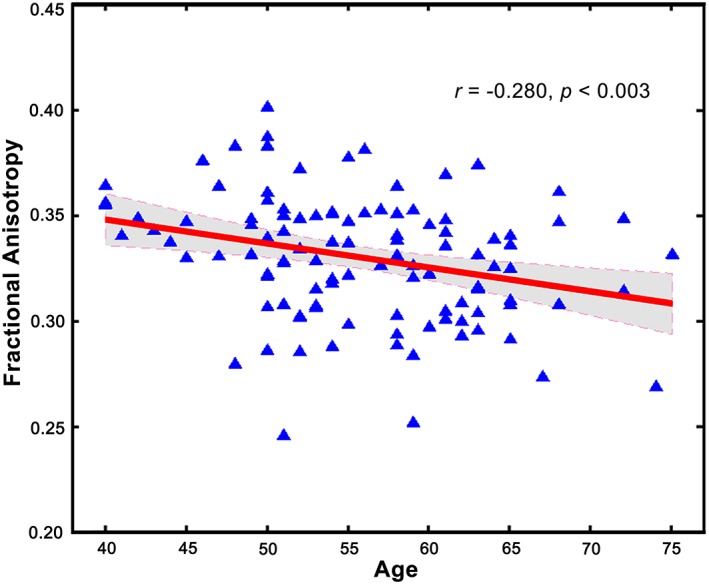
The salience network (SN) is mainly involved in detecting and filtering multimodal salient stimuli, and mediating the switch between the default mode network and central executive network. Early studies have indicated a right-sided dominance in the functional organization of the SN; however, the anatomical basis of the functional lateralization remains unclear. Here, we hypothesized that the structural connectivity profile between the frontoinsular cortex (FIC) and dorsal anterior cingulate cortex (dACC), which are two core hubs of the SN, is also dominant in the right hemisphere. Based on diffusion and resting-state functional magnetic resonance imaging (rfMRI) of adult healthy volunteers in independent datasets, we found a stable right-sided laterality of both the FIC-dACC structural and functional connectivity in both the human connectome project cohort and a local Chinese cohort. Furthermore, a significant effect of aging on the integrity of the right FIC-dACC structural connectivity was also identified. The right-sided laterality of the structural organization of the SN may help us to better understand the functional roles of the SN in the normal human brain.
Keywords: aging; diffusion magnetic resonance imaging; dorsal anterior cingulate cortex; frontal insula cortex; laterality; salience network; structural connectivity.
© 2019 The Authors. Human Brain Mapping published by Wiley Periodicals, Inc.
Conflict of interest statement
The authors declare no competing financial interests.
Figures
Similar articles
-
Lateralization in intrinsic functional connectivity of the temporoparietal junction with salience- and attention-related brain networks.J Neurophysiol. 2012 Dec;108(12):3382-92. doi: 10.1152/jn.00674.2012. Epub 2012 Sep 26. J Neurophysiol. 2012. PMID: 23019004
-
Salience network coupling is linked to both tobacco smoking and symptoms of attention deficit hyperactivity disorder (ADHD).Drug Alcohol Depend. 2018 Jan 1;182:93-97. doi: 10.1016/j.drugalcdep.2017.11.005. Epub 2017 Nov 21. Drug Alcohol Depend. 2018. PMID: 29175464 Free PMC article. Clinical Trial.
-
Alerted default mode: functional connectivity changes in the aftermath of social stress.Sci Rep. 2017 Jan 5;7:40180. doi: 10.1038/srep40180. Sci Rep. 2017. PMID: 28054651 Free PMC article.
-
Connecting Circuits with Networks in Addiction Neuroscience: A Salience Network Perspective.Int J Mol Sci. 2023 May 22;24(10):9083. doi: 10.3390/ijms24109083. Int J Mol Sci. 2023. PMID: 37240428 Free PMC article. Review.
-
Nonhuman primate meso-circuitry data: a translational tool to understand brain networks across species.Brain Struct Funct. 2021 Jan;226(1):1-11. doi: 10.1007/s00429-020-02133-3. Epub 2020 Oct 30. Brain Struct Funct. 2021. PMID: 33128126 Review.
Cited by
-
Structural and functional connectivity associations with anterior cingulate sulcal variability.Res Sq [Preprint]. 2024 Jan 5:rs.3.rs-3831519. doi: 10.21203/rs.3.rs-3831519/v1. Res Sq. 2024. Update in: Brain Struct Funct. 2024 Sep;229(7):1561-1576. doi: 10.1007/s00429-024-02812-5. PMID: 38260469 Free PMC article. Updated. Preprint.
-
Role of amygdala in stress-induced upregulation of airway IL-1 signaling in asthma.Biol Psychol. 2022 Jan;167:108226. doi: 10.1016/j.biopsycho.2021.108226. Epub 2021 Nov 17. Biol Psychol. 2022. PMID: 34800561 Free PMC article.
-
Prefrontal connectomics: from anatomy to human imaging.Neuropsychopharmacology. 2022 Jan;47(1):20-40. doi: 10.1038/s41386-021-01156-6. Epub 2021 Sep 28. Neuropsychopharmacology. 2022. PMID: 34584210 Free PMC article. Review.
-
Front and center: Maturational dysregulation of frontal lobe functional neuroanatomic connections in attention deficit hyperactivity disorder.Front Neuroanat. 2022 Aug 23;16:936025. doi: 10.3389/fnana.2022.936025. eCollection 2022. Front Neuroanat. 2022. PMID: 36081853 Free PMC article.
-
Self-reference Network-Related Interactions During the Process of Cognitive Impairment in the Early Stages of Alzheimer's Disease.Front Aging Neurosci. 2021 Mar 24;13:666437. doi: 10.3389/fnagi.2021.666437. eCollection 2021. Front Aging Neurosci. 2021. PMID: 33841130 Free PMC article.
References
-
- Allman, J. M. , Tetreault, N. A. , Hakeem, A. Y. , Manaye, K. F. , Semendeferi, K. , Erwin, J. M. , … Hof, P. R. (2010). The von Economo neurons in frontoinsular and anterior cingulate cortex in great apes and humans. Brain Structure & Function, 214(5–6), 495–517. - PubMed
-
- Allman, J. M. , Watson, K. K. , Tetreault, N. A. , & Hakeem, A. Y. (2005). Intuition and autism: A possible role for Von Economo neurons. Trends in Cognitive Sciences, 9(8), 367–373. - PubMed
-
- Ashburner, J. (2007). A fast diffeomorphic image registration algorithm. NeuroImage, 38(1), 95–113. - PubMed
-
- Bargmann, C. I. , & Marder, E. (2013). From the connectome to brain function. Nature Methods, 10(6), 483–490. - PubMed
-
- Basser, P. J. , Pajevic, S. , Pierpaoli, C. , Duda, J. , & Aldroubi, A. (2000). In vivo fiber tractography using DT‐MRI data. Magnetic Resonance in Medicine, 44(4), 625–632. - PubMed
Publication types
MeSH terms
Grants and funding
- 2017M611175/China Postdoctoral Science Foundation/International
- 2017YFC0909201/National Key Research and Development Program of China/International
- 2018YFC1314300/National Key Research and Development Program of China/International
- 81425013/National Natural Science Foundation of China/International
- 81571659/National Natural Science Foundation of China/International
LinkOut - more resources
Full Text Sources
Medical
