

A single-cell transcriptome atlas of the adult human retina
- PMID: 31436334
- PMCID: PMC6745503
- DOI: 10.15252/embj.2018100811
A single-cell transcriptome atlas of the adult human retina
Abstract
The retina is a specialized neural tissue that senses light and initiates image processing. Although the functional organization of specific retina cells has been well studied, the molecular profile of many cell types remains unclear in humans. To comprehensively profile the human retina, we performed single-cell RNA sequencing on 20,009 cells from three donors and compiled a reference transcriptome atlas. Using unsupervised clustering analysis, we identified 18 transcriptionally distinct cell populations representing all known neural retinal cells: rod photoreceptors, cone photoreceptors, Müller glia, bipolar cells, amacrine cells, retinal ganglion cells, horizontal cells, astrocytes, and microglia. Our data captured molecular profiles for healthy and putative early degenerating rod photoreceptors, and revealed the loss of MALAT1 expression with longer post-mortem time, which potentially suggested a novel role of MALAT1 in rod photoreceptor degeneration. We have demonstrated the use of this retina transcriptome atlas to benchmark pluripotent stem cell-derived cone photoreceptors and an adult Müller glia cell line. This work provides an important reference with unprecedented insights into the transcriptional landscape of human retinal cells, which is fundamental to understanding retinal biology and disease.
Keywords: photoreceptor subtypes; retina; single-cell RNA sequencing; transcriptome.
© 2019 The Authors.
Conflict of interest statement
The authors declare that they have no conflict of interest.
Figures
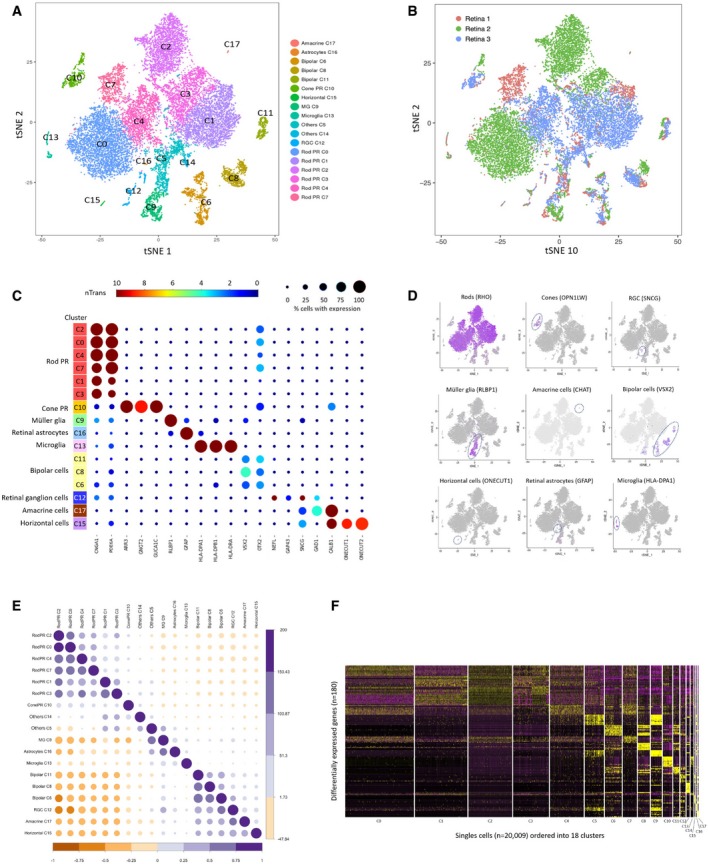
- A, B
t‐SNE visualization of 20,009 human retinal cells colored by (A) annotation of 18 transcriptionally distinct clusters (C0‐C17) and (B) their distribution in three donor retina samples.
- C
Feature expression heatmap showing expression patterns of major retinal class markers across 16 retinal cell clusters. The size of each circle depicts the percentage of cells expressing the marker within the cluster. Brown color indicates ≥ 10 nTrans (number of transcripts).
- D
t‐SNE plots showing expression of a set of selected marker genes for major retinal classes.
- E
Correlation matrix for the identified 18 clusters. The upper triangle depicts the z‐value for correlation, and the lower triangle depicts the correlation coefficient for gene expression in clusters.
- F
Heatmap of differentially expressed genes used to classify cell types for each cluster compared to all other clusters for the 18 retinal cell clusters. The rows correspond to the top 10 genes most selectively upregulated in individual clusters (P < 0.01, Benjamini–Hochberg correction), and the columns show individual cells ordered by cluster (C0‐C17).
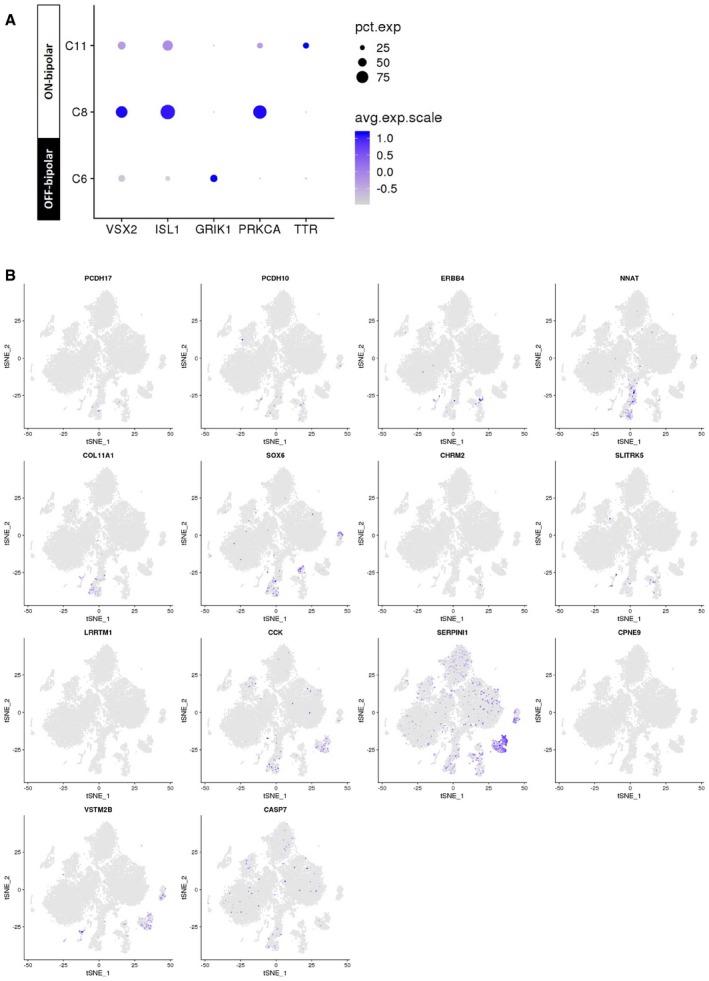
Feature expression heatmap of VSX2 (pan‐bipolar), ISL1 (ON‐bipolar), GRIK1 (OFF‐bipolar), PRKCA (rod bipolar cells), and TTR (DB4 bipolar).
t‐SNE plots showing gene expression for 14 new markers for individual bipolar subtypes identified in a previous mouse scRNA‐seq study (Shekhar et al, 2016).
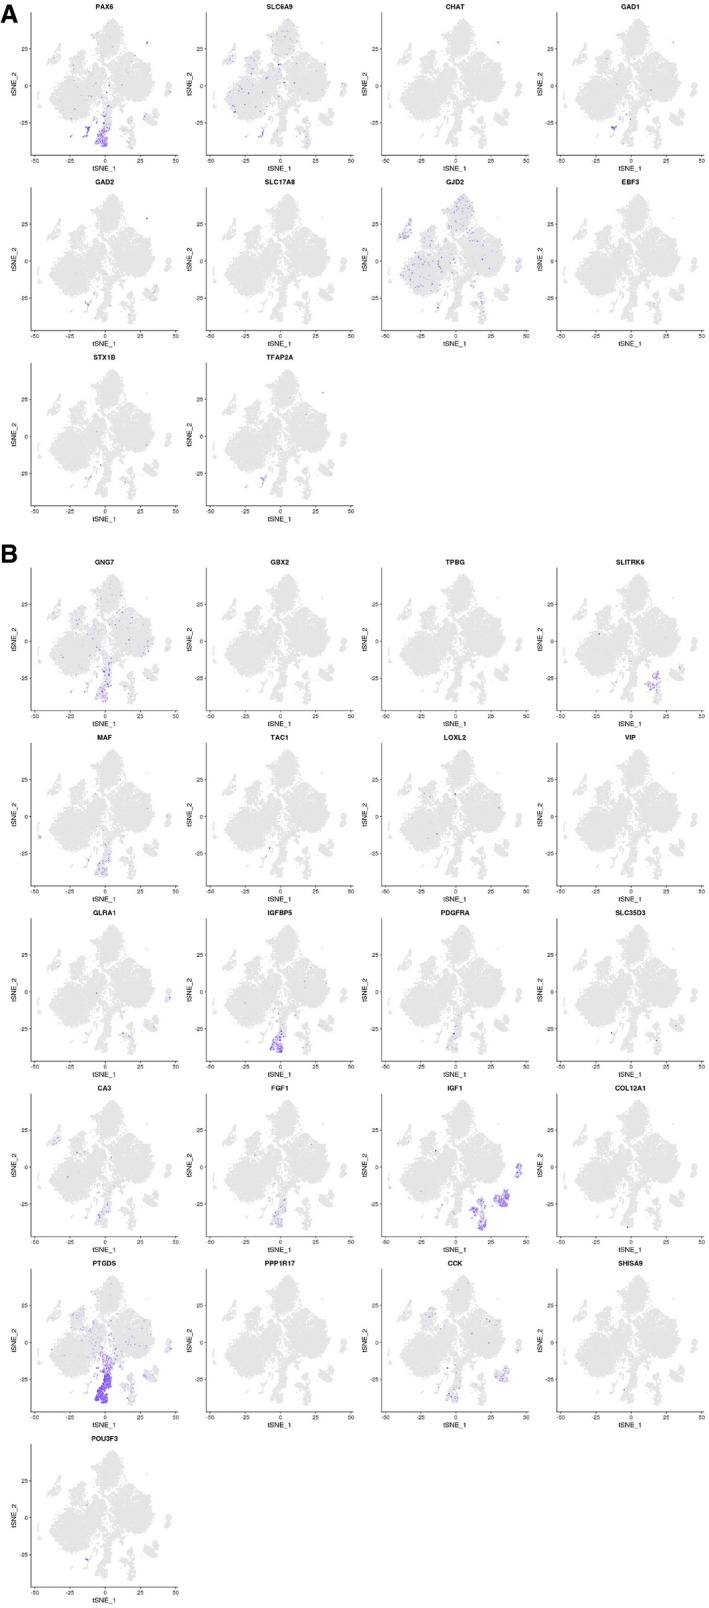
- A, B
t‐SNE plots showing gene expression in the compiled human retina transcriptome atlas (20,009 cells). (A) 10 commonly used amacrine markers and (B) new markers for amacrine subtypes identified in a previous mouse scRNA‐seq study (Macosko et al, 2015).
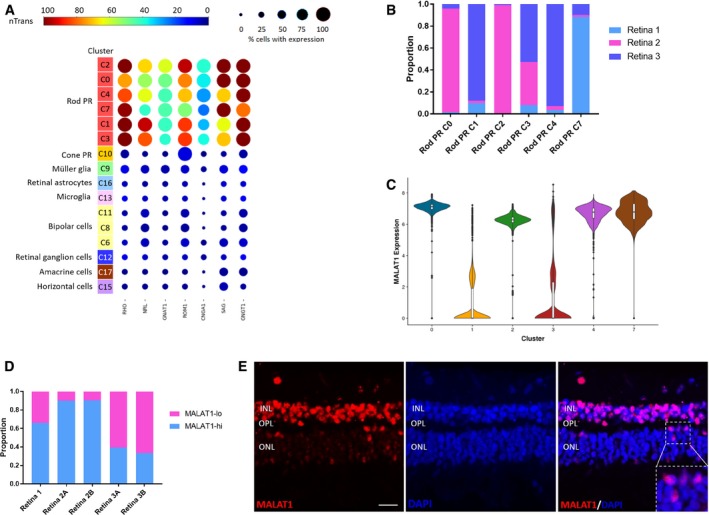
Feature expression heatmap of a panel of known marker genes for rod photoreceptors across the identified 16 retinal cell clusters. Brown color indicates ≥ 100 nTrans (number of transcripts).
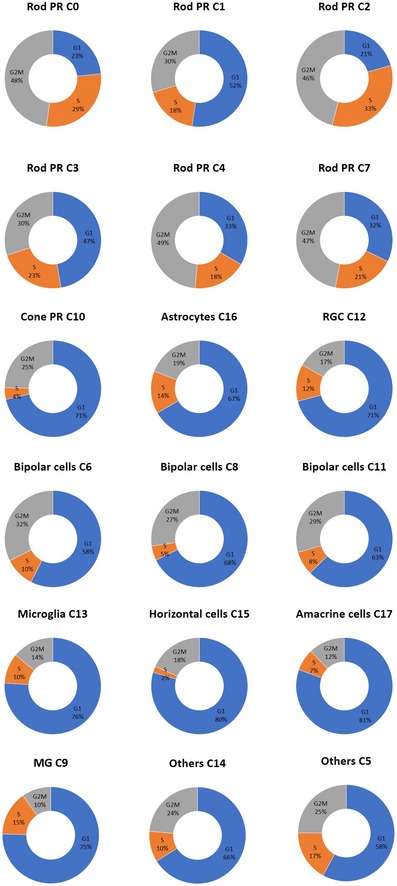
Representation of the three donor retina samples in the six rod photoreceptor clusters.
Violin plot showing high or low expression levels of MALAT1 in rod photoreceptor clusters.
Distribution of rod photoreceptor populations with high MALAT1 expression (MALAT1‐hi) or low MALAT1 expression (MALAT1‐lo) in three donor retina samples.
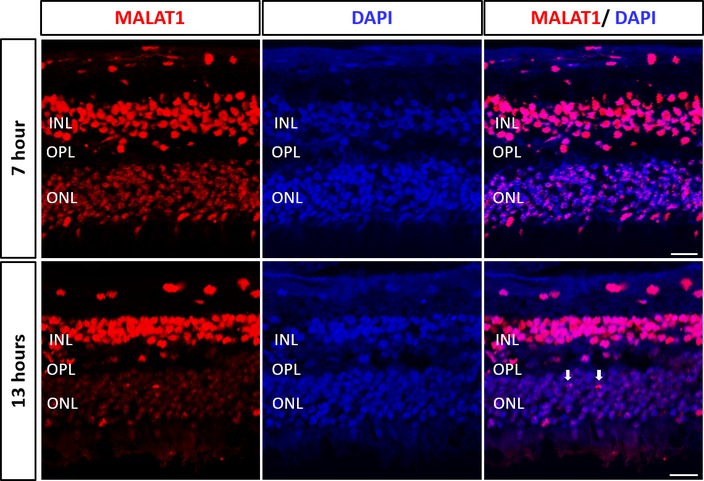
Fluorescent in situ hybridization analysis of human peripheral retina showing heterogeneous levels of MALAT1 expression in the rod photoreceptors located in the outer nuclear layer (ONL). INL, inner nuclear layer; OPL, outer plexiform layer. Scale bar = 20 μm.
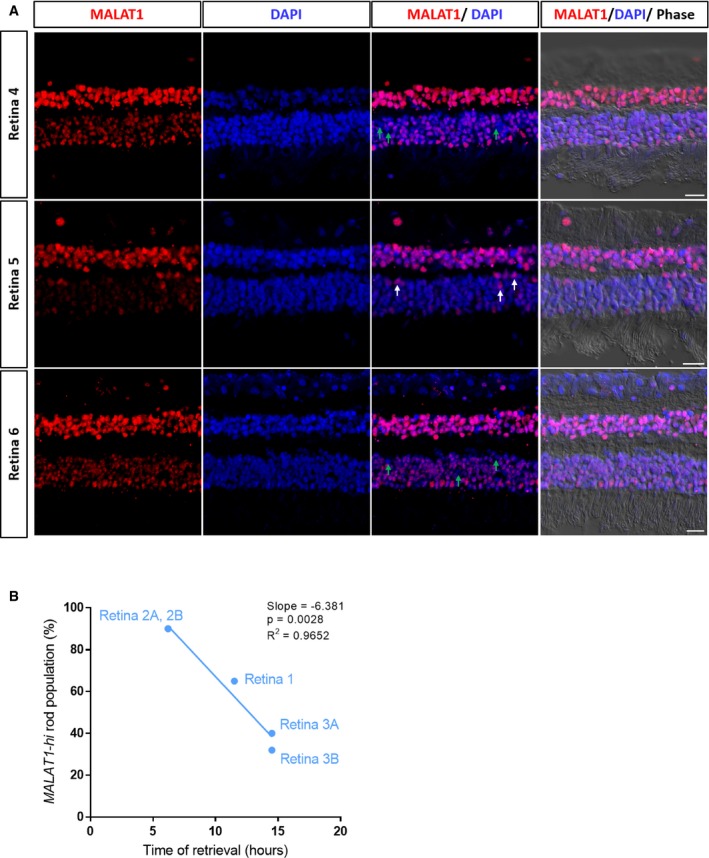
Fluorescent in situ hybridization showing expression of MALAT1 in three donor retina samples (Retina 4–6). Retina 5 from Fig 2E is also displayed here for easier comparison. Green arrows highlight rod photoreceptors with low levels of MALAT1 in Retina 4 and Retina 6, and white arrows highlight rod photoreceptors with high levels of MALAT1 in Retina 5. Scale bars = 20 μm.
Correlation of proportion of MALAT1‐hi rod populations with time of retina retrieval after death for Retina 1–3.
- A, B
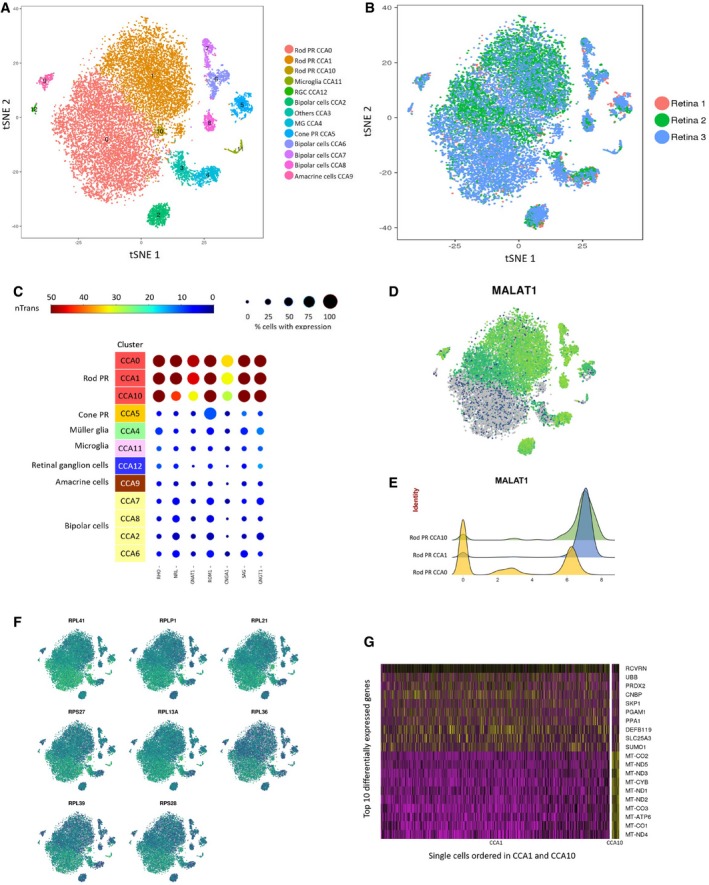
(A) t‐SNE visualization of human retinal cells colored by annotation of 13 transcriptionally distinct clusters (CCA0‐CCA12) and (B) their distribution in three donor retina samples.
- C
Feature expression heatmap showing expression patterns of seven rod photoreceptor markers across 12 retinal cell clusters. The size of each circle depicts the percentage of cells expressing the marker within the cluster. Brown color indicates ≥ 50 nTrans (number of transcripts).
- D
t‐SNE plots showing expression of MALAT1.
- E
Expression pattern of MALAT1 in the rod photoreceptor showing MALAT1‐hi (CCA1, CCA10) and MALAT1‐lo (CCA0) subpopulations. The x‐axis depicts normalized transcript levels.
- F
t‐SNE plots showing expression of major ribosomal genes.
- G
Heatmap of differentially expressed genes between the two MALAT1‐hi clusters CCA1 and CCA10. The rows correspond to top 10 genes most selectively upregulated in individual clusters (P < 0.01, Benjamini–Hochberg correction), and the columns show individual cells ordered in CCA1 and CCA10.
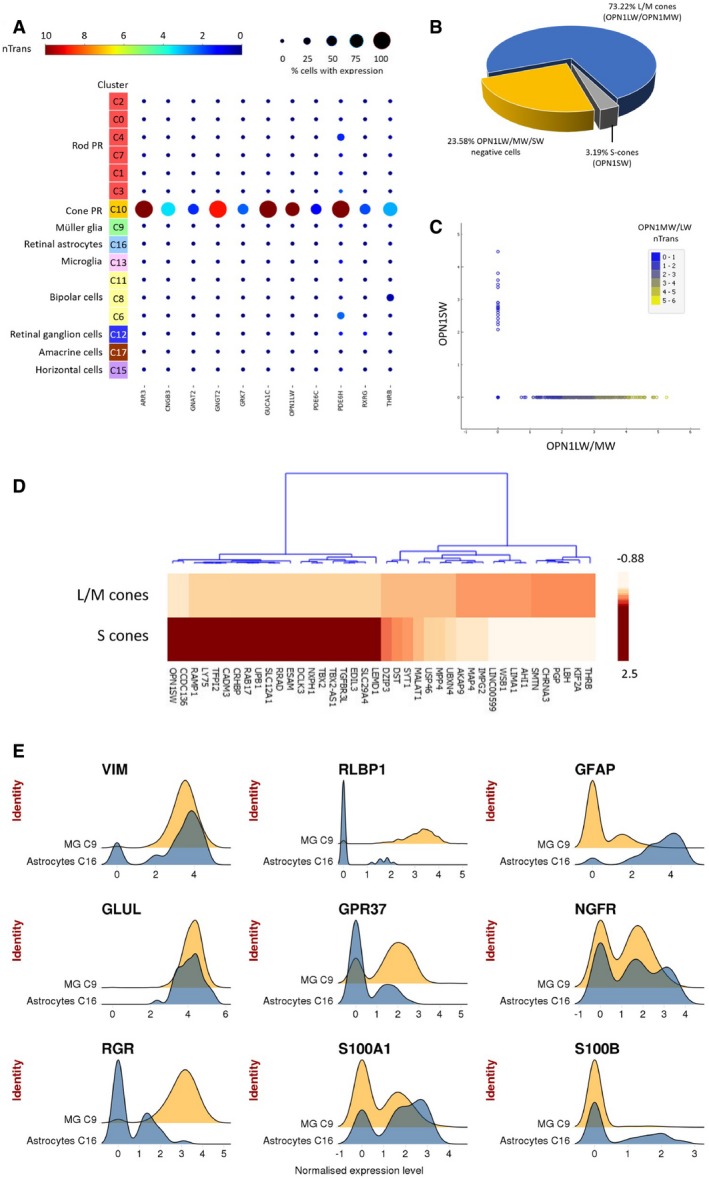
Feature expression heatmap showing the expression of 11 known cone photoreceptor markers across 16 retinal cell clusters. Brown color indicates ≥ 10 nTrans (number of transcripts).
The proportion of cone photoreceptor subtypes identified in population C10, based on expression of OPN1LW/OPN1MW (L/M‐cones) and OPN1SW (S‐cones).
Scatter plots showing expression of OPN1LW/OPN1MW or OPN1SW in individual cone photoreceptors for population C10. The color depicts expression level for OPN1LW/OPN1MW in individual cells.
Heatmap of top 20 differentially expressed genes between L/M‐cones and S‐cones. The color depicts normalized gene expression (z‐score capped at 2.5).
Expression pattern of glial markers in Muller glia (C9) and retinal astrocytes (C16). The x‐axis depicts normalized transcript levels.
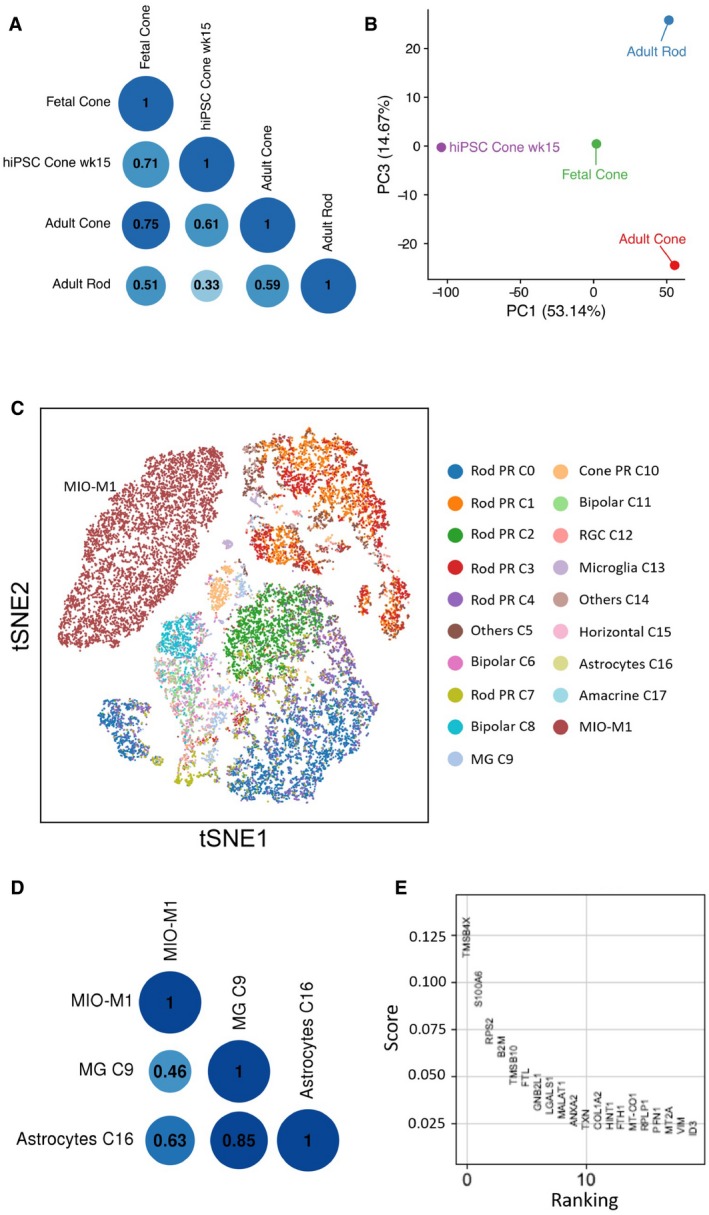
Correlation analysis of scRNA‐seq data of hiPSC‐derived cone photoreceptors (week 15) against fetal cone photoreceptors (Welby et al, 2017), as well as adult cone and rod photoreceptors from this human neural retina atlas.
Principal component analysis to assess transcriptome similarity of hiPSC‐derived cone photoreceptors to fetal and adult photoreceptors.
t‐SNE analysis of the human Müller glia cell line MIO‐M1 with the retinal cell types identified in this human neural retina atlas.
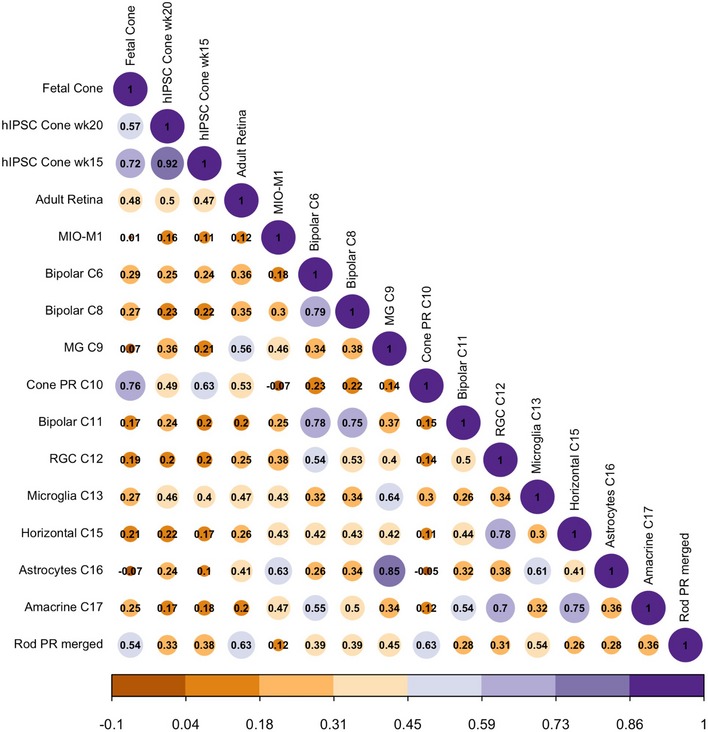
Correlation analysis of MIO‐M1 with all major human retinal cell types.
Top ranked differentially expressed genes identified in MIO‐M1 compared to other retinal cell types based on logistic regression score.
References
-
- Blackshaw S, Fraioli RE, Furukawa T, Cepko CL (2001) Comprehensive analysis of photoreceptor gene expression and the identification of candidate retinal disease genes. Cell 107: 579–589 - PubMed
-
- Boon CJF, den Hollander AI, Hoyng CB, Cremers FPM, Klevering BJ, Keunen JEE (2008) The spectrum of retinal dystrophies caused by mutations in the peripherin/RDS gene. Prog Retin Eye Res 27: 213–235 - PubMed
Publication types
MeSH terms
Substances
Grants and funding
LinkOut - more resources
Full Text Sources
Other Literature Sources
