. 2019 Aug 22:8:e48630.
doi: 10.7554/eLife.48630.

Activation mechanism of the insulin receptor revealed by cryo-EM structure of the fully liganded receptor-ligand complex

Affiliations

Activation mechanism of the insulin receptor revealed by cryo-EM structure of the fully liganded receptor-ligand complex

Emiko Uchikawa et al. Elife. .

Abstract

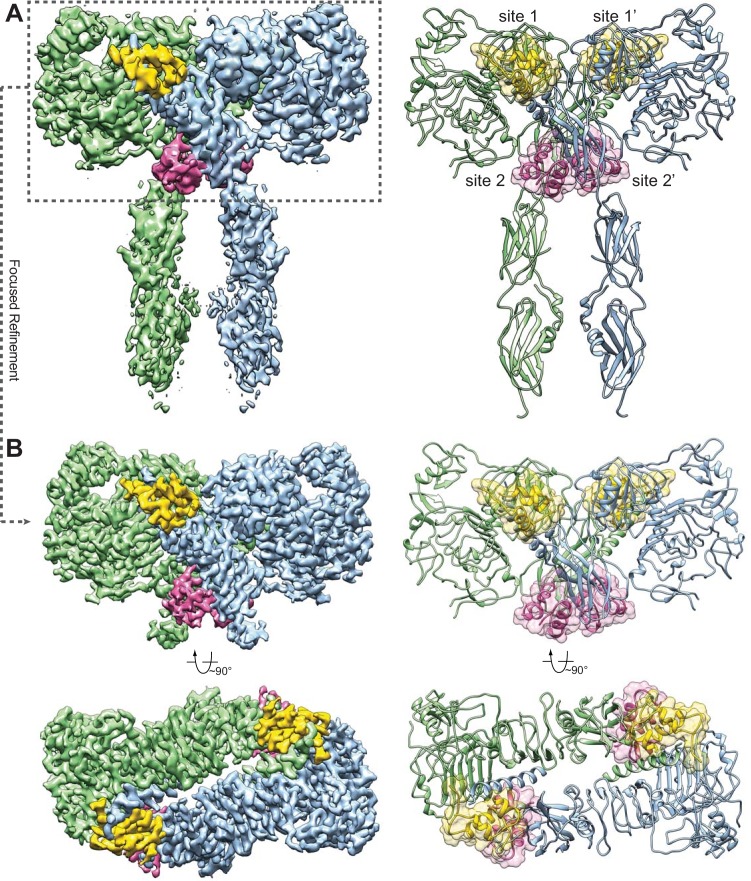
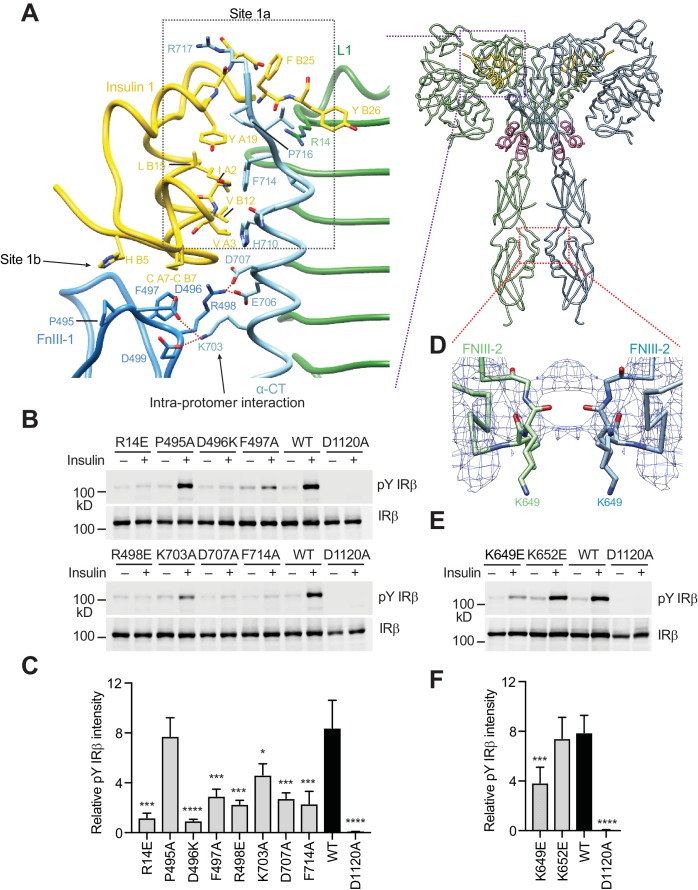
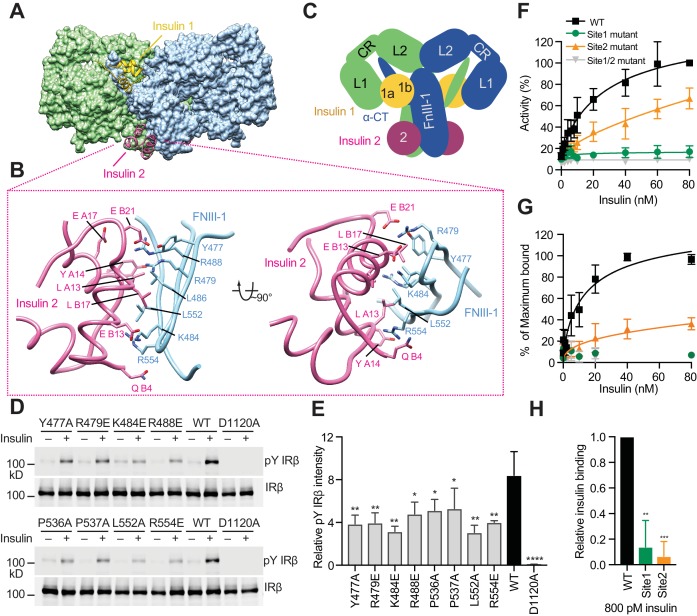
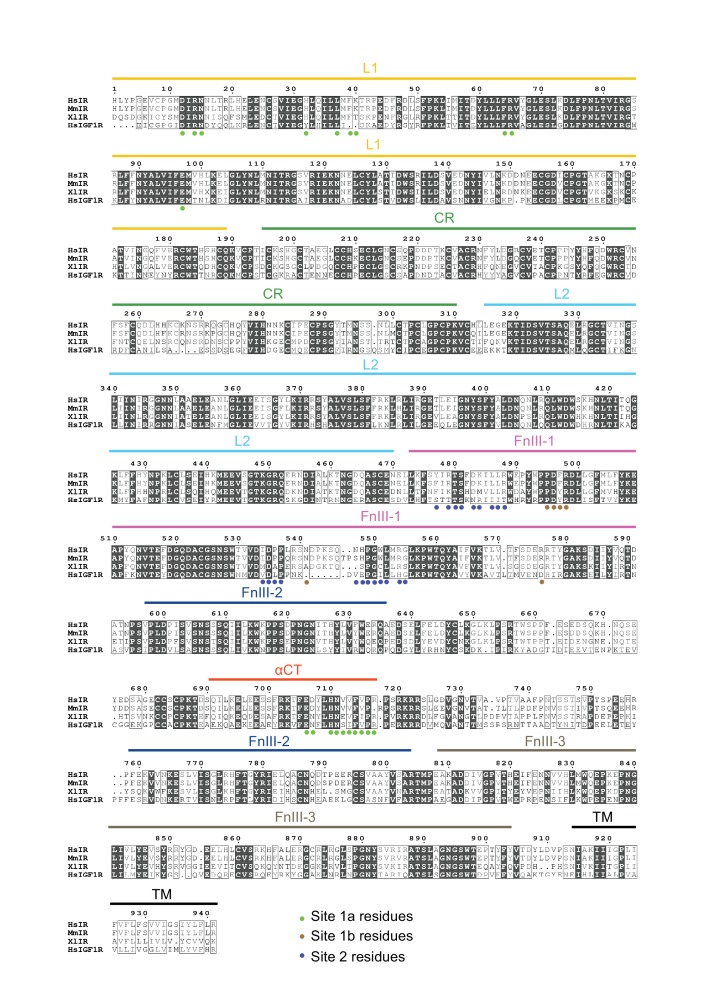
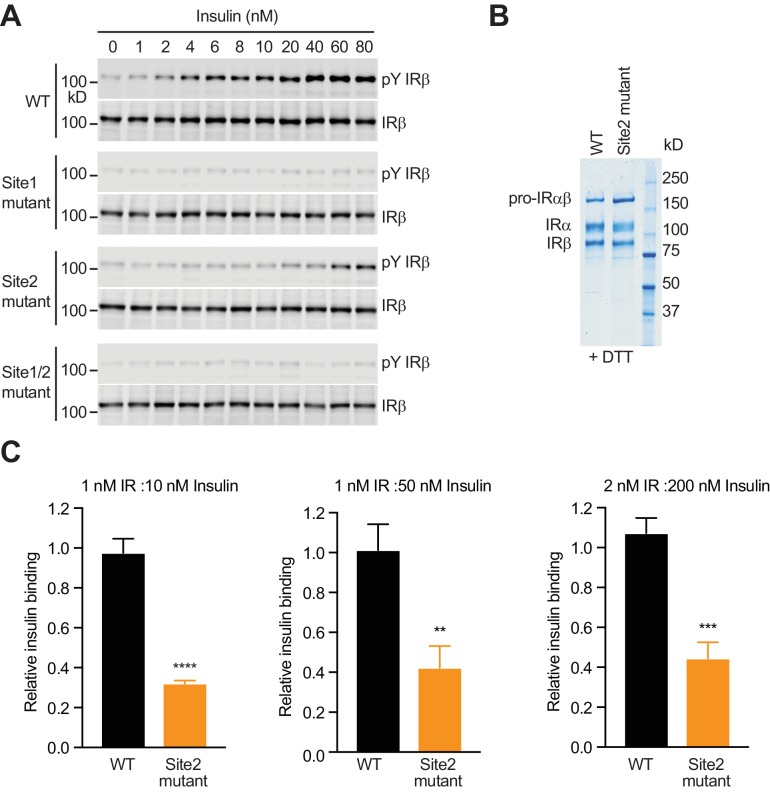
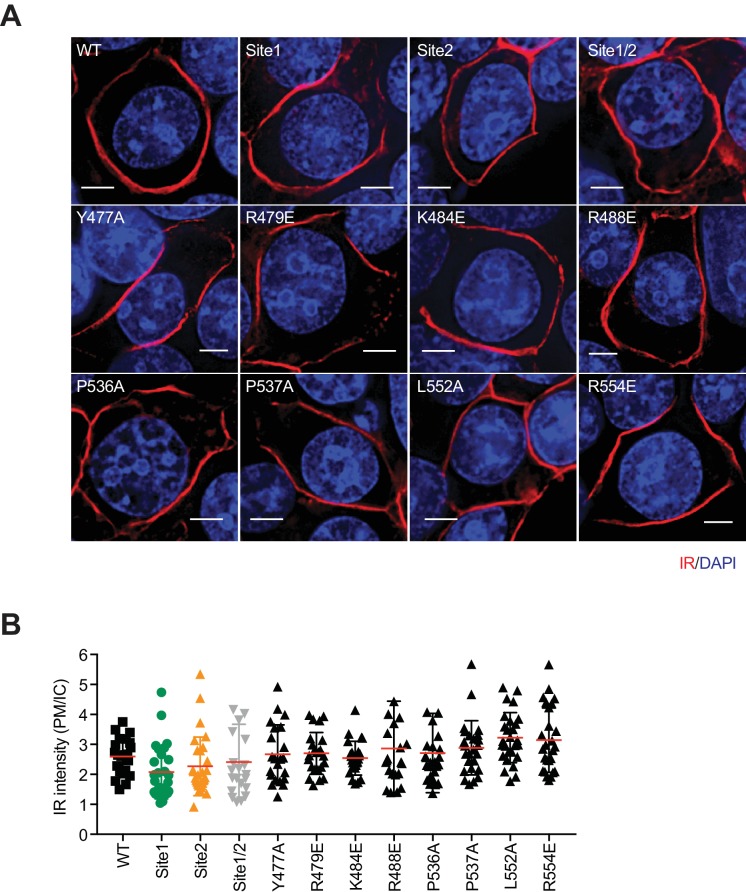
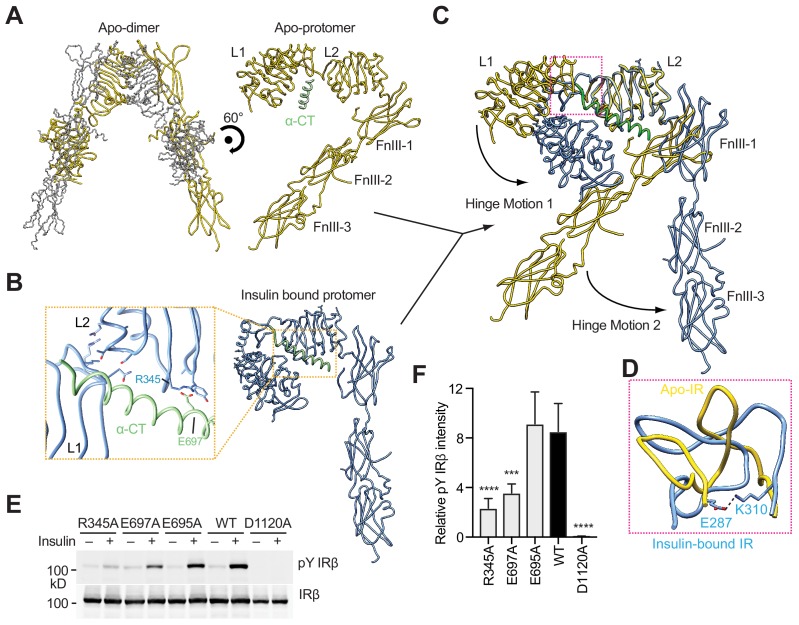
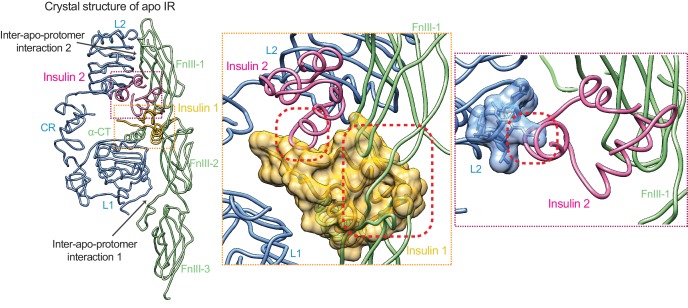
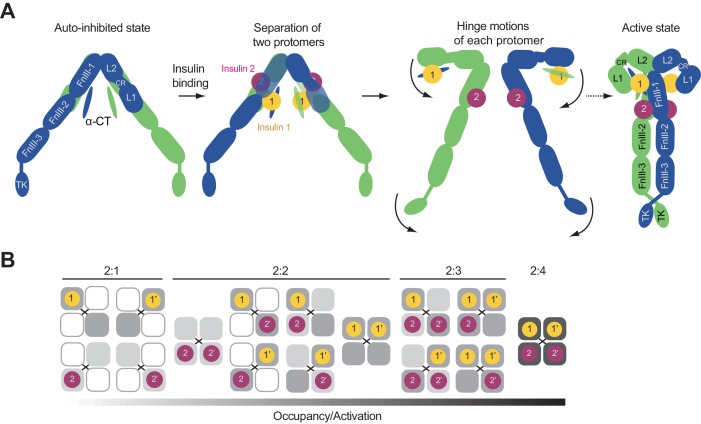
Insulin signaling controls metabolic homeostasis. Here, we report the cryo-EM structure of full-length insulin receptor (IR) and insulin complex in the active state. This structure unexpectedly reveals that maximally four insulins can bind the 'T'-shaped IR dimer at four distinct sites related by 2-fold symmetry. Insulins 1 and 1' bind to sites 1 and 1', formed by L1 of one IR protomer and α-CT and FnIII-1 of the other. Insulins 2 and 2' bind to sites 2 and 2' on FnIII-1 of each protomer. Mutagenesis and cellular assays show that both sites 1 and 2 are required for optimal insulin binding and IR activation. We further identify a homotypic FnIII-2-FnIII-2 interaction in mediating the dimerization of membrane proximal domains in the active IR dimer. Our results indicate that binding of multiple insulins at two distinct types of sites disrupts the autoinhibited apo-IR dimer and stabilizes the active dimer.

Keywords: cryo-EM; human; insulin receptor; molecular biophysics; site 2; structural biology.


Conflict of interest statement

EU, EC, GS, HY, XB No competing interests declared

Figures

Figure 1.
Figure 1.. Overall structure of the IR–insulin complex.
(A) 3D reconstruction of the IR dimer with four insulins bound (left) and the corresponding ribbon representation of this complex (right). (B) 3D reconstruction of IR dimer with four insulins bound after forced 3D refinement (left) and the corresponding ribbon representation (right).
Figure 1—figure supplement 1.
Figure 1—figure supplement 1.. Purification of the full-length human insulin receptor (IR).
(A) A representative size-exclusion chromatogram of IR. The peak fractions were visualized on SDS–PAGE by Coomassie staining, in the absence or presence of DTT. Most of IR was processed into α-chain and β-chain. (B) Domain organization of IR. Regions that are not built in the model are drawn with dashed lines. C647 and C860 make an intra-protomer α/β disulfide bond. C524–C524 and C683–C683 make inter-protomer disulfide bonds. (C) Binding of insulin labeled with Alexa Fluor 488 to purified IR WT or IR site two mutant (Mean ± SD). Each experiment was repeated three times. Significance calculated using two-tailed student t-test; between WT and mutants; ****p<0.0001. (D) Representative western blot images of the amount of IR in C.
Figure 1—figure supplement 2.
Figure 1—figure supplement 2.. Flowchart of cryo-EM data processing.
Figure 1—figure supplement 3.
Figure 1—figure supplement 3.. Cryo-EM analysis of the IR–insulin complex.
(A) Representative electron micrograph and 2D class averages of the IR–insulin complex. (B) Unsharpened cryo-EM map colored by local resolution. (C) The gold-standard Fourier shell correlation curve for the cryo-EM map shown in Figure 1B. (D) FSC curves for the refined model versus the summed map (black curve), the refined model versus half map 1 (red curve), and the refined model versus half map two that was not used for refinement (green curve). (E) Euler angle distribution of particles used in the final 3D reconstructions.
Figure 1—figure supplement 4.
Figure 1—figure supplement 4.. Cryo-EM density of the IR–insulin complex.
(A) Representative densities of the cryo-EM map of each domain of IR, insulins 1 and 2 are shown. (B) Cryo-EM density of the transmembrane (TM) domain. Inset, close-up view of the TM domain. The TM sequence was not assigned due to the lack of clear side-chain densities.
Figure 1—figure supplement 5.
Figure 1—figure supplement 5.. Detecting variations in insulin occupancies of IR by focused classification.
(A) Symmetry expanded focused classification on insulin two with signal subtraction of IR. (B) The classification resulted three types of insulin occupancies of IR with different populations.
Figure 2.
Figure 2.. A tripartite interface between insulin one and IR site one stabilizes the active IR dimer.
(A) Close-up view of the tripartite interaction between insulin 1 and IR L1, α-CT, and FnIII-1 domains (left panel) and ribbon diagram of the IR–insulin complex (right panel). The location of this interaction in the IR active dimer is indicated by a purple box in the right panel. (B) Insulin-induced IR autophosphorylation in 293FT cells expressing IR wild-type (WT) or indicated point mutants that were expected to lose the tripartite interaction. The IR kinase-dead mutant (D1120A) was used as the negative control. (C) Quantification of the western blot data shown in B) (Mean ± SD). Each experiment was repeated three times. Significance calculated using two-tailed students t-test; between WT and mutants; *p<0.05, ***p<0.001, and ****p<0.0001. (D) Close-up view of the homotypic interaction between two adjacent FnIII-2 domains. The location of this interaction in the IR active dimer is indicated by a red box in A) (right panel). (E) Insulin-induced IR autophosphorylation in 293FT cells expressing IR WT and the indicated mutants. The kinase dead mutant (D1120A) was used as the negative control. (F) Quantification of the western blot data shown in E) (Mean ± SD). Each experiment was repeated four times. Significance calculated using two-tailed students t-test; between WT and mutants; ***p<0.001 and ****p<0.0001.
Figure 3.
Figure 3.. Insulin 2 binds to a novel binding site on the FnIII-1 domain of IR.
(A) Overall view of the two distinct insulin-binding sites. (B) Close-up view of insulin-binding site 2. (C) Cartoon representation of the IR–insulin complex depicting the two distinct types of insulin-binding sites (total of 4 sites per IR dimer related by 2-fold symmetry). (D) Insulin-induced IR autophosphorylation in 293FT cells expressing IR wild-type (WT) or the indicated site 2 mutants, assessed by quantitative western blotting with a phospho-tyrosine (pY) IRβ antibody. Kinase dead mutant (D1120A) was used as a negative control. Expression levels of IRβ are monitored by anti-Myc blotting against the C-terminal Myc-tag. (E) Quantification of the western blot data shown in D (Mean ± SD). Each experiment was repeated three times. Significance calculated using two-tailed students t-test; between WT and mutants, *p<0.05, **p<0.01, and ****p<0.0001. (F) Dose-responsive curves of the insulin-stimulated autophosphorylation of wild-type (WT) IR or IR mutants (Mean ± SD). Site 1 mutant, R14E; site 2 mutant K484E/L552A; site 1/2 mutant, R14E/K484E/L552A. Significance calculated using One-way ANOVA with Brown-Forsythe test; between WT and mutants, p<0.0001. See Figure 3—figure supplement 2A. (G) Binding of insulin labeled with Alexa Fluor 488 to 293FT cells expressing IR WT or IR mutants (Mean ± SD). Significance calculated using One-way ANOVA with Brown-Forsythe test; between WT and site 2 mutant, p<0.0001. Symbols are the same as in F. (H) Binding of insulin labeled with Alexa Fluor 488 to 293FT cells expressing IR WT or IR mutants at 800 pM concentration of insulin. Significance calculated using two-tailed students t-test; between WT and mutants, **p<0.01, and ***p<0.001.
Figure 3—figure supplement 1.
Figure 3—figure supplement 1.. Sequence alignment of IR proteins from human (Hs), mouse (Mm), xenopus (Xl), and Hs IGF1R.
The insulin-binding site residues are marked.
Figure 3—figure supplement 2.
Figure 3—figure supplement 2.. Dose dependency of IR activation by insulin.
(A) Western blots of insulin-dependent IR autophosphorylation in 293FT cells expressing Myc-tagged IR wild-type (WT), site 1 mutant (R14E), site 2 mutant (K484E/L552A), or site 1/2 mutant (R14E/K484E/L552A). Expression levels of IR were monitored by the anti-Myc blots of the C-terminal Myc-tag. This results were used to generate Figure 3F. (B) Coomassie blue-stained SDS-PAGE gel of IR WT and site 2 mutant proteins under reducing conditions (+DTT). (C) Binding of insulin labeled with Alexa Fluor 488 to purified IR WT or IR site 2 mutant in the indicated conditions (Mean ± SD). Each experiment was repeated three times. Significance calculated using two-tailed students t-test; between WT and mutants, **p<0.01, ***p<0.001, and ****p<0.0001.
Figure 3—figure supplement 3.
Figure 3—figure supplement 3.. Cellular localization of IR WT and mutants.
(A) Representative images of IR WT and mutants. 239FT cells were transfected with Myc-tagged IR WT or mutants, serum starved, and stained with anti-Myc (IR; red) antibody and DAPI (blue). Scale bars, 5 μm. (B) Quantification of the ratios of plasma membrane (PM) and intracellular compartment (IC) IR-Myc signals of cells in A (mean ± SD; ****p<0.0001).
Figure 4.
Figure 4.. Hinge motions of IR protomers upon insulin binding.
(A) Overall view of apo-IR dimer and protomer. (B) Overall view of IR protomer with insulinbound in a more compacted active conformation. Inset (yellow box), close-up view of the inter-domain interactions that stabilize the active conformation. (C) Superposition between insulin-free IR protomer (yellow) and insulin-bound IR protomer (blue) by aligning the L2 domain, revealing two different hinge motions. (D) Superposition of the loop connecting CR and L2 (residues 302–310) of the insulin-free IR protomer (yellow) onto that of insulin-bound IR protomer (blue). The location of this loop in the IR protomer is indicated by a pink box in C. (E) Insulin-induced IR autophosphorylation in 293FT cells expressing wild-type (WT) IR or indicated mutants. The kinase dead mutant (D1120A) was used as a negative control. (F) Quantification of the western blot data shown in E (Mean ± SD). Each experiment was repeated five times. Significance calculated using two-tailed students t-test; between WT and mutants, ***p<0.001 and ****p<0.0001.
Figure 5.
Figure 5.. Activation mechanism of IR.
The crystal structure of apo-IR dimer (PDB: 4ZXB) superimposed with insulins 1 and 2, by aligning the insulin-free and insulin 1-bound L1 domains, and the insulin-free and insulin 2-bound FnIII-1 domain, respectively. Half of the apo-dimer is omitted for clarity. Upper inset (purple box), insulin 2 binding at apo-IR sterically clashes with the opposite protomer. Lower inset (yellow box), insulin 1 binding at apo-IR sterically clashes with the opposite protomer, as well as insulin 1. The clash sites are indicated by dashed red boxes.
Figure 6.
Figure 6.. Proposed working model of insulin induced activation of IR.
(A) Cartoon representation of a working model for insulin-induced IR activation. (B) Binding of IR and insulin in a concentration-dependent manner. Insulin binding at IR site 1 and site 2 is required for IR activation.
Author response image 1.
Author response image 1.. EM analysis of IR.
Some representative classes that are not selected for further processing are highlighted in red box.

References

    1. Adams PD, Afonine PV, Bunkóczi G, Chen VB, Davis IW, Echols N, Headd JJ, Hung LW, Kapral GJ, Grosse-Kunstleve RW, McCoy AJ, Moriarty NW, Oeffner R, Read RJ, Richardson DC, Richardson JS, Terwilliger TC, Zwart PH. PHENIX: a comprehensive Python-based system for macromolecular structure solution. Acta Crystallographica Section D Biological Crystallography. 2010;66:213–221. doi: 10.1107/S0907444909052925. - DOI - PMC - PubMed
    1. Bai XC, Rajendra E, Yang G, Shi Y, Scheres SH. Sampling the conformational space of the catalytic subunit of human γ-secretase. eLife. 2015;4:e11182. doi: 10.7554/eLife.11182. - DOI - PMC - PubMed
    1. Chan SJ, Nakagawa S, Steiner DF. Complementation analysis demonstrates that insulin cross-links both alpha subunits in a truncated insulin receptor dimer. Journal of Biological Chemistry. 2007;282:13754–13758. doi: 10.1074/jbc.M700724200. - DOI - PubMed
    1. Choi E, Zhang X, Xing C, Yu H. Mitotic checkpoint regulators control insulin signaling and metabolic homeostasis. Cell. 2016;166:567–581. doi: 10.1016/j.cell.2016.05.074. - DOI - PMC - PubMed
    1. Choi E, Kikuchi S, Gao H, Brodzik K, Nassour I, Yopp A, Singal AG, Zhu H, Yu H. Mitotic regulators and the SHP2-MAPK pathway promote IR endocytosis and feedback regulation of insulin signaling. Nature Communications. 2019;10:1473. doi: 10.1038/s41467-019-09318-3. - DOI - PMC - PubMed

Publication types