. 2019 Aug 22;14(8):e0220894.
doi: 10.1371/journal.pone.0220894. eCollection 2019.

System analysis of cross-talk between nuclear receptors reveals an opposite regulation of the cell cycle by LXR and FXR in human HepaRG liver cells

Affiliations

System analysis of cross-talk between nuclear receptors reveals an opposite regulation of the cell cycle by LXR and FXR in human HepaRG liver cells

Leonore Wigger et al. PLoS One. .

Abstract

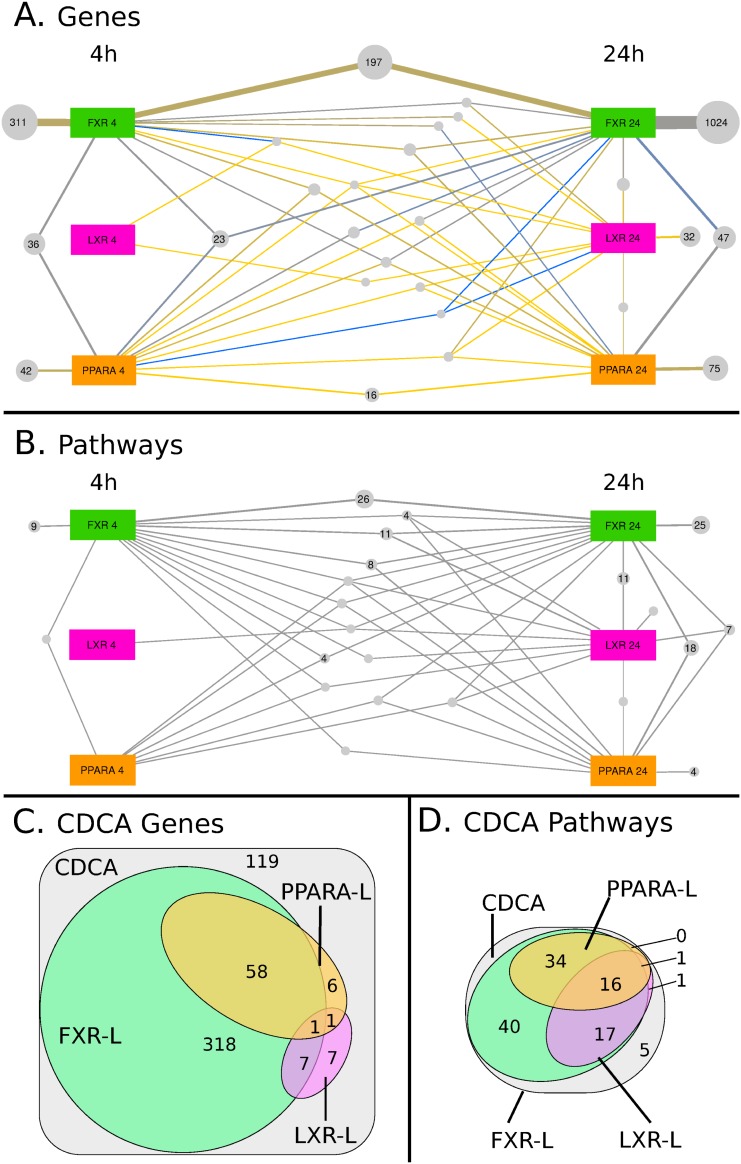
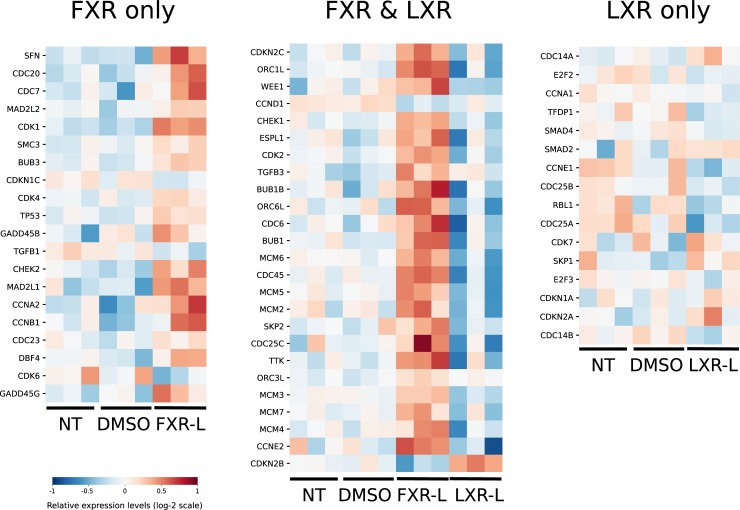
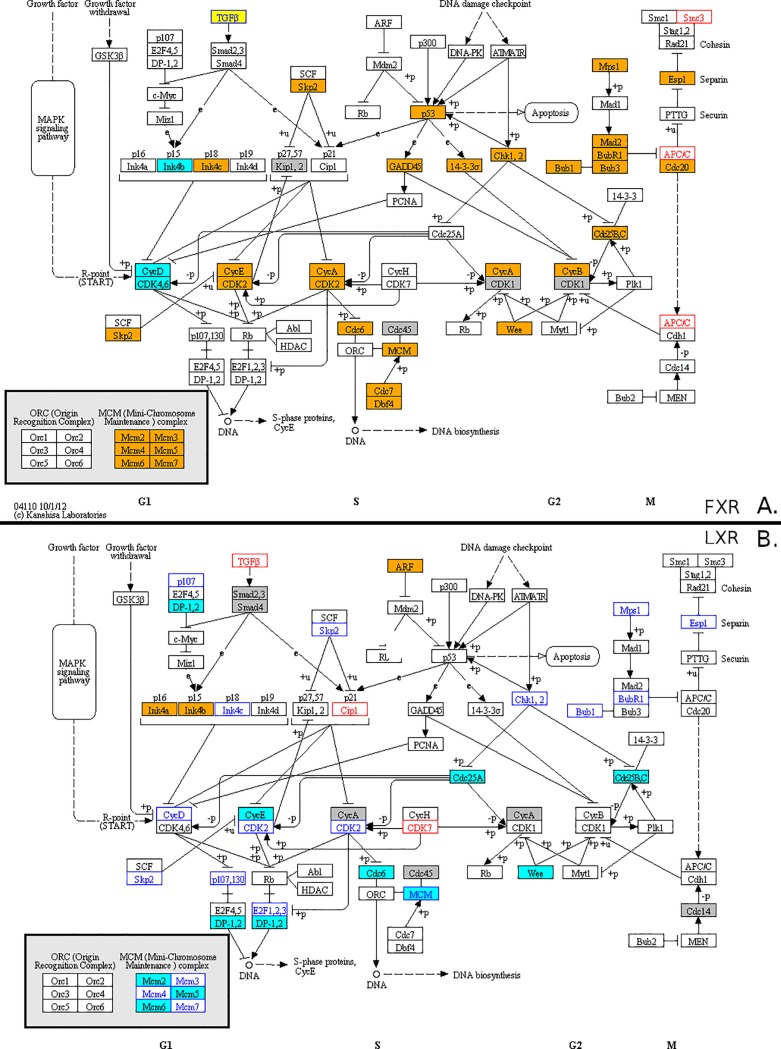
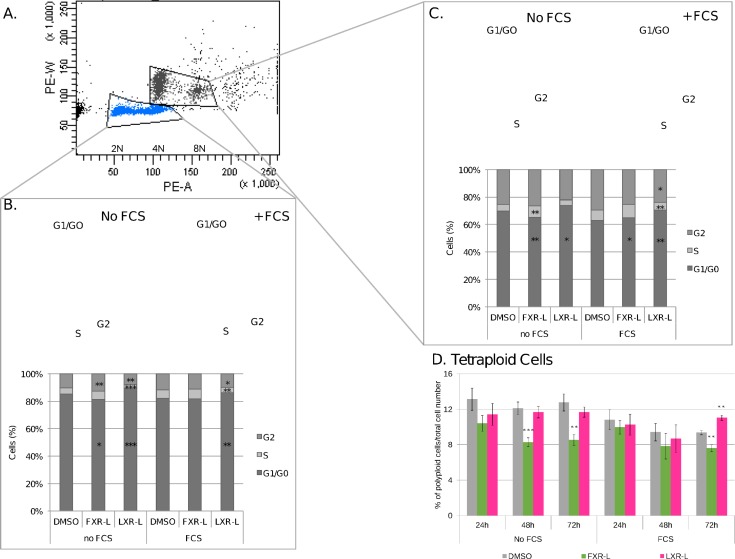
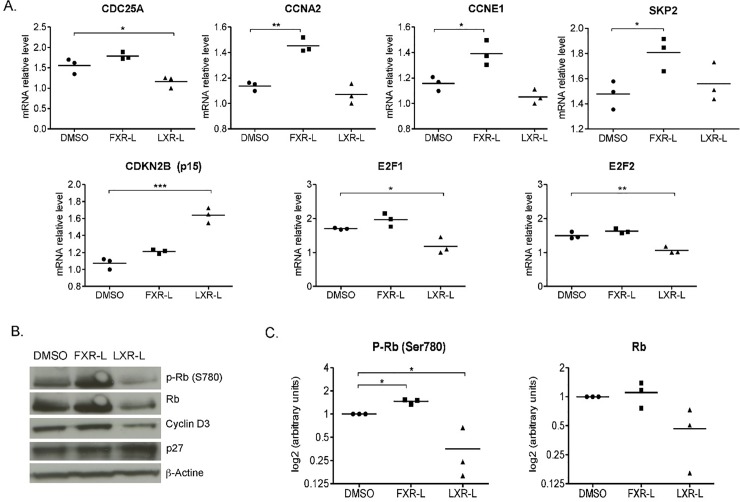
Transcriptional regulations exert a critical control of metabolic homeostasis. In particular, the nuclear receptors (NRs) are involved in regulating numerous pathways of the intermediate metabolism. The purpose of the present study was to explore in liver cells the interconnectedness between three of them, LXR, FXR, and PPARα, all three known to act on lipid and glucose metabolism, and also on inflammation. The human cell line HepaRG was selected for its best proximity to human primary hepatocytes. Global gene expression of differentiated HepaRG cells was assessed after 4 hours and 24 hours of exposure to GW3965 (LXR agonist), GW7647 (PPARα agonist), and GW4064 and CDCA (FXR synthetic and natural agonist, respectively). Our work revealed that, contrary to our expectations, NR specificity is largely present at the level of target genes, with a smaller than expected overlap of the set of genes targeted by the different NRs. It also highlighted the much broader activity of the synthetic FXR ligand compared to CDCA. More importantly, our results revealed that activation of FXR has a pro-proliferative effect and decreases the number of tetraploid (or binucleated) hepatocytes, while LXR inhibits the cell cycle progression, inducing hepatocyte differentiation and an increase in tetraploidism. Conclusion: these results highlight the importance of analyzing the different NR activities in a context allowing a direct confrontation of each receptor outcome, and reveals the opposite role of FXR and LXR in hepatocyte cells division and maturation.


Conflict of interest statement

This study was supported by the Etat de vaud, FNRS (grant 31003A_135583/1 and 310030_156771/1; BD) Novartis (Grant to CC), and FP7 NR-NET (606806; BD). This does not alter our adherence to PLOS ONE policies on sharing data and materials.

Figures

Fig 1
Fig 1. Visual Representation of the specific and shared effects of the treatments.
(A, B) Panels A and B show the overlapping effects at both time-points of the 3 synthetic ligands (FXR-L, LXR-L, and PPARA-L). Large colored squares denote the treatments at 4h (on the left) or at 24h (on the right), while grey bubbles denote groups of regulated genes (A) or of enriched pathways (B), which are associated to the same set of treatments. For example, panel A shows that 1532 genes are regulated only by FXR-L: 311 only after 4h, 197 at both time-points and 1024 only at 24h. The size of the bubbles and of the connections with their associated treatments is proportional to the number of genes or pathways in the group. In panel A, the color of the connection further indicates the ratio between genes that are activated (yellow) or inhibited (blue) by this treatment. The original Cytoscape files are available as supplementary material and a summary of the observed overlap is available in Table 1. (C, D) The Venn diagrams in panels C and D show the overlapping effects of the CDCA natural ligand with the 3 synthetic ligands, without further separating the time-points for the sake of simplicity. The areas denote groups of regulated genes (C) or of enriched pathways (D) affected by the CDCA treatment.
Fig 2
Fig 2. Effect of FXR-L and LXR-L treatments on genes associated to the cell-cycle pathway.
These heatmaps show the expression levels of genes driving the cell-cycle pathway at 24h for the FXR-L and LXR-L treatments compared to the controls (non-treated (NT) and DMSO-treated) according to GSEA (see methods and supplementary material). For each gene, the 9 experimental values (normalized microarray expression levels) are centered around their mean (in white). Higher values appear in red, while lower values are blue. Each of the 3 heatmaps corresponds to a group of genes belonging to the cell cycle pathway that are affected by only FXR-L on the left, only LXR-L on the right) or by both treatments (center). With FXR-L treatment, most genes are up-regulated, while they are down-regulated with LXR-L. Among the 25 genes regulated by the two treatments, only 3 have the same profile in the two conditions (TGFB3, ORC3L and CCND1).
Fig 3
Fig 3. Visualisation of the effects of FXR-L and LXR-L on the KEGG cell cycle pathway map.
Genes found in the leading edge of the cell cycle pathway at 24h after FXR-L (panel A) and LXR-L (panel B) treatments are highlighted. Boxes with a blue (resp. orange) background denote down-regulated (resp. up-regulated) genes (|log fold change| > 1.2). White boxes with blue (resp. red) text denote smaller down-regulations (resp. up-regulations). Grey boxes denote genes which are not differentially expressed despite appearing in the leading edge. The yellow TGFβ box in panel A corresponds to the TGFβ1, TGFβ2 and TGFβ3 genes that are regulated in opposite directions.
Fig 4
Fig 4. FXR and LXR affect the cell progression and the ploidy of HepaRG cells.
The cell cycle distribution and the ploidy were analyzed by PI staining and FACS. (A) The panel shows the group of HepaRG cells, the diploid cells (2N) and tetraploid cells (4N), (B, C) The panels and the graphs show the cell cycle distribution at 72h of treatment with DMSO, FXR-L 1 uM or LXR-L 2 uM. D. The graph shows the percentage of tetraploid cells at 24h, 48h and 72h with the different treatments. *: p-value < 0.05, ** < 0.01, *** < 0.001 versus DMSO (Student’s t test). N = 8.
Fig 5
Fig 5
Validation of the effects of FXR and LXR on cell cycle regulators by RT-qPCR (A) and Western blot (B). HepaRG cells have been treated 24h in the same condition as for the microarrays (same ligands and DMSO as control). (A) Relative mRNA levels for genes regulated in the microarray data. (B) Representative Western blot of Retinoblastoma (Rb), phospho-Rb, Cyclin D3, and p27 in whole HepaRG cell lysates. (C) densitometric quantification of phospho-Rb and Rb. *: p-value < 0.05, ** < 0.01 versus DMSO (Student’s t test). N = 3.

References

    1. Francis GA, Fayard E, Picard F, Auwerx J. Nuclear receptors and the control of metabolism. Annu Rev Physiol. 2003;65:261–311. 10.1146/annurev.physiol.65.092101.142528 . - DOI - PubMed
    1. Desvergne B, Michalik L, Wahli W. Transcriptional regulation of metabolism. Physiol Rev. 2006;86(2):465–514. Epub 2006/04/08. doi: 86/2/465 [pii] 10.1152/physrev.00025.2005 . - DOI - PubMed
    1. Calkin AC, Tontonoz P. Transcriptional integration of metabolism by the nuclear sterol-activated receptors LXR and FXR. Nat Rev Mol Cell Biol. 2012;13(4):213–24. 10.1038/nrm3312 - DOI - PMC - PubMed
    1. Gripon P, Rumin S, Urban S, Le Seyec J, Glaise D, Cannie I, et al. Infection of a human hepatoma cell line by hepatitis B virus. Proc Natl Acad Sci U S A. 2002;99(24):15655–60. 10.1073/pnas.232137699 - DOI - PMC - PubMed
    1. Hart SN, Li Y, Nakamoto K, Subileau EA, Steen D, Zhong XB. A comparison of whole genome gene expression profiles of HepaRG cells and HepG2 cells to primary human hepatocytes and human liver tissues. Drug Metab Dispos. 2010;38(6):988–94. 10.1124/dmd.109.031831 - DOI - PMC - PubMed

Publication types

MeSH terms