

Hyperpolarized 13 C magnetic resonance spectroscopy detects toxin-induced neuroinflammation in mice
- PMID: 31437326
- PMCID: PMC6817388
- DOI: 10.1002/nbm.4164
Hyperpolarized 13 C magnetic resonance spectroscopy detects toxin-induced neuroinflammation in mice
Abstract
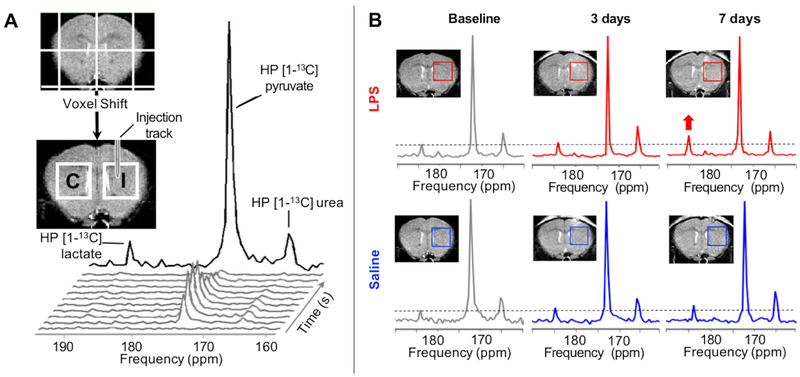
Lipopolysaccharide (LPS) is a commonly used agent for induction of neuroinflammation in preclinical studies. Upon injection, LPS causes activation of microglia and astrocytes, whose metabolism alters to favor glycolysis. Assessing in vivo neuroinflammation and its modulation following therapy remains challenging, and new noninvasive methods allowing for longitudinal monitoring would be highly valuable. Hyperpolarized (HP) 13 C magnetic resonance spectroscopy (MRS) is a promising technique for assessing in vivo metabolism. In addition to applications in oncology, the most commonly used probe of [1-13 C] pyruvate has shown potential in assessing neuroinflammation-linked metabolism in mouse models of multiple sclerosis and traumatic brain injury. Here, we aimed to investigate LPS-induced neuroinflammatory changes using HP [1-13 C] pyruvate and HP 13 C urea. 2D chemical shift imaging following simultaneous intravenous injection of HP [1-13 C] pyruvate and HP 13 C urea was performed at baseline (day 0) and at days 3 and 7 post-intracranial injection of LPS (n = 6) or saline (n = 5). Immunofluorescence (IF) analyses were performed for Iba1 (resting and activated microglia/macrophages), GFAP (resting and reactive astrocytes) and CD68 (activated microglia/macrophages). A significant increase in HP [1-13 C] lactate production was observed at days 3 and 7 following injection, in the injected (ipsilateral) side of the LPS-treated mouse brain, but not in either the contralateral side or saline-injected animals. HP 13 C lactate/pyruvate ratio, without and with normalization to urea, was also significantly increased in the ipsilateral LPS-injected brain at 7 days compared with baseline. IF analyses showed a significant increase in CD68 and GFAP staining at 3 days, followed by increased numbers of Iba1 and GFAP positive cells at 7 days post-LPS injection. In conclusion, we can detect LPS-induced changes in the mouse brain using HP 13 C MRS, in alignment with increased numbers of microglia/macrophages and astrocytes. This study demonstrates that HP 13 C spectroscopy has substantial potential for providing noninvasive information on neuroinflammation.
Keywords: hyperpolarized 13C MRS; lipopolysaccharide; metabolism; neuroinflammation.
© 2019 John Wiley & Sons, Ltd.
Figures


References
-
- Andersson P-B, Perry VH, Gordon† S. The acute inflammatory response to lipopolysaccharide in cns parenchyma differs from that in other body tissues. Neuroscience. 1992;48(1):169–186. - PubMed
-
- Herber DL, Mercer M, Roth LM, et al. Microglial Activation is Required for Aβ Clearance After Intracranial Injection of Lipopolysaccharide in APP Transgenic Mice. J Neuroimmune Pharmacol. 2007;2(2):222–231. - PubMed
-
- Nordgreen J, Munsterhjelm C, Aae F, et al. The effect of lipopolysaccharide (LPS) on inflammatory markers in blood and brain and on behavior in individually-housed pigs. Physiol Behav. 2018;195:98–111. - PubMed
-
- Espinosa-Oliva AM, de Pablos RM, Herrera AJ. Intracranial Injection of LPS in Rat as Animal Model of Neuroinflammation In: Methods in Molecular Biology (Clifton, N.J.). Vol 1041 Humana Press, Totowa, NJ; 2013:295–305. - PubMed
Publication types
MeSH terms
Substances
Grants and funding
LinkOut - more resources
Full Text Sources
Research Materials
Miscellaneous
